Mga Batayang Estadistika
| Nilai Portofolio | $ 4,787,891 |
| Posisi Saat Ini | 110 |
Kepemilikan Terbaru, Kinerja, AUM (dari 13F, 13D)
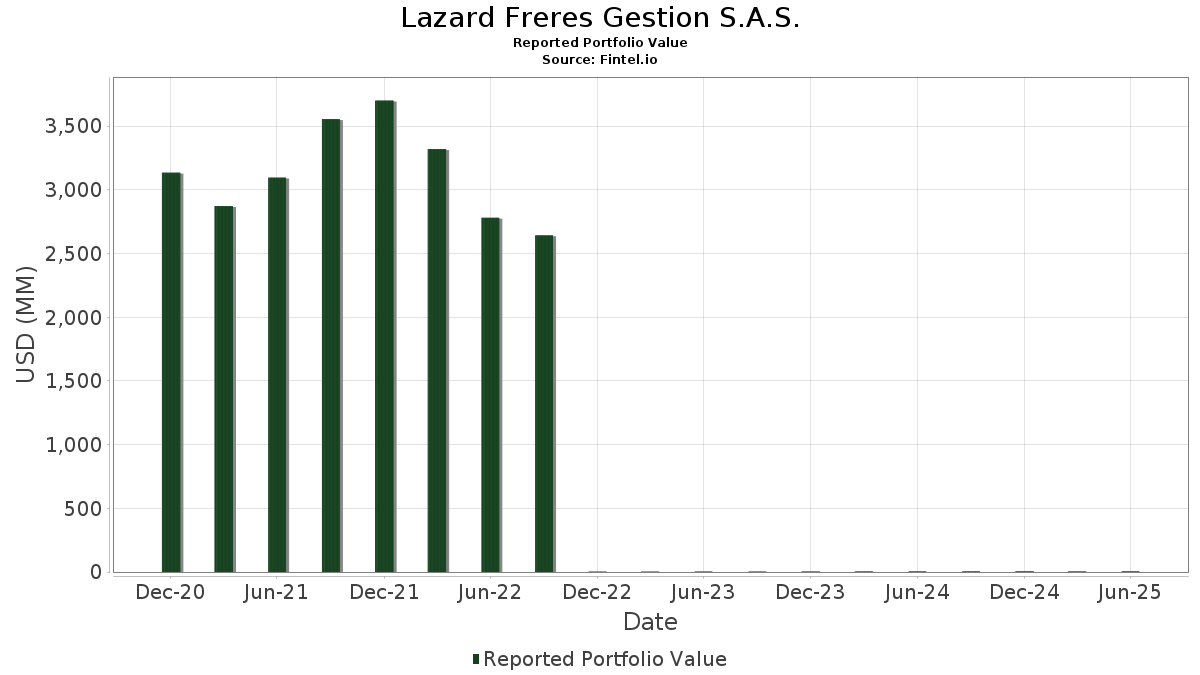
Lazard Freres Gestion S.A.S. telah mengungkapkan total kepemilikan 110 dalam pengajuan SEC terbaru mereka. Nilai portofolio terbaru dihitung sebesar $ 4,787,891 USD. Aset yang Dikelola (AUM) sebenarnya adalah nilai ini ditambah kas (yang tidak diungkapkan). Aset-aset utama Lazard Freres Gestion S.A.S. adalah Microsoft Corporation (US:MSFT) , Amazon.com, Inc. (US:AMZN) , Apple Inc. (US:AAPL) , Alphabet Inc. (US:GOOGL) , and NVIDIA Corporation (US:NVDA) . Posisi baru Lazard Freres Gestion S.A.S. meliputi: Pinterest, Inc. (US:PINS) , Tyler Technologies, Inc. (US:TYL) , Vertex, Inc. (US:VERX) , Clearway Energy, Inc. (US:CWEN) , and Acuity Inc. (US:AYI) .
Peningkatan Tertinggi Kuartal Ini
Kami menggunakan perubahan dalam alokasi portofolio karena ini adalah metrik yang paling bermakna. Perubahan dapat disebabkan oleh perdagangan atau perubahan harga saham.
| Keamanan | Saham (MM) |
Nilai (Juta Dolar AS) |
Portfolio % | ΔPorsyento ng Portfolio |
|---|---|---|---|---|
| 1.02 | 0.51 | 10.5569 | 1.7578 | |
| 0.00 | 0.23 | 4.8584 | 1.3567 | |
| 0.08 | 0.04 | 0.8450 | 0.8008 | |
| 0.08 | 0.06 | 1.2584 | 0.5340 | |
| 0.17 | 0.12 | 2.6073 | 0.4786 | |
| 0.57 | 0.10 | 2.1856 | 0.4475 | |
| 1.46 | 0.32 | 6.6981 | 0.4337 | |
| 0.08 | 0.04 | 0.8528 | 0.4087 | |
| 0.08 | 0.08 | 1.5892 | 0.4065 | |
| 0.00 | 0.05 | 1.1052 | 0.3841 |
Penurunan Tertinggi Kuartal Ini
Kami menggunakan perubahan dalam alokasi portofolio karena ini adalah metrik yang paling bermakna. Perubahan dapat disebabkan oleh perdagangan atau perubahan harga saham.
| Keamanan | Saham (MM) |
Nilai (Juta Dolar AS) |
Portfolio % | ΔPorsyento ng Portfolio |
|---|---|---|---|---|
| 0.51 | 0.09 | 1.8496 | -1.5789 | |
| 0.28 | 0.04 | 0.8442 | -1.1994 | |
| 0.63 | 0.22 | 4.6780 | -0.8715 | |
| 0.19 | 0.01 | 0.2259 | -0.5346 | |
| 0.58 | 0.17 | 3.6001 | -0.5238 | |
| 1.04 | 0.16 | 3.3830 | -0.4703 | |
| 1.41 | 0.25 | 5.2014 | -0.4686 | |
| 0.09 | 0.04 | 0.7446 | -0.4133 | |
| 1.44 | 0.13 | 2.6204 | -0.3973 | |
| 1.23 | 0.25 | 5.2676 | -0.3439 |
Pengajuan 13F dan Dana
Formulir ini diajukan pada 2025-07-31 untuk periode pelaporan 2025-06-30. Klik ikon tautan untuk melihat riwayat transaksi selengkapnya.
Tingkatkan ke versi premium untuk membuka data premium dan ekspor ke Excel. ![]() .
.
| Keamanan | Ketik | Harga Saham Rata-rata | Saham (MM) |
ΔSaham (%) |
ΔSaham (%) |
Nilai ($MM) |
Portpolyo (%) |
ΔPortofolio (%) |
|
|---|---|---|---|---|---|---|---|---|---|
| MSFT / Microsoft Corporation | 1.02 | 5.41 | 0.51 | 39.89 | 10.5569 | 1.7578 | |||
| AMZN / Amazon.com, Inc. | 1.46 | 7.95 | 0.32 | 24.51 | 6.6981 | 0.4337 | |||
| AAPL / Apple Inc. | 1.23 | 18.32 | 0.25 | 9.57 | 5.2676 | -0.3439 | |||
| GOOGL / Alphabet Inc. | 1.41 | -6.29 | 0.25 | 6.87 | 5.2014 | -0.4686 | |||
| NVDA / NVIDIA Corporation | 0.00 | -100.00 | 0.23 | 61.11 | 4.8584 | 1.3567 | |||
| V / Visa Inc. | 0.63 | -3.13 | 0.22 | -2.19 | 4.6780 | -0.8715 | |||
| ACN / Accenture plc | 0.58 | 6.10 | 0.17 | 1.78 | 3.6001 | -0.5238 | |||
| RTX / RTX Corporation | 1.14 | 16.98 | 0.17 | 29.69 | 3.4695 | 0.3374 | |||
| ZTS / Zoetis Inc. | 1.04 | 7.91 | 0.16 | 1.90 | 3.3830 | -0.4703 | |||
| MDT / Medtronic plc | 1.44 | 4.21 | 0.13 | 0.81 | 2.6204 | -0.3973 | |||
| META / Meta Platforms, Inc. | 0.17 | 11.35 | 0.12 | 42.53 | 2.6073 | 0.4786 | |||
| MSI / Motorola Solutions, Inc. | 0.29 | 25.39 | 0.12 | 20.00 | 2.5262 | 0.0840 | |||
| AMAT / Applied Materials, Inc. | 0.57 | 16.05 | 0.10 | 46.48 | 2.1856 | 0.4475 | |||
| MRK / Merck & Co., Inc. | 0.00 | -100.00 | 0.09 | 12.20 | 1.9241 | -0.0909 | |||
| APH / Amphenol Corporation | 0.92 | -6.87 | 0.09 | 40.63 | 1.8947 | 0.3215 | |||
| OTIS / Otis Worldwide Corporation | 0.91 | 17.11 | 0.09 | 12.50 | 1.8897 | -0.0682 | |||
| BDX / Becton, Dickinson and Company | 0.51 | -16.48 | 0.09 | -37.59 | 1.8496 | -1.5789 | |||
| PH / Parker-Hannifin Corporation | 0.00 | -100.00 | 0.09 | 45.00 | 1.8341 | 0.3690 | |||
| ECL / Ecolab Inc. | 0.29 | -7.31 | 0.08 | -1.27 | 1.6342 | -0.2971 | |||
| ICE / Intercontinental Exchange, Inc. | 0.42 | 2.42 | 0.08 | 8.45 | 1.6277 | -0.1119 | |||
| COST / Costco Wholesale Corporation | 0.08 | 49.45 | 0.08 | 58.33 | 1.5892 | 0.4065 | |||
| EL / The Estée Lauder Companies Inc. | 0.00 | -100.00 | 0.07 | -5.71 | 1.3922 | -0.3293 | |||
| FTXP / Foothills Exploration, Inc. | 0.07 | -1.16 | 0.07 | 32.00 | 1.3871 | 0.1471 | |||
| DIS / The Walt Disney Company | 0.50 | -14.72 | 0.06 | 6.90 | 1.3080 | -0.1132 | |||
| CL / Colgate-Palmolive Company | 0.67 | 46.01 | 0.06 | 41.86 | 1.2786 | 0.2278 | |||
| MS / Morgan Stanley | 0.43 | 1.61 | 0.06 | 22.45 | 1.2717 | 0.0649 | |||
| LLY / Eli Lilly and Company | 0.08 | 114.27 | 0.06 | 106.90 | 1.2584 | 0.5340 | |||
| HON / Honeywell International Inc. | 0.25 | -0.13 | 0.06 | 9.62 | 1.2069 | -0.0723 | |||
| AVGO / Broadcom Inc. | 0.00 | -100.00 | 0.05 | 79.31 | 1.1052 | 0.3841 | |||
| MAR / Marriott International, Inc. | 0.19 | 29.86 | 0.05 | 50.00 | 1.0670 | 0.2330 | |||
| JPM / JPMorgan Chase & Co. | 0.18 | -3.46 | 0.05 | 13.64 | 1.0630 | -0.0216 | |||
| IDXX / IDEXX Laboratories, Inc. | 0.09 | 11.91 | 0.05 | 41.18 | 1.0183 | 0.1888 | |||
| NKE / NIKE, Inc. | 0.00 | -100.00 | 0.05 | 9.09 | 1.0157 | -0.0562 | |||
| SPY / SPDR S&P 500 ETF | 0.08 | -2.45 | 0.05 | 9.30 | 0.9871 | -0.0794 | |||
| WFC / Wells Fargo & Company | 0.00 | -100.00 | 0.05 | -4.08 | 0.9850 | -0.2296 | |||
| MDLZ / Mondelez International, Inc. | 0.69 | 2.12 | 0.05 | 2.22 | 0.9655 | -0.1419 | |||
| ROST / Ross Stores, Inc. | 0.00 | -100.00 | 0.05 | 2.27 | 0.9433 | -0.1308 | |||
| TMUS / T-Mobile US, Inc. | 0.18 | 2.22 | 0.04 | -8.51 | 0.9134 | -0.2510 | |||
| MCO / Moody's Corporation | 0.08 | 107.58 | 0.04 | 122.22 | 0.8528 | 0.4087 | |||
| SPGI / S&P Global Inc. | 0.08 | 2,046.18 | 0.04 | 3,900.00 | 0.8450 | 0.8008 | |||
| CVX / Chevron Corporation | 0.28 | -43.81 | 0.04 | -52.38 | 0.8442 | -1.1994 | |||
| BRK.B / Berkshire Hathaway Inc. | 0.08 | 6.78 | 0.04 | -2.44 | 0.8424 | -0.1645 | |||
| ADBE / Adobe Inc. | 0.09 | -25.79 | 0.04 | -25.53 | 0.7446 | -0.4133 | |||
| MLM / Martin Marietta Materials, Inc. | 0.05 | 48.78 | 0.03 | 80.00 | 0.5662 | 0.1803 | |||
| SPOT / Spotify Technology S.A. | 0.03 | -10.38 | 0.02 | 26.32 | 0.5048 | 0.0348 | |||
| EOG / EOG Resources, Inc. | 0.16 | -25.88 | 0.02 | -30.77 | 0.3875 | -0.2651 | |||
| GOOGL / Alphabet Inc. | 0.09 | -2.33 | 0.02 | 7.14 | 0.3273 | -0.0163 | |||
| MTD / Mettler-Toledo International Inc. | 0.01 | 0.01 | 0.2770 | 0.2770 | |||||
| BRK.A / Berkshire Hathaway Inc. | 0.00 | 0.00 | 0.01 | -7.14 | 0.2740 | -0.0754 | |||
| CRM / Salesforce, Inc. | 0.04 | -8.10 | 0.01 | 0.00 | 0.2330 | -0.0575 | |||
| BALL / Ball Corporation | 0.19 | -67.90 | 0.01 | -67.74 | 0.2259 | -0.5346 | |||
| HD / The Home Depot, Inc. | 0.03 | -0.84 | 0.01 | 0.00 | 0.1982 | -0.0344 | |||
| PG / The Procter & Gamble Company | 0.00 | -100.00 | 0.01 | -11.11 | 0.1851 | -0.0444 | |||
| NFLX / Netflix, Inc. | 0.00 | -100.00 | 0.01 | 100.00 | 0.1256 | 0.0397 | |||
| AMD / Advanced Micro Devices, Inc. | 0.00 | -100.00 | 0.00 | 0.00 | 0.0923 | -0.0212 | |||
| NOW / ServiceNow, Inc. | 0.00 | -30.41 | 0.00 | 0.00 | 0.0845 | -0.0250 | |||
| UBER / Uber Technologies, Inc. | 0.04 | -27.41 | 0.00 | -25.00 | 0.0820 | -0.0207 | |||
| MU / Micron Technology, Inc. | 0.03 | -38.04 | 0.00 | 0.00 | 0.0734 | -0.0238 | |||
| SNPS / Synopsys, Inc. | 0.01 | -15.00 | 0.00 | 0.00 | 0.0728 | -0.0106 | |||
| CDNS / Cadence Design Systems, Inc. | 0.01 | -19.42 | 0.00 | 0.00 | 0.0721 | -0.0139 | |||
| ARM / Arm Holdings plc - Depositary Receipt (Common Stock) | 0.00 | -100.00 | 0.00 | 200.00 | 0.0675 | 0.0364 | |||
| BAC / Bank of America Corporation | 0.07 | 10.52 | 0.00 | 50.00 | 0.0656 | 0.0047 | |||
| AXP / American Express Company | 0.01 | -6.46 | 0.00 | 0.00 | 0.0521 | -0.0026 | |||
| AWK / American Water Works Company, Inc. | 0.02 | 10.67 | 0.00 | 0.00 | 0.0506 | -0.0059 | |||
| PINS / Pinterest, Inc. | 0.06 | 0.00 | 0.0449 | 0.0449 | |||||
| IVV / iShares Trust - iShares Core S&P 500 ETF | 0.00 | 0.00 | 0.00 | 0.00 | 0.0408 | -0.0022 | |||
| PLD / Prologis, Inc. | 0.02 | 39.75 | 0.00 | 0.00 | 0.0395 | 0.0045 | |||
| JCI / Johnson Controls International plc | 0.02 | -19.87 | 0.00 | 0.00 | 0.0391 | -0.0040 | |||
| VTEB / Vanguard Municipal Bond Funds - Vanguard Tax-Exempt Bond ETF | 0.00 | -100.00 | 0.00 | 0.00 | 0.0384 | -0.0068 | |||
| HLT / Hilton Worldwide Holdings Inc. | 0.01 | -19.93 | 0.00 | 0.00 | 0.0380 | -0.0092 | |||
| VRSK / Verisk Analytics, Inc. | 0.01 | 0.00 | 0.0325 | 0.0325 | |||||
| CARR / Carrier Global Corporation | 0.02 | 0.00 | 0.00 | 0.00 | 0.0303 | -0.0003 | |||
| CI / The Cigna Group | 0.00 | -7.01 | 0.00 | 0.00 | 0.0293 | -0.0072 | |||
| PWR / Quanta Services, Inc. | 0.00 | 8.57 | 0.00 | 0.0270 | 0.0076 | ||||
| TYL / Tyler Technologies, Inc. | 0.00 | 0.00 | 0.0247 | 0.0247 | |||||
| CVS / CVS Health Corporation | 0.02 | 0.00 | 0.00 | 0.00 | 0.0233 | -0.0033 | |||
| XYL / Xylem Inc. | 0.01 | 6.64 | 0.00 | 0.0226 | -0.0002 | ||||
| TTEK / Tetra Tech, Inc. | 0.03 | 49.05 | 0.00 | 0.0194 | 0.0071 | ||||
| JNJ / Johnson & Johnson | 0.00 | -100.00 | 0.00 | -100.00 | 0.0189 | -0.0084 | |||
| FSLR / First Solar, Inc. | 0.01 | 77.30 | 0.00 | 0.0186 | 0.0093 | ||||
| CBOE / Cboe Global Markets, Inc. | 0.00 | 0.00 | 0.0165 | 0.0165 | |||||
| SYK / Stryker Corporation | 0.00 | 0.00 | 0.00 | 0.0165 | -0.0016 | ||||
| CLH / Clean Harbors, Inc. | 0.00 | 10.20 | 0.00 | 0.0156 | 0.0016 | ||||
| VERX / Vertex, Inc. | 0.02 | 0.00 | 0.0147 | 0.0147 | |||||
| OC / Owens Corning | 0.00 | 37.39 | 0.00 | 0.0139 | 0.0017 | ||||
| CWEN / Clearway Energy, Inc. | 0.02 | 0.00 | 0.0130 | 0.0130 | |||||
| IBM / International Business Machines Corporation | 0.00 | 0.00 | 0.00 | 0.0128 | 0.0002 | ||||
| KO / The Coca-Cola Company | 0.01 | 0.00 | 0.00 | 0.0127 | -0.0023 | ||||
| AYI / Acuity Inc. | 0.00 | 0.00 | 0.0124 | 0.0124 | |||||
| WM / Waste Management, Inc. | 0.00 | 0.00 | 0.0124 | 0.0124 | |||||
| IJH / iShares Trust - iShares Core S&P Mid-Cap ETF | 0.00 | -100.00 | 0.00 | 0.0117 | -0.0011 | ||||
| XOM / Exxon Mobil Corporation | 0.01 | 0.00 | 0.00 | 0.0116 | -0.0033 | ||||
| QQQ / Invesco QQQ Trust, Series 1 | 0.00 | 9.84 | 0.00 | 0.0116 | 0.0011 | ||||
| BMI / Badger Meter, Inc. | 0.00 | 0.00 | 0.0115 | 0.0115 | |||||
| ORCL / Oracle Corporation | 0.00 | 0.00 | 0.00 | 0.0109 | 0.0028 | ||||
| NXT / Nextracker Inc. | 0.01 | 41.48 | 0.00 | 0.0108 | 0.0039 | ||||
| IJR / iShares Trust - iShares Core S&P Small-Cap ETF | 0.00 | 0.00 | 0.00 | 0.0105 | -0.0012 | ||||
| OLED / Universal Display Corporation | 0.00 | 0.00 | 0.0097 | 0.0097 | |||||
| ONON / On Holding AG | 0.00 | -100.00 | 0.00 | 0.0091 | 0.0012 | ||||
| TSLA / Tesla, Inc. | 0.00 | 0.00 | 0.00 | 0.0087 | 0.0004 | ||||
| ENPH / Enphase Energy, Inc. | 0.01 | 106.29 | 0.00 | 0.0079 | 0.0009 | ||||
| VTWO / Vanguard Scottsdale Funds - Vanguard Russell 2000 ETF | 0.00 | 0.00 | 0.00 | 0.0077 | -0.0006 | ||||
| ABT / Abbott Laboratories | 0.00 | 0.00 | 0.00 | 0.0071 | -0.0009 | ||||
| WMT / Walmart Inc. | 0.00 | 10.29 | 0.00 | 0.0056 | 0.0003 | ||||
| MRVL / Marvell Technology, Inc. | 0.00 | 0.00 | 0.0056 | 0.0056 | |||||
| SCHW / The Charles Schwab Corporation | 0.00 | 0.00 | 0.0050 | 0.0050 | |||||
| COTY / Coty Inc. | 0.05 | 0.00 | 0.00 | 0.0047 | -0.0018 | ||||
| PEP / PepsiCo, Inc. | 0.00 | -100.00 | 0.00 | 0.0046 | -0.0015 | ||||
| LAZ / Lazard, Inc. | 0.00 | 0.00 | 0.0045 | 0.0045 | |||||
| GS / The Goldman Sachs Group, Inc. | 0.00 | 0.00 | 0.0042 | 0.0042 | |||||
| KAI / Kadant Inc. | 0.00 | -100.00 | 0.00 | 0.0000 | -0.0177 | ||||
| WMS / Advanced Drainage Systems, Inc. | 0.00 | -100.00 | 0.00 | 0.0000 | |||||
| HES / Hess Corporation | 0.00 | -100.00 | 0.00 | 0.0000 | |||||
| J / Jacobs Solutions Inc. | 0.00 | -100.00 | 0.00 | 0.0000 | |||||
| CSCO / Cisco Systems, Inc. | 0.00 | -100.00 | 0.00 | 0.0000 | -0.0056 | ||||
| BABA / Alibaba Group Holding Limited - Depositary Receipt (Common Stock) | 0.00 | -100.00 | 0.00 | 0.0000 | -0.0071 | ||||
| SLB / Schlumberger Limited | 0.00 | -100.00 | 0.00 | 0.0000 | |||||
| ETN / Eaton Corporation plc | 0.00 | -100.00 | 0.00 | 0.0000 |