Mga Batayang Estadistika
| Nilai Portofolio | $ 905,408 |
| Posisi Saat Ini | 77 |
Kepemilikan Terbaru, Kinerja, AUM (dari 13F, 13D)
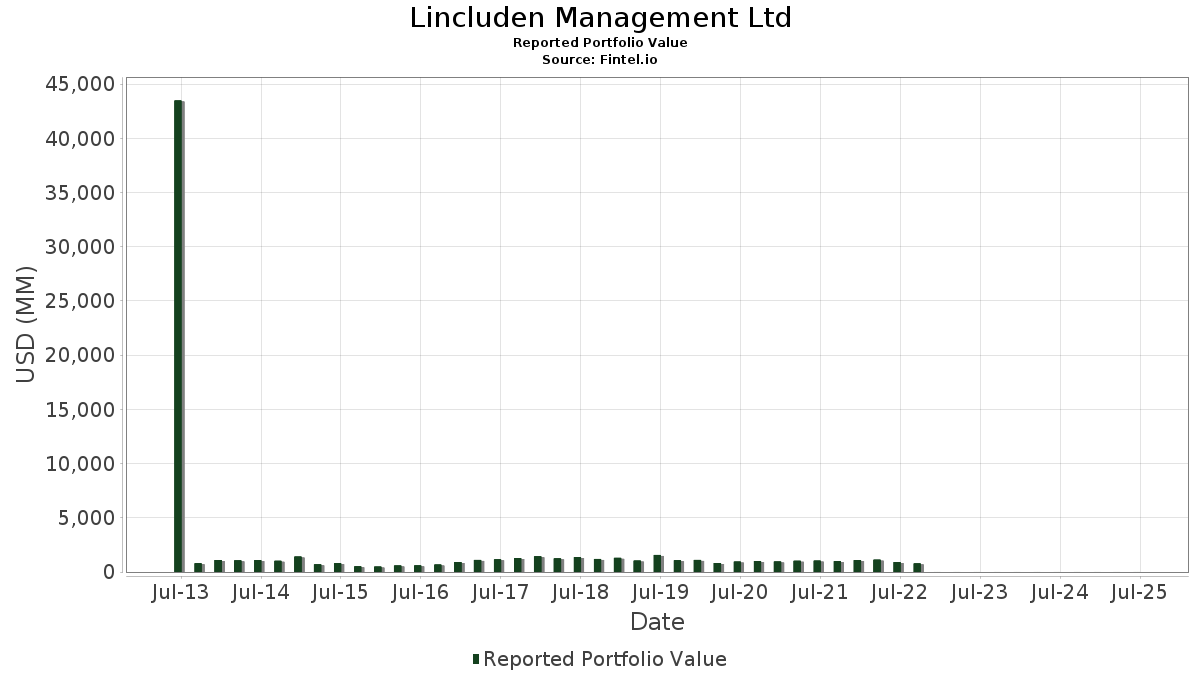
Lincluden Management Ltd telah mengungkapkan total kepemilikan 77 dalam pengajuan SEC terbaru mereka. Nilai portofolio terbaru dihitung sebesar $ 905,408 USD. Aset yang Dikelola (AUM) sebenarnya adalah nilai ini ditambah kas (yang tidak diungkapkan). Aset-aset utama Lincluden Management Ltd adalah The Toronto-Dominion Bank (US:TD) , Royal Bank of Canada (MX:RY N) , Canadian National Railway Company (CA:CNR) , TC Energy Corporation (BG:TRS) , and The Bank of Nova Scotia (US:BNS) . Posisi baru Lincluden Management Ltd meliputi: Nutrien Ltd. (US:NTR) , Thermo Fisher Scientific Inc. (US:TMO) , Jacobs Solutions Inc. (US:J) , Ulta Beauty, Inc. (US:ULTA) , and .
Peningkatan Tertinggi Kuartal Ini
Kami menggunakan perubahan dalam alokasi portofolio karena ini adalah metrik yang paling bermakna. Perubahan dapat disebabkan oleh perdagangan atau perubahan harga saham.
| Keamanan | Saham (MM) |
Nilai (Juta Dolar AS) |
Portfolio % | ΔPorsyento ng Portfolio |
|---|---|---|---|---|
| 0.59 | 0.03 | 3.8067 | 3.8067 | |
| 0.75 | 0.02 | 2.5952 | 2.1537 | |
| 0.46 | 0.03 | 3.3887 | 1.2262 | |
| 0.01 | 0.01 | 0.6103 | 0.6103 | |
| 0.04 | 0.00 | 0.5372 | 0.5372 | |
| 0.01 | 0.00 | 0.3819 | 0.3819 | |
| 0.02 | 0.00 | 0.3140 | 0.3140 | |
| 0.72 | 0.03 | 3.0760 | 0.2328 | |
| 0.43 | 0.03 | 3.3927 | 0.2312 | |
| 0.02 | 0.01 | 1.0326 | 0.1220 |
Penurunan Tertinggi Kuartal Ini
Kami menggunakan perubahan dalam alokasi portofolio karena ini adalah metrik yang paling bermakna. Perubahan dapat disebabkan oleh perdagangan atau perubahan harga saham.
| Keamanan | Saham (MM) |
Nilai (Juta Dolar AS) |
Portfolio % | ΔPorsyento ng Portfolio |
|---|---|---|---|---|
| 0.89 | 0.04 | 4.7816 | -1.2922 | |
| 1.86 | 0.04 | 4.5461 | -0.9861 | |
| 1.00 | 0.07 | 8.1255 | -0.8756 | |
| 0.50 | 0.07 | 7.2090 | -0.5671 | |
| 0.61 | 0.02 | 2.5032 | -0.5383 | |
| 0.03 | 0.00 | 0.2425 | -0.5051 | |
| 0.94 | 0.03 | 3.3106 | -0.4809 | |
| 0.86 | 0.03 | 3.5627 | -0.2965 | |
| 0.26 | 0.01 | 1.2212 | -0.2661 | |
| 0.42 | 0.04 | 4.7955 | -0.2517 |
Pengajuan 13F dan Dana
Formulir ini diajukan pada 2025-07-25 untuk periode pelaporan 2025-06-30. Klik ikon tautan untuk melihat riwayat transaksi selengkapnya.
Tingkatkan ke versi premium untuk membuka data premium dan ekspor ke Excel. ![]() .
.
| Keamanan | Ketik | Harga Saham Rata-rata | Saham (MM) |
ΔSaham (%) |
ΔSaham (%) |
Nilai ($MM) |
Portpolyo (%) |
ΔPortofolio (%) |
|
|---|---|---|---|---|---|---|---|---|---|
| TD / The Toronto-Dominion Bank | 1.00 | -15.32 | 0.07 | 4.29 | 8.1255 | -0.8756 | |||
| RY N / Royal Bank of Canada | 0.50 | -8.77 | 0.07 | 6.56 | 7.2090 | -0.5671 | |||
| CNR / Canadian National Railway Company | 0.42 | 2.17 | 0.04 | 10.26 | 4.7955 | -0.2517 | |||
| TRS / TC Energy Corporation | 0.89 | -12.32 | 0.04 | -8.51 | 4.7816 | -1.2922 | |||
| BNS / The Bank of Nova Scotia | 0.76 | -2.20 | 0.04 | 13.51 | 4.6670 | -0.0441 | |||
| BCE N / BCE Inc. | 1.86 | -2.08 | 0.04 | -4.65 | 4.5461 | -0.9861 | |||
| BKFOF / Brookfield Corporation - Preferred Stock | 0.59 | -5.64 | 0.04 | 12.50 | 4.0377 | -0.1282 | |||
| NTR / Nutrien Ltd. | 0.59 | 0.03 | 3.8067 | 3.8067 | |||||
| PPL / Pembina Pipeline Corporation | 0.86 | 13.23 | 0.03 | 6.67 | 3.5627 | -0.2965 | |||
| CM / Canadian Imperial Bank of Commerce | 0.43 | -2.08 | 0.03 | 25.00 | 3.3927 | 0.2312 | |||
| TU / TELUS Corporation | 1.91 | -1.55 | 0.03 | 11.11 | 3.3893 | -0.1506 | |||
| QSR / Restaurant Brands International Inc. | 0.46 | 81.31 | 0.03 | 76.47 | 3.3887 | 1.2262 | |||
| MFC / Manulife Financial Corporation | 0.94 | -2.03 | 0.03 | 0.00 | 3.3106 | -0.4809 | |||
| MGA / Magna International Inc. | 0.72 | 9.52 | 0.03 | 22.73 | 3.0760 | 0.2328 | |||
| CNQ / Canadian Natural Resources Limited | 0.75 | 562.75 | 0.02 | 666.67 | 2.5952 | 2.1537 | |||
| SU / Suncor Energy Inc. | 0.61 | -2.05 | 0.02 | -4.35 | 2.5032 | -0.5383 | |||
| BIP / Brookfield Infrastructure Partners L.P. - Limited Partnership | 0.58 | -2.28 | 0.02 | 11.76 | 2.1324 | -0.0987 | |||
| BEP / Brookfield Renewable Partners L.P. - Limited Partnership | 0.66 | -2.71 | 0.02 | 6.67 | 1.8666 | -0.0516 | |||
| CSCO / Cisco Systems, Inc. | 0.19 | -0.27 | 0.01 | 18.18 | 1.4735 | -0.0381 | |||
| ORCL / Oracle Corporation | 0.05 | -25.27 | 0.01 | 22.22 | 1.2667 | 0.0199 | |||
| VZ / Verizon Communications Inc. | 0.26 | -0.99 | 0.01 | 0.00 | 1.2212 | -0.2661 | |||
| PFE / Pfizer Inc. | 0.41 | -0.46 | 0.01 | 0.00 | 1.1072 | -0.2303 | |||
| MSFT / Microsoft Corporation | 0.02 | -1.56 | 0.01 | 28.57 | 1.0326 | 0.1220 | |||
| AMT / American Tower Corporation | 0.04 | -0.43 | 0.01 | 0.00 | 0.9862 | -0.1355 | |||
| GOOG.L / Alphabet Inc. | 0.05 | -0.58 | 0.01 | 14.29 | 0.9706 | -0.0148 | |||
| 1GIA / FirstService Corporation | 0.04 | 7.44 | 0.01 | 16.67 | 0.8371 | -0.0153 | |||
| FRT / Federal Realty Investment Trust | 0.08 | -0.47 | 0.01 | 0.00 | 0.8249 | -0.1569 | |||
| USB / U.S. Bancorp | 0.15 | -1.76 | 0.01 | 0.00 | 0.7311 | -0.0677 | |||
| BAC / Bank of America Corporation | 0.14 | -5.04 | 0.01 | 0.00 | 0.7281 | -0.0497 | |||
| CIGI / Colliers International Group Inc. | 0.04 | -25.54 | 0.01 | 0.00 | 0.6656 | -0.1280 | |||
| DEO / Diageo plc - Depositary Receipt (Common Stock) | 0.06 | -0.81 | 0.01 | -16.67 | 0.6462 | -0.1326 | |||
| GRP.U / Granite Real Estate Investment Trust | 0.11 | 10.63 | 0.01 | 25.00 | 0.6287 | 0.0286 | |||
| JPM / JPMorgan Chase & Co. | 0.02 | -21.42 | 0.01 | 0.00 | 0.6144 | -0.1466 | |||
| TMO / Thermo Fisher Scientific Inc. | 0.01 | 0.01 | 0.6103 | 0.6103 | |||||
| GIB / CGI Inc. | 0.04 | -2.87 | 0.01 | 25.00 | 0.5900 | 0.0357 | |||
| ING / ING Groep N.V. - Depositary Receipt (Common Stock) | 0.24 | -4.04 | 0.01 | 25.00 | 0.5750 | -0.0425 | |||
| WMT / Walmart Inc. | 0.05 | -0.60 | 0.01 | 25.00 | 0.5690 | -0.0221 | |||
| HD / The Home Depot, Inc. | 0.01 | -1.21 | 0.01 | 0.00 | 0.5622 | -0.0921 | |||
| J / Jacobs Solutions Inc. | 0.04 | 0.00 | 0.5372 | 0.5372 | |||||
| DIS / The Walt Disney Company | 0.04 | -14.15 | 0.00 | 0.00 | 0.5317 | -0.0353 | |||
| RMR / The RMR Group Inc. | 0.29 | 0.00 | 0.00 | 0.00 | 0.5237 | -0.0898 | |||
| COST / Costco Wholesale Corporation | 0.00 | -1.71 | 0.00 | 0.00 | 0.5221 | -0.0617 | |||
| MS / Morgan Stanley | 0.03 | -11.85 | 0.00 | 0.00 | 0.5039 | -0.0408 | |||
| UNH / UnitedHealth Group Incorporated | 0.01 | 73.09 | 0.00 | 0.00 | 0.4965 | -0.0575 | |||
| CNC / Centene Corporation | 0.08 | -1.67 | 0.00 | 0.00 | 0.4735 | -0.1460 | |||
| EOG / EOG Resources, Inc. | 0.03 | -1.73 | 0.00 | -25.00 | 0.4388 | -0.1119 | |||
| C / Citigroup Inc. | 0.04 | -1.61 | 0.00 | 0.00 | 0.4161 | 0.0104 | |||
| WELL / Welltower Inc. | 0.02 | -0.38 | 0.00 | 0.00 | 0.4016 | -0.0605 | |||
| ORANY / Orange S.A. - Depositary Receipt (Common Stock) | 0.24 | -16.17 | 0.00 | 0.00 | 0.3999 | -0.0691 | |||
| ULTA / Ulta Beauty, Inc. | 0.01 | 0.00 | 0.3819 | 0.3819 | |||||
| GLW / Corning Incorporated | 0.06 | -1.16 | 0.00 | 50.00 | 0.3740 | -0.0049 | |||
| GNTX / Gentex Corporation | 0.15 | -0.74 | 0.00 | 0.00 | 0.3573 | -0.0814 | |||
| SHEL / Shell plc - Depositary Receipt (Common Stock) | 0.04 | -1.64 | 0.00 | 0.00 | 0.3433 | -0.0745 | |||
| GIL / Gildan Activewear Inc. | 0.06 | -1.14 | 0.00 | 50.00 | 0.3425 | -0.0154 | |||
| TSCO / Tractor Supply Company | 0.06 | -1.13 | 0.00 | 0.00 | 0.3421 | -0.0734 | |||
| SANOFI SA / ADR (80108N105) | 0.06 | 0.00 | 0.0000 | ||||||
| CPT / Camden Property Trust | 0.03 | -0.47 | 0.00 | 0.00 | 0.3323 | -0.0846 | |||
| RCI.B / Rogers Communications Inc. | 0.10 | 26.80 | 0.00 | 0.00 | 0.3300 | 0.0603 | |||
| SUI / Sun Communities, Inc. | 0.02 | 0.00 | 0.3140 | 0.3140 | |||||
| TJX / The TJX Companies, Inc. | 0.02 | -7.84 | 0.00 | -33.33 | 0.3115 | -0.0720 | |||
| AVB / AvalonBay Communities, Inc. | 0.01 | -0.30 | 0.00 | 0.00 | 0.2794 | -0.0605 | |||
| EXR / Extra Space Storage Inc. | 0.02 | -0.43 | 0.00 | 0.00 | 0.2735 | -0.0447 | |||
| GSK / GSK plc - Depositary Receipt (Common Stock) | 0.06 | -6.21 | 0.00 | 0.00 | 0.2631 | -0.0210 | |||
| TRNO / Terreno Realty Corporation | 0.04 | 47.75 | 0.00 | 100.00 | 0.2555 | 0.0312 | |||
| KR / The Kroger Co. | 0.03 | -64.79 | 0.00 | -60.00 | 0.2425 | -0.5051 | |||
| BEPC / Brookfield Renewable Corporation | 0.06 | -5.08 | 0.00 | 100.00 | 0.2279 | -0.0076 | |||
| EQIX / Equinix, Inc. | 0.00 | -0.46 | 0.00 | 0.00 | 0.2271 | -0.0419 | |||
| VET / Vermilion Energy Inc. | 0.28 | -2.15 | 0.00 | 0.00 | 0.2243 | -0.0684 | |||
| JNJ / Johnson & Johnson | 0.01 | -2.01 | 0.00 | 0.00 | 0.2210 | -0.0607 | |||
| TTE / TotalEnergies SE - Depositary Receipt (Common Stock) | 0.03 | -1.62 | 0.00 | -50.00 | 0.2097 | -0.0487 | |||
| SPG / Simon Property Group, Inc. | 0.01 | -0.41 | 0.00 | 0.00 | 0.1868 | -0.0361 | |||
| SAP / SAP SE - Depositary Receipt (Common Stock) | 0.01 | -1.24 | 0.00 | 0.00 | 0.1715 | -0.0048 | |||
| BXP / Boston Properties, Inc. | 0.02 | -45.06 | 0.00 | -50.00 | 0.1583 | -0.1718 | |||
| COLD / Americold Realty Trust, Inc. | 0.08 | -44.12 | 0.00 | -50.00 | 0.1419 | -0.2349 | |||
| CVE / Cenovus Energy Inc. | 0.02 | 0.00 | 0.00 | 0.0357 | 0.0007 | ||||
| RW5 / Brookfield Asset Management Ltd. | 0.01 | 0.00 | 0.00 | 0.0352 | -0.0003 | ||||
| BNRE / Brookfield Reinsurance Ltd. | 0.00 | -22.86 | 0.00 | 0.0076 | -0.0020 |