Mga Batayang Estadistika
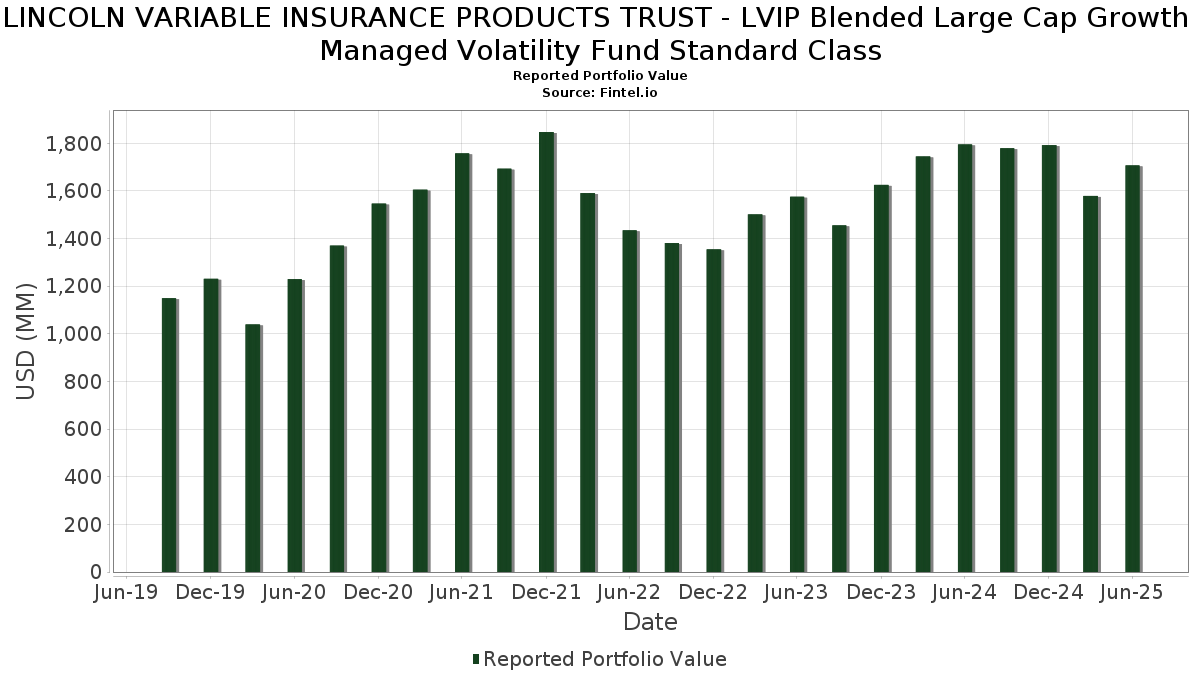
| Nilai Portofolio | $ 1,707,017,273 |
| Posisi Saat Ini | 137 |
Kepemilikan Terbaru, Kinerja, AUM (dari 13F, 13D)
LINCOLN VARIABLE INSURANCE PRODUCTS TRUST - LVIP Blended Large Cap Growth Managed Volatility Fund Standard Class telah mengungkapkan total kepemilikan 137 dalam pengajuan SEC terbaru mereka. Nilai portofolio terbaru dihitung sebesar $ 1,707,017,273 USD. Aset yang Dikelola (AUM) sebenarnya adalah nilai ini ditambah kas (yang tidak diungkapkan). Aset-aset utama LINCOLN VARIABLE INSURANCE PRODUCTS TRUST - LVIP Blended Large Cap Growth Managed Volatility Fund Standard Class adalah NVIDIA Corporation (US:NVDA) , Microsoft Corporation (US:MSFT) , Amazon.com, Inc. (US:AMZN) , Meta Platforms, Inc. (US:META) , and Apple Inc. (US:AAPL) . Posisi baru LINCOLN VARIABLE INSURANCE PRODUCTS TRUST - LVIP Blended Large Cap Growth Managed Volatility Fund Standard Class meliputi: Stryker Corporation (US:SYK) , Linde plc (US:LIN) , Coupang, Inc. (US:CPNG) , FTAI Aviation Ltd. (US:FTAI) , and Exact Sciences Corporation (US:EXAS) .
Peningkatan Tertinggi Kuartal Ini
Kami menggunakan perubahan dalam alokasi portofolio karena ini adalah metrik yang paling bermakna. Perubahan dapat disebabkan oleh perdagangan atau perubahan harga saham.
| Keamanan | Saham (MM) |
Nilai (Juta Dolar AS) |
Portfolio % | ΔPorsyento ng Portfolio |
|---|---|---|---|---|
| 1.25 | 197.33 | 11.4464 | 3.2525 | |
| 0.35 | 171.95 | 9.9739 | 1.3065 | |
| 0.05 | 66.91 | 3.8812 | 1.0449 | |
| 0.27 | 73.91 | 4.2874 | 1.0165 | |
| 0.06 | 18.08 | 1.0487 | 0.5709 | |
| 0.11 | 10.04 | 0.5826 | 0.5675 | |
| 0.05 | 9.87 | 0.5726 | 0.5335 | |
| 0.02 | 8.97 | 0.5202 | 0.5202 | |
| 0.17 | 59.87 | 3.4730 | 0.4436 | |
| 0.03 | 7.54 | 0.4373 | 0.4373 |
Penurunan Tertinggi Kuartal Ini
Kami menggunakan perubahan dalam alokasi portofolio karena ini adalah metrik yang paling bermakna. Perubahan dapat disebabkan oleh perdagangan atau perubahan harga saham.
| Keamanan | Saham (MM) |
Nilai (Juta Dolar AS) |
Portfolio % | ΔPorsyento ng Portfolio |
|---|---|---|---|---|
| 73.14 | 73.14 | 4.2424 | -2.1418 | |
| 0.50 | 109.49 | 6.3513 | -1.2193 | |
| 0.41 | 83.22 | 4.8274 | -1.1257 | |
| 0.00 | 0.46 | 0.0267 | -0.9954 | |
| 0.04 | 7.11 | 0.4126 | -0.7890 | |
| 0.05 | 7.95 | 0.4609 | -0.4813 | |
| 0.03 | 8.02 | 0.4652 | -0.4684 | |
| 0.04 | 13.08 | 0.7590 | -0.4513 | |
| 0.04 | 29.75 | 1.7256 | -0.4050 | |
| 0.00 | 0.86 | 0.0497 | -0.4007 |
Pengajuan 13F dan Dana
Formulir ini diajukan pada 2025-08-06 untuk periode pelaporan 2025-06-30. Klik ikon tautan untuk melihat riwayat transaksi selengkapnya.
Tingkatkan ke versi premium untuk membuka data premium dan ekspor ke Excel. ![]() .
.
| Keamanan | Ketik | Harga Saham Rata-rata | Saham (MM) |
ΔSaham (%) |
ΔSaham (%) |
Nilai ($MM) |
Portpolyo (%) |
ΔPortofolio (%) |
|
|---|---|---|---|---|---|---|---|---|---|
| NVDA / NVIDIA Corporation | 1.25 | 4.29 | 197.33 | 52.03 | 11.4464 | 3.2525 | |||
| MSFT / Microsoft Corporation | 0.35 | -5.49 | 171.95 | 25.24 | 9.9739 | 1.3065 | |||
| AMZN / Amazon.com, Inc. | 0.50 | -20.82 | 109.49 | -8.70 | 6.3513 | -1.2193 | |||
| META / Meta Platforms, Inc. | 0.12 | -14.52 | 87.78 | 9.46 | 5.0916 | 0.0292 | |||
| AAPL / Apple Inc. | 0.41 | -4.45 | 83.22 | -11.75 | 4.8274 | -1.1257 | |||
| GOOG / Alphabet Inc. | 0.45 | -3.27 | 79.38 | 9.84 | 4.6045 | 0.0421 | |||
| AVGO / Broadcom Inc. | 0.27 | -13.35 | 73.91 | 42.66 | 4.2874 | 1.0165 | |||
| GVMXX / State Street Institutional Investment Trust - State Street Institutional US Govt Money Market Fnd Premier Cls | 73.14 | -27.68 | 73.14 | -27.68 | 4.2424 | -2.1418 | |||
| NFLX / Netflix, Inc. | 0.05 | 3.71 | 66.91 | 48.92 | 3.8812 | 1.0449 | |||
| V / Visa Inc. | 0.17 | 23.16 | 59.87 | 24.77 | 3.4730 | 0.4436 | |||
| COST / Costco Wholesale Corporation | 0.04 | 13.54 | 35.40 | 18.84 | 2.0535 | 0.1730 | |||
| LLY / Eli Lilly and Company | 0.04 | -6.61 | 29.75 | -11.85 | 1.7256 | -0.4050 | |||
| TSLA / Tesla, Inc. | 0.09 | 0.93 | 28.53 | 23.72 | 1.6550 | 0.1991 | |||
| ISRG / Intuitive Surgical, Inc. | 0.04 | -25.34 | 20.42 | -18.08 | 1.1847 | -0.3893 | |||
| VEEV / Veeva Systems Inc. | 0.06 | 92.14 | 18.08 | 138.89 | 1.0487 | 0.5709 | |||
| ANET / Arista Networks Inc | 0.16 | -27.11 | 16.42 | -3.75 | 0.9527 | -0.1245 | |||
| MNST / Monster Beverage Corporation | 0.24 | -26.10 | 15.22 | -20.90 | 0.8828 | -0.3319 | |||
| TXN / Texas Instruments Incorporated | 0.07 | 11.52 | 14.86 | 28.84 | 0.8620 | 0.1339 | |||
| NOW / ServiceNow, Inc. | 0.01 | -40.10 | 13.70 | -22.64 | 0.7949 | -0.3234 | |||
| VRTX / Vertex Pharmaceuticals Incorporated | 0.03 | 68.95 | 13.68 | 55.15 | 0.7938 | 0.2369 | |||
| AMAT / Applied Materials, Inc. | 0.07 | 52.64 | 13.35 | 92.56 | 0.7745 | 0.3368 | |||
| HD / The Home Depot, Inc. | 0.04 | -31.78 | 13.08 | -31.75 | 0.7590 | -0.4513 | |||
| CMG / Chipotle Mexican Grill, Inc. | 0.23 | -6.53 | 12.75 | 4.53 | 0.7395 | -0.0305 | |||
| TSM / Taiwan Semiconductor Manufacturing Company Limited - Depositary Receipt (Common Stock) | 0.05 | 17.86 | 11.88 | 60.82 | 0.6890 | 0.2227 | |||
| CBOE / Cboe Global Markets, Inc. | 0.05 | -3.29 | 11.21 | -0.34 | 0.6502 | -0.0598 | |||
| VRSK / Verisk Analytics, Inc. | 0.03 | -4.05 | 10.45 | 0.42 | 0.6062 | -0.0507 | |||
| UBER / Uber Technologies, Inc. | 0.11 | 3,170.08 | 10.04 | 4,102.09 | 0.5826 | 0.5675 | |||
| PANW / Palo Alto Networks, Inc. | 0.05 | 1,875.23 | 9.87 | 1,625.52 | 0.5726 | 0.5335 | |||
| SYK / Stryker Corporation | 0.02 | 8.97 | 0.5202 | 0.5202 | |||||
| SHW / The Sherwin-Williams Company | 0.03 | -4.19 | 8.76 | -5.79 | 0.5081 | -0.0789 | |||
| WAT / Waters Corporation | 0.02 | 39.68 | 8.65 | 32.28 | 0.5015 | 0.0889 | |||
| OTIS / Otis Worldwide Corporation | 0.09 | -4.73 | 8.49 | -8.59 | 0.4924 | -0.0938 | |||
| PGR / The Progressive Corporation | 0.03 | 292.55 | 8.35 | 270.16 | 0.4842 | 0.3419 | |||
| CPRT / Copart, Inc. | 0.17 | -23.80 | 8.21 | -33.93 | 0.4760 | -0.3081 | |||
| LULU / lululemon athletica inc. | 0.03 | -35.39 | 8.02 | -45.77 | 0.4652 | -0.4684 | |||
| ZTS / Zoetis Inc. | 0.05 | -43.79 | 7.95 | -46.76 | 0.4609 | -0.4813 | |||
| ORCL / Oracle Corporation | 0.03 | 7.54 | 0.4373 | 0.4373 | |||||
| ABBV / AbbVie Inc. | 0.04 | 1,398.63 | 7.51 | 1,522.68 | 0.4358 | 0.4101 | |||
| NTRA / Natera, Inc. | 0.04 | 459.11 | 7.45 | 567.89 | 0.4320 | 0.3616 | |||
| INTU / Intuit Inc. | 0.01 | 7.36 | 0.4268 | 0.4268 | |||||
| DASH / DoorDash, Inc. | 0.03 | 541.73 | 7.31 | 765.88 | 0.4239 | 0.3706 | |||
| PG / The Procter & Gamble Company | 0.05 | -16.90 | 7.22 | -21.02 | 0.4188 | -0.0899 | |||
| HWM / Howmet Aerospace Inc. | 0.04 | -57.61 | 7.17 | 100.25 | 0.4161 | 0.1547 | |||
| QCOM / QUALCOMM Incorporated | 0.04 | -63.95 | 7.11 | -62.63 | 0.4126 | -0.7890 | |||
| WDAY / Workday, Inc. | 0.03 | 7.08 | 0.4107 | 0.4107 | |||||
| MA / Mastercard Incorporated | 0.01 | 20.49 | 7.01 | 23.53 | 0.4066 | 0.0484 | |||
| MCK / McKesson Corporation | 0.01 | 7.00 | 0.4062 | 0.4062 | |||||
| BR / Broadridge Financial Solutions, Inc. | 0.03 | -8.25 | 6.89 | -8.04 | 0.3995 | -0.0733 | |||
| SCCO / Southern Copper Corporation | 0.07 | 6.80 | 0.3942 | 0.3942 | |||||
| AMP / Ameriprise Financial, Inc. | 0.01 | -13.23 | 6.74 | -4.34 | 0.3909 | -0.0538 | |||
| RDDT / Reddit, Inc. | 0.04 | 7.56 | 6.49 | 54.40 | 0.3766 | 0.1111 | |||
| AXON / Axon Enterprise, Inc. | 0.01 | -13.85 | 6.47 | 35.60 | 0.3752 | 0.0741 | |||
| LIN / Linde plc | 0.01 | 6.39 | 0.3709 | 0.3709 | |||||
| APP / AppLovin Corporation | 0.02 | 11.72 | 6.38 | 47.62 | 0.3699 | 0.0972 | |||
| MORN / Morningstar, Inc. | 0.02 | 95.14 | 6.35 | 91.99 | 0.3683 | 0.1826 | |||
| IT / Gartner, Inc. | 0.02 | 251.49 | 6.34 | 238.59 | 0.3675 | 0.2493 | |||
| DDOG / Datadog, Inc. | 0.05 | -28.08 | 6.33 | -2.63 | 0.3673 | -0.0432 | |||
| CDNS / Cadence Design Systems, Inc. | 0.02 | -5.49 | 6.33 | 14.50 | 0.3669 | 0.0182 | |||
| CH1134540470 / On Holding AG | 0.12 | 12.03 | 6.19 | 32.75 | 0.3593 | 0.0648 | |||
| PLTR / Palantir Technologies Inc. | 0.05 | 1,565.66 | 6.15 | 2,596.49 | 0.3567 | 0.3422 | |||
| UNH / UnitedHealth Group Incorporated | 0.02 | -3.57 | 6.09 | -42.56 | 0.3532 | -0.3160 | |||
| RACE / Ferrari N.V. | 0.01 | -5.18 | 5.96 | 8.75 | 0.3459 | -0.0003 | |||
| MDB / MongoDB, Inc. | 0.03 | 575.63 | 5.43 | 509.43 | 0.3150 | 0.2654 | |||
| MTD / Mettler-Toledo International Inc. | 0.00 | -3.83 | 5.28 | -4.35 | 0.3061 | -0.0421 | |||
| FIX / Comfort Systems USA, Inc. | 0.01 | 0.00 | 4.95 | 66.34 | 0.2873 | 0.0993 | |||
| TSCO / Tractor Supply Company | 0.09 | -52.03 | 4.95 | -54.05 | 0.2869 | -0.3927 | |||
| EXPE / Expedia Group, Inc. | 0.03 | 86.22 | 4.89 | 86.92 | 0.2835 | 0.1184 | |||
| ABNB / Airbnb, Inc. | 0.04 | -23.20 | 4.80 | -14.91 | 0.2785 | -0.0777 | |||
| MANH / Manhattan Associates, Inc. | 0.02 | -47.34 | 4.67 | -39.91 | 0.2711 | -0.2199 | |||
| TOST / Toast, Inc. | 0.10 | 4.50 | 0.2610 | 0.2610 | |||||
| PODD / Insulet Corporation | 0.01 | 175.22 | 4.32 | 231.44 | 0.2507 | 0.1695 | |||
| CELH / Celsius Holdings, Inc. | 0.09 | -0.84 | 4.31 | 29.11 | 0.2501 | 0.0393 | |||
| SNPS / Synopsys, Inc. | 0.01 | -3.51 | 4.29 | 15.38 | 0.2489 | 0.0141 | |||
| ALAB / Astera Labs, Inc. | 0.05 | -24.44 | 4.24 | 14.51 | 0.2459 | 0.0122 | |||
| MSI / Motorola Solutions, Inc. | 0.01 | -41.21 | 4.24 | -43.54 | 0.2457 | -0.2279 | |||
| CPNG / Coupang, Inc. | 0.14 | 4.18 | 0.2425 | 0.2425 | |||||
| TXRH / Texas Roadhouse, Inc. | 0.02 | 4.03 | 0.2338 | 0.2338 | |||||
| RNG / RingCentral, Inc. | 0.14 | 308.68 | 3.96 | 266.30 | 0.2295 | 0.1688 | |||
| SHOP / Shopify Inc. | 0.03 | -5.18 | 3.91 | 14.65 | 0.2270 | 0.0115 | |||
| URI / United Rentals, Inc. | 0.01 | -5.16 | 3.90 | 14.02 | 0.2264 | 0.0103 | |||
| APH / Amphenol Corporation | 0.04 | -29.13 | 3.85 | 7.42 | 0.2233 | 0.0220 | |||
| EQH / Equitable Holdings, Inc. | 0.06 | -20.70 | 3.63 | -14.60 | 0.2104 | -0.0577 | |||
| PEN / Penumbra, Inc. | 0.01 | -4.07 | 3.31 | 3.66 | 0.1920 | 0.0143 | |||
| SAIA / Saia, Inc. | 0.01 | -30.53 | 3.06 | -45.54 | 0.1775 | -0.1771 | |||
| FTAI / FTAI Aviation Ltd. | 0.03 | 2.94 | 0.1708 | 0.1708 | |||||
| RBLX / Roblox Corporation | 0.03 | -60.34 | 2.89 | -28.43 | 0.1675 | -0.0872 | |||
| MSCI / MSCI Inc. | 0.00 | -53.41 | 2.84 | -52.06 | 0.1650 | -0.1748 | |||
| BFAM / Bright Horizons Family Solutions Inc. | 0.02 | 640.12 | 2.79 | 620.93 | 0.1619 | 0.1374 | |||
| CTAS / Cintas Corporation | 0.01 | -70.93 | 2.71 | -68.48 | 0.1571 | -0.3852 | |||
| EXAS / Exact Sciences Corporation | 0.05 | 2.61 | 0.1516 | 0.1516 | |||||
| TREX / Trex Company, Inc. | 0.05 | -5.66 | 2.57 | -11.71 | 0.1491 | -0.0347 | |||
| IRM / Iron Mountain Incorporated | 0.02 | 2.49 | 0.1447 | 0.1447 | |||||
| SFM / Sprouts Farmers Market, Inc. | 0.01 | -25.51 | 2.44 | 379.37 | 0.1416 | 0.1010 | |||
| ASML / ASML Holding N.V. - Depositary Receipt (Common Stock) | 0.00 | -42.73 | 2.39 | -30.75 | 0.1386 | -0.0792 | |||
| DRI / Darden Restaurants, Inc. | 0.01 | -38.26 | 2.31 | -19.49 | 0.1337 | -0.0302 | |||
| FICO / Fair Isaac Corporation | 0.00 | -67.99 | 2.23 | -68.27 | 0.1293 | -0.3141 | |||
| GMAB / Genmab A/S - Depositary Receipt (Common Stock) | 0.11 | -0.82 | 2.21 | 4.68 | 0.1284 | -0.0051 | |||
| BKNG / Booking Holdings Inc. | 0.00 | -78.05 | 2.21 | -72.43 | 0.1279 | -0.3769 | |||
| TWLO / Twilio Inc. | 0.02 | 2.17 | 0.1258 | 0.1258 | |||||
| AFRM / Affirm Holdings, Inc. | 0.03 | 71.37 | 2.08 | 162.50 | 0.1206 | 0.0705 | |||
| EME / EMCOR Group, Inc. | 0.00 | 1.88 | 0.1091 | 0.1091 | |||||
| DOCU / DocuSign, Inc. | 0.02 | -27.56 | 1.74 | -30.67 | 0.1007 | -0.0574 | |||
| IOT / Samsara Inc. | 0.04 | 1.72 | 0.0998 | 0.0998 | |||||
| CVNA / Carvana Co. | 0.01 | 76.47 | 1.72 | 184.44 | 0.0997 | 0.0615 | |||
| ODFL / Old Dominion Freight Line, Inc. | 0.01 | -74.05 | 1.65 | -78.80 | 0.0956 | -0.3410 | |||
| SYY / Sysco Corporation | 0.02 | 149.90 | 1.58 | 152.47 | 0.0918 | 0.0522 | |||
| BIRK / Birkenstock Holding plc | 0.03 | 1.52 | 0.0884 | 0.0884 | |||||
| RCL / Royal Caribbean Cruises Ltd. | 0.00 | 1.51 | 0.0875 | 0.0875 | |||||
| SGI / Somnigroup International Inc. | 0.02 | -85.41 | 1.38 | -74.67 | 0.0801 | -0.2294 | |||
| NET / Cloudflare, Inc. | 0.01 | -47.24 | 1.37 | -8.26 | 0.0792 | -0.0148 | |||
| ROKU / Roku, Inc. | 0.02 | 39.04 | 1.33 | 73.44 | 0.0773 | 0.0288 | |||
| TDY / Teledyne Technologies Incorporated | 0.00 | 74.97 | 1.32 | 118.05 | 0.0764 | 0.0382 | |||
| WELL / Welltower Inc. | 0.01 | 1.22 | 0.0707 | 0.0707 | |||||
| HEI / HEICO Corporation | 0.00 | -40.41 | 1.09 | -26.89 | 0.0630 | -0.0307 | |||
| LYFT / Lyft, Inc. | 0.07 | -66.66 | 1.03 | -59.29 | 0.0599 | -0.0812 | |||
| DUOL / Duolingo, Inc. | 0.00 | 0.92 | 0.0535 | 0.0535 | |||||
| GDDY / GoDaddy Inc. | 0.00 | -87.99 | 0.86 | -88.00 | 0.0497 | -0.4007 | |||
| TDC / Teradata Corporation | 0.04 | 0.81 | 0.0473 | 0.0473 | |||||
| NTNX / Nutanix, Inc. | 0.01 | 156.63 | 0.78 | 221.81 | 0.0454 | 0.0318 | |||
| MTSI / MACOM Technology Solutions Holdings, Inc. | 0.00 | 0.68 | 0.0395 | 0.0395 | |||||
| COIN / Coinbase Global, Inc. | 0.00 | -39.29 | 0.60 | 23.55 | 0.0347 | 0.0041 | |||
| SNV / Synovus Financial Corp. | 0.01 | 0.50 | 0.0290 | 0.0290 | |||||
| LAMR / Lamar Advertising Company | 0.00 | -93.30 | 0.49 | -91.81 | 0.0282 | -0.3475 | |||
| GOOGL / Alphabet Inc. | 0.00 | -97.51 | 0.46 | -97.16 | 0.0267 | -0.9954 | |||
| LHV / ExlService Holdings, Inc. | 0.01 | 0.44 | 0.0254 | 0.0254 | |||||
| RARE / Ultragenyx Pharmaceutical Inc. | 0.01 | 0.40 | 0.0233 | 0.0233 | |||||
| TTD / The Trade Desk, Inc. | 0.01 | 0.40 | 0.0230 | 0.0230 | |||||
| ALK / Alaska Air Group, Inc. | 0.01 | -83.24 | 0.33 | -83.15 | 0.0191 | -0.1045 | |||
| PSA / Public Storage | 0.00 | 0.31 | 0.0178 | 0.0178 | |||||
| ENPH / Enphase Energy, Inc. | 0.00 | 0.13 | 0.0075 | 0.0075 | |||||
| S+P500 EMINI FUT SEP25 / DE (000000000) | 0.09 | 0.0052 | 0.0052 | ||||||
| S+P500 EMINI FUT SEP25 / DE (000000000) | 0.09 | 0.0052 | 0.0052 | ||||||
| US003CVR0169 / CONTRA ABIOMED INC | 0.01 | 0.00 | 0.01 | 0.00 | 0.0007 | -0.0001 | |||
| BRKR / Bruker Corporation | 0.00 | -100.00 | 0.00 | -100.00 | -0.0736 | ||||
| US21871X1090 / Corebridge Financial, Inc. | 0.00 | -100.00 | 0.00 | -100.00 | -0.0856 | ||||
| MS / Morgan Stanley | 0.00 | -100.00 | 0.00 | -100.00 | -0.3765 | ||||
| TRGP / Targa Resources Corp. | 0.00 | -100.00 | 0.00 | -100.00 | -0.0887 | ||||
| MEDP / Medpace Holdings, Inc. | 0.00 | -100.00 | 0.00 | -100.00 | -0.0065 | ||||
| RH / RH | 0.00 | -100.00 | 0.00 | -100.00 | -0.0533 | ||||
| EEFT / Euronet Worldwide, Inc. | 0.00 | -100.00 | 0.00 | -100.00 | -0.0614 | ||||
| S+P MID 400 EMINI SEP25 / DE (000000000) | -0.03 | -0.0017 | -0.0017 | ||||||
| S+P MID 400 EMINI SEP25 / DE (000000000) | -0.03 | -0.0017 | -0.0017 | ||||||
| S+P500 EMINI FUT SEP25 / DE (000000000) | -1.30 | -0.0754 | -0.0754 | ||||||
| S+P500 EMINI FUT SEP25 / DE (000000000) | -1.30 | -0.0754 | -0.0754 |