Mga Batayang Estadistika
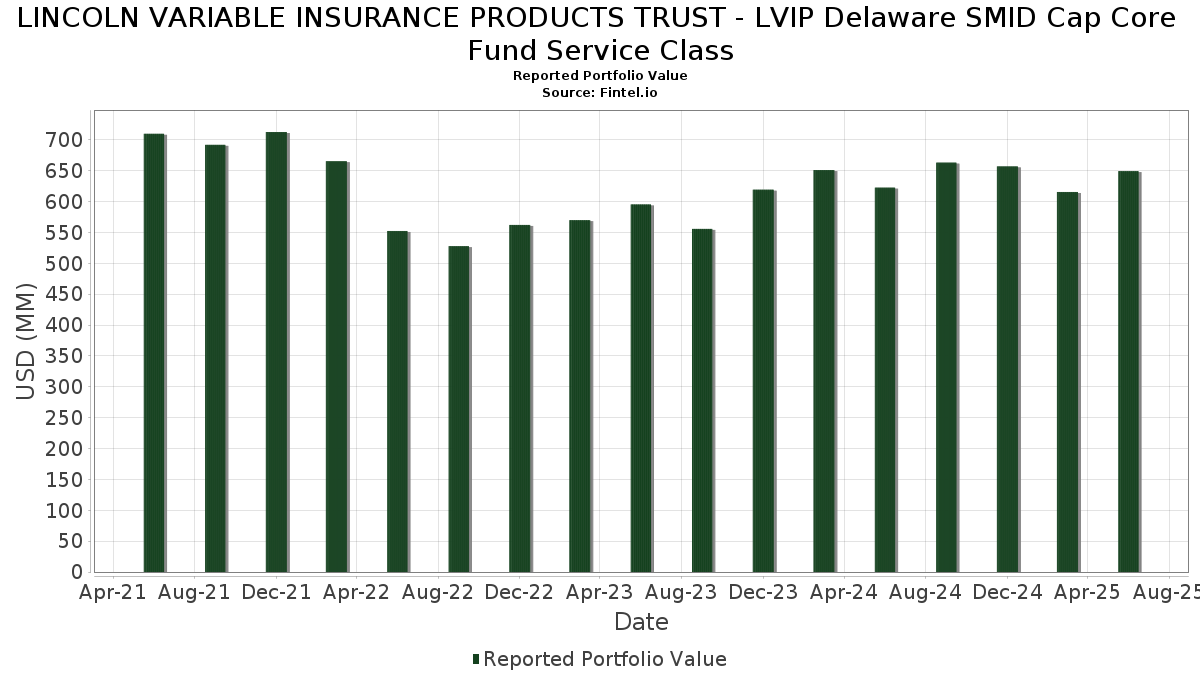
| Nilai Portofolio | $ 649,350,829 |
| Posisi Saat Ini | 122 |
Kepemilikan Terbaru, Kinerja, AUM (dari 13F, 13D)
LINCOLN VARIABLE INSURANCE PRODUCTS TRUST - LVIP Delaware SMID Cap Core Fund Service Class telah mengungkapkan total kepemilikan 122 dalam pengajuan SEC terbaru mereka. Nilai portofolio terbaru dihitung sebesar $ 649,350,829 USD. Aset yang Dikelola (AUM) sebenarnya adalah nilai ini ditambah kas (yang tidak diungkapkan). Aset-aset utama LINCOLN VARIABLE INSURANCE PRODUCTS TRUST - LVIP Delaware SMID Cap Core Fund Service Class adalah State Street Institutional Investment Trust - State Street Institutional US Govt Money Market Fnd Premier Cls (US:GVMXX) , East West Bancorp, Inc. (US:EWBC) , Casey's General Stores, Inc. (US:CASY) , AXIS Capital Holdings Limited (US:AXS) , and Guidewire Software, Inc. (US:GWRE) . Posisi baru LINCOLN VARIABLE INSURANCE PRODUCTS TRUST - LVIP Delaware SMID Cap Core Fund Service Class meliputi: Glaukos Corporation (US:GKOS) , Synovus Financial Corp. (US:SNV) , Astera Labs, Inc. (US:ALAB) , Tecnoglass Inc. (US:TGLS) , and Life Time Group Holdings, Inc. (US:LTH) .
Peningkatan Tertinggi Kuartal Ini
Kami menggunakan perubahan dalam alokasi portofolio karena ini adalah metrik yang paling bermakna. Perubahan dapat disebabkan oleh perdagangan atau perubahan harga saham.
| Keamanan | Saham (MM) |
Nilai (Juta Dolar AS) |
Portfolio % | ΔPorsyento ng Portfolio |
|---|---|---|---|---|
| 0.04 | 4.01 | 0.6176 | 0.6176 | |
| 0.06 | 3.25 | 0.5010 | 0.5010 | |
| 0.04 | 3.25 | 0.4998 | 0.4998 | |
| 0.04 | 2.99 | 0.4612 | 0.4612 | |
| 0.09 | 2.84 | 0.4376 | 0.4376 | |
| 0.01 | 2.59 | 0.3984 | 0.3984 | |
| 0.01 | 2.39 | 0.3686 | 0.3686 | |
| 0.04 | 4.86 | 0.7478 | 0.3518 | |
| 0.06 | 8.26 | 1.2716 | 0.3509 | |
| 0.10 | 8.49 | 1.3072 | 0.3237 |
Penurunan Tertinggi Kuartal Ini
Kami menggunakan perubahan dalam alokasi portofolio karena ini adalah metrik yang paling bermakna. Perubahan dapat disebabkan oleh perdagangan atau perubahan harga saham.
| Keamanan | Saham (MM) |
Nilai (Juta Dolar AS) |
Portfolio % | ΔPorsyento ng Portfolio |
|---|---|---|---|---|
| 0.00 | 0.00 | -1.7202 | ||
| 0.07 | 8.69 | 1.3376 | -1.2473 | |
| 0.01 | 3.30 | 0.5086 | -0.5945 | |
| 0.50 | 5.79 | 0.8918 | -0.3792 | |
| 0.09 | 4.77 | 0.7343 | -0.3657 | |
| 0.00 | 0.00 | -0.3327 | ||
| 0.33 | 3.44 | 0.5298 | -0.3000 | |
| 0.03 | 5.43 | 0.8364 | -0.2757 | |
| 0.00 | 0.00 | -0.2683 | ||
| 0.19 | 8.34 | 1.2843 | -0.2464 |
Pengajuan 13F dan Dana
Formulir ini diajukan pada 2025-08-06 untuk periode pelaporan 2025-06-30. Klik ikon tautan untuk melihat riwayat transaksi selengkapnya.
Tingkatkan ke versi premium untuk membuka data premium dan ekspor ke Excel. ![]() .
.
| Keamanan | Ketik | Harga Saham Rata-rata | Saham (MM) |
ΔSaham (%) |
ΔSaham (%) |
Nilai ($MM) |
Portpolyo (%) |
ΔPortofolio (%) |
|
|---|---|---|---|---|---|---|---|---|---|
| GVMXX / State Street Institutional Investment Trust - State Street Institutional US Govt Money Market Fnd Premier Cls | 15.96 | 12.90 | 15.96 | 12.89 | 2.4574 | 0.1612 | |||
| EWBC / East West Bancorp, Inc. | 0.13 | 2.07 | 13.25 | 14.82 | 2.0413 | 0.1659 | |||
| CASY / Casey's General Stores, Inc. | 0.02 | 2.06 | 12.66 | 19.99 | 1.9502 | 0.2356 | |||
| AXS / AXIS Capital Holdings Limited | 0.11 | 2.06 | 11.79 | 5.71 | 1.8153 | 0.0037 | |||
| GWRE / Guidewire Software, Inc. | 0.05 | 2.07 | 11.47 | 28.27 | 1.7666 | 0.3136 | |||
| WBS / Webster Financial Corporation | 0.20 | 2.07 | 10.85 | 8.10 | 1.6713 | 0.0404 | |||
| RS / Reliance, Inc. | 0.03 | 2.07 | 9.54 | 10.96 | 1.4686 | 0.0723 | |||
| DKS / DICK'S Sporting Goods, Inc. | 0.05 | 2.07 | 9.46 | 0.17 | 1.4568 | -0.0774 | |||
| PNFP / Pinnacle Financial Partners, Inc. | 0.08 | 2.07 | 9.36 | 6.28 | 1.4418 | 0.0106 | |||
| RGA / Reinsurance Group of America, Incorporated | 0.04 | 2.07 | 8.83 | 2.82 | 1.3603 | -0.0353 | |||
| KMPR / Kemper Corporation | 0.14 | 2.07 | 8.83 | -1.46 | 1.3602 | -0.0960 | |||
| SMTC / Semtech Corporation | 0.19 | 2.07 | 8.72 | 33.93 | 1.3429 | 0.2852 | |||
| EXE / Expand Energy Corporation | 0.07 | -48.04 | 8.69 | -45.41 | 1.3376 | -1.2473 | |||
| BJ / BJ's Wholesale Club Holdings, Inc. | 0.08 | 2.07 | 8.64 | -3.54 | 1.3311 | -0.1247 | |||
| INSM / Insmed Incorporated | 0.08 | -12.49 | 8.50 | 15.45 | 1.3087 | 0.1128 | |||
| COHR / Coherent Corp. | 0.10 | 2.06 | 8.49 | 40.23 | 1.3072 | 0.3237 | |||
| EXLS / ExlService Holdings, Inc. | 0.19 | -4.58 | 8.34 | -11.49 | 1.2843 | -0.2464 | |||
| SSB / SouthState Corporation | 0.09 | 2.07 | 8.32 | 1.19 | 1.2818 | -0.0544 | |||
| MTSI / MACOM Technology Solutions Holdings, Inc. | 0.06 | 2.07 | 8.26 | 45.69 | 1.2716 | 0.3509 | |||
| PR / Permian Resources Corporation | 0.60 | 0.00 | 8.20 | -1.66 | 1.2624 | -0.0918 | |||
| KEX / Kirby Corporation | 0.07 | 2.07 | 8.15 | 14.60 | 1.2551 | 0.0997 | |||
| WCC / WESCO International, Inc. | 0.04 | 2.06 | 7.92 | 21.72 | 1.2196 | 0.1626 | |||
| SF / Stifel Financial Corp. | 0.07 | 2.06 | 7.77 | 12.38 | 1.1970 | 0.0733 | |||
| ONB / Old National Bancorp | 0.36 | 2.06 | 7.63 | 2.79 | 1.1751 | -0.0309 | |||
| COLB / Columbia Banking System, Inc. | 0.32 | 2.07 | 7.38 | -4.32 | 1.1367 | -0.1166 | |||
| CPT / Camden Property Trust | 0.06 | 2.07 | 7.32 | -5.95 | 1.1271 | -0.1372 | |||
| LECO / Lincoln Electric Holdings, Inc. | 0.04 | 2.07 | 7.26 | 11.86 | 1.1187 | 0.0637 | |||
| TXRH / Texas Roadhouse, Inc. | 0.04 | -16.98 | 7.18 | -6.62 | 1.1058 | -0.1435 | |||
| EHC / Encompass Health Corporation | 0.06 | -9.34 | 7.14 | 9.77 | 1.1002 | 0.0429 | |||
| QTWO / Q2 Holdings, Inc. | 0.08 | 2.07 | 7.12 | 19.39 | 1.0963 | 0.1276 | |||
| FSS / Federal Signal Corporation | 0.07 | 2.07 | 7.08 | 47.68 | 1.0900 | 0.3114 | |||
| VRNS / Varonis Systems, Inc. | 0.14 | 2.06 | 6.91 | 28.07 | 1.0647 | 0.1876 | |||
| MTX / Minerals Technologies Inc. | 0.12 | 17.39 | 6.47 | 1.70 | 0.9968 | -0.0373 | |||
| BRX / Brixmor Property Group Inc. | 0.25 | 2.07 | 6.39 | 0.11 | 0.9843 | -0.0530 | |||
| FR / First Industrial Realty Trust, Inc. | 0.13 | 2.06 | 6.39 | -8.97 | 0.9834 | -0.1561 | |||
| CLH / Clean Harbors, Inc. | 0.03 | 2.06 | 6.36 | 19.72 | 0.9789 | 0.1163 | |||
| SR / Spire Inc. | 0.09 | 2.07 | 6.33 | -4.80 | 0.9749 | -0.1053 | |||
| NBIX / Neurocrine Biosciences, Inc. | 0.05 | 0.00 | 6.22 | 13.65 | 0.9579 | 0.0687 | |||
| WSFS / WSFS Financial Corporation | 0.11 | 2.06 | 6.17 | 8.23 | 0.9499 | 0.0240 | |||
| WNS / WNS (Holdings) Limited | 0.10 | 2.07 | 6.07 | 4.96 | 0.9351 | -0.0046 | |||
| ARMK / Aramark | 0.14 | 2.06 | 5.90 | 23.81 | 0.9090 | 0.1344 | |||
| LBRT / Liberty Energy Inc. | 0.50 | 2.07 | 5.79 | -25.97 | 0.8918 | -0.3792 | |||
| ACA / Arcosa, Inc. | 0.07 | 41.25 | 5.73 | 58.81 | 0.8817 | 0.2960 | |||
| BPMC / Blueprint Medicines Corporation | 0.04 | -28.77 | 5.70 | 3.15 | 0.8775 | -0.0199 | |||
| ZWS / Zurn Elkay Water Solutions Corporation | 0.15 | 2.07 | 5.54 | 13.17 | 0.8539 | 0.0580 | |||
| KRG / Kite Realty Group Trust | 0.24 | 2.07 | 5.53 | 3.34 | 0.8520 | -0.0177 | |||
| DT / Dynatrace, Inc. | 0.10 | 2.07 | 5.51 | 19.50 | 0.8487 | 0.0996 | |||
| EAT / Brinker International, Inc. | 0.03 | -10.55 | 5.45 | 8.24 | 0.8395 | 0.0212 | |||
| NTRA / Natera, Inc. | 0.03 | -33.59 | 5.43 | -20.67 | 0.8364 | -0.2757 | |||
| SLAB / Silicon Laboratories Inc. | 0.04 | 2.07 | 5.40 | 33.63 | 0.8323 | 0.1751 | |||
| ESNT / Essent Group Ltd. | 0.09 | 2.07 | 5.40 | 7.38 | 0.8309 | 0.0147 | |||
| WSC / WillScot Holdings Corporation | 0.19 | 2.06 | 5.27 | 0.59 | 0.8124 | -0.0395 | |||
| CWST / Casella Waste Systems, Inc. | 0.05 | 2.06 | 5.22 | 5.62 | 0.8045 | 0.0009 | |||
| IMAX / IMAX Corporation | 0.19 | 2.06 | 5.22 | 8.30 | 0.8043 | 0.0209 | |||
| BKH / Black Hills Corporation | 0.09 | 2.07 | 5.18 | -5.60 | 0.7977 | -0.0937 | |||
| TTEK / Tetra Tech, Inc. | 0.14 | 2.06 | 5.16 | 25.49 | 0.7947 | 0.1266 | |||
| JLL / Jones Lang LaSalle Incorporated | 0.02 | 2.06 | 5.07 | 5.31 | 0.7815 | -0.0014 | |||
| LGND / Ligand Pharmaceuticals Incorporated | 0.04 | 0.00 | 4.96 | 8.11 | 0.7635 | 0.0186 | |||
| DOC / Healthpeak Properties, Inc. | 0.28 | 2.07 | 4.92 | -11.61 | 0.7583 | -0.1468 | |||
| GGG / Graco Inc. | 0.06 | 2.07 | 4.88 | 5.09 | 0.7511 | -0.0030 | |||
| TMDX / TransMedics Group, Inc. | 0.04 | 0.00 | 4.86 | 99.22 | 0.7478 | 0.3518 | |||
| AIT / Applied Industrial Technologies, Inc. | 0.02 | 69.59 | 4.84 | 74.93 | 0.7458 | 0.2961 | |||
| KBR / KBR, Inc. | 0.10 | 2.07 | 4.77 | -1.75 | 0.7348 | -0.0543 | |||
| HALO / Halozyme Therapeutics, Inc. | 0.09 | -13.62 | 4.77 | -29.57 | 0.7343 | -0.3657 | |||
| BCC / Boise Cascade Company | 0.05 | 2.07 | 4.68 | -9.68 | 0.7201 | -0.1208 | |||
| KAI / Kadant Inc. | 0.01 | 2.07 | 4.65 | -3.82 | 0.7165 | -0.0694 | |||
| AXSM / Axsome Therapeutics, Inc. | 0.04 | 46.62 | 4.60 | 31.24 | 0.7079 | 0.1389 | |||
| KNX / Knight-Swift Transportation Holdings Inc. | 0.10 | 2.06 | 4.51 | 3.80 | 0.6943 | -0.0113 | |||
| EXAS / Exact Sciences Corporation | 0.08 | 2.06 | 4.49 | 25.29 | 0.6922 | 0.1094 | |||
| KALU / Kaiser Aluminum Corporation | 0.06 | 27.57 | 4.42 | 68.16 | 0.6801 | 0.2534 | |||
| GTES / Gates Industrial Corporation plc | 0.19 | 38.88 | 4.34 | 73.72 | 0.6679 | 0.2623 | |||
| ABM / ABM Industries Incorporated | 0.09 | 2.07 | 4.29 | 1.73 | 0.6600 | -0.0243 | |||
| TOL / Toll Brothers, Inc. | 0.04 | -17.94 | 4.27 | -11.31 | 0.6582 | -0.1246 | |||
| US7587501039 / Regal-Beloit Corp. | 0.03 | 2.07 | 4.22 | 29.97 | 0.6506 | 0.1225 | |||
| PCOR / Procore Technologies, Inc. | 0.06 | 2.06 | 4.20 | 5.80 | 0.6464 | 0.0017 | |||
| LNTH / Lantheus Holdings, Inc. | 0.05 | 2.06 | 4.20 | -14.40 | 0.6463 | -0.1501 | |||
| RGEN / Repligen Corporation | 0.03 | 22.89 | 4.19 | 20.13 | 0.6452 | 0.0786 | |||
| YETI / YETI Holdings, Inc. | 0.13 | 2.06 | 4.14 | -2.81 | 0.6382 | -0.0545 | |||
| IPG / The Interpublic Group of Companies, Inc. | 0.17 | 2.07 | 4.13 | -8.02 | 0.6361 | -0.0933 | |||
| GKOS / Glaukos Corporation | 0.04 | 4.01 | 0.6176 | 0.6176 | |||||
| GTLS / Chart Industries, Inc. | 0.02 | 2.06 | 3.96 | 16.42 | 0.6095 | 0.0572 | |||
| BWA / BorgWarner Inc. | 0.12 | 2.07 | 3.87 | 19.29 | 0.5963 | 0.0689 | |||
| HLNE / Hamilton Lane Incorporated | 0.03 | 56.12 | 3.85 | 49.26 | 0.5922 | 0.1736 | |||
| TRNO / Terreno Realty Corporation | 0.07 | 2.06 | 3.81 | -9.48 | 0.5870 | -0.0971 | |||
| TECH / Bio-Techne Corporation | 0.07 | 2.07 | 3.73 | -10.43 | 0.5751 | -0.1023 | |||
| JJSF / J&J Snack Foods Corp. | 0.03 | 2.06 | 3.46 | -12.14 | 0.5330 | -0.1068 | |||
| HUN / Huntsman Corporation | 0.33 | 2.06 | 3.44 | -32.66 | 0.5298 | -0.3000 | |||
| ULS / UL Solutions Inc. | 0.05 | 2.07 | 3.42 | 31.89 | 0.5261 | 0.1052 | |||
| SUPN / Supernus Pharmaceuticals, Inc. | 0.11 | 0.00 | 3.38 | -3.73 | 0.5201 | -0.0500 | |||
| BOX / Box, Inc. | 0.10 | 2.06 | 3.37 | 12.99 | 0.5198 | 0.0346 | |||
| APG / APi Group Corporation | 0.07 | 2.07 | 3.34 | 45.72 | 0.5140 | 0.1419 | |||
| PWR / Quanta Services, Inc. | 0.01 | -33.74 | 3.33 | -1.42 | 0.5129 | -0.0361 | |||
| CSL / Carlisle Companies Incorporated | 0.01 | -55.65 | 3.30 | -51.36 | 0.5086 | -0.5945 | |||
| SNV / Synovus Financial Corp. | 0.06 | 3.25 | 0.5010 | 0.5010 | |||||
| ALAB / Astera Labs, Inc. | 0.04 | 3.25 | 0.4998 | 0.4998 | |||||
| PTC / PTC Inc. | 0.02 | 2.06 | 3.20 | 13.53 | 0.4924 | 0.0348 | |||
| YELP / Yelp Inc. | 0.09 | 2.07 | 3.09 | -5.53 | 0.4765 | -0.0557 | |||
| SPSC / SPS Commerce, Inc. | 0.02 | 2.07 | 3.01 | 4.66 | 0.4636 | -0.0037 | |||
| NXST / Nexstar Media Group, Inc. | 0.02 | 2.07 | 3.00 | -1.48 | 0.4616 | -0.0328 | |||
| TGLS / Tecnoglass Inc. | 0.04 | 2.99 | 0.4612 | 0.4612 | |||||
| LZB / La-Z-Boy Incorporated | 0.08 | 2.06 | 2.98 | -2.96 | 0.4595 | -0.0400 | |||
| SHOO / Steven Madden, Ltd. | 0.12 | -21.78 | 2.98 | -29.60 | 0.4595 | -0.2290 | |||
| XPO / XPO, Inc. | 0.02 | 2.07 | 2.94 | 19.81 | 0.4527 | 0.0541 | |||
| INSP / Inspire Medical Systems, Inc. | 0.02 | 2.06 | 2.90 | -16.83 | 0.4466 | -0.1200 | |||
| TMHC / Taylor Morrison Home Corporation | 0.05 | 2.07 | 2.86 | 4.41 | 0.4412 | -0.0046 | |||
| LTH / Life Time Group Holdings, Inc. | 0.09 | 2.84 | 0.4376 | 0.4376 | |||||
| ASGN / ASGN Incorporated | 0.06 | 2.07 | 2.80 | -19.15 | 0.4319 | -0.1315 | |||
| RBRK / Rubrik, Inc. | 0.03 | 2.06 | 2.68 | 49.94 | 0.4134 | 0.1226 | |||
| CRS / Carpenter Technology Corporation | 0.01 | 2.59 | 0.3984 | 0.3984 | |||||
| WK / Workiva Inc. | 0.04 | 2.06 | 2.49 | -7.96 | 0.3831 | -0.0560 | |||
| SPXC / SPX Technologies, Inc. | 0.01 | 2.39 | 0.3686 | 0.3686 | |||||
| KBH / KB Home | 0.04 | 2.07 | 2.27 | -6.97 | 0.3495 | -0.0469 | |||
| WEN / The Wendy's Company | 0.20 | 2.06 | 2.23 | -20.32 | 0.3436 | -0.1114 | |||
| RARE / Ultragenyx Pharmaceutical Inc. | 0.06 | 2.06 | 2.14 | 2.49 | 0.3300 | -0.0097 | |||
| MBUU / Malibu Boats, Inc. | 0.06 | 2.07 | 2.01 | 4.26 | 0.3091 | -0.0037 | |||
| SAIA / Saia, Inc. | 0.01 | 171.12 | 1.87 | 112.73 | 0.2884 | 0.1453 | |||
| RPD / Rapid7, Inc. | 0.06 | 2.07 | 1.50 | -10.95 | 0.2306 | -0.0426 | |||
| INSW / International Seaways, Inc. | 0.04 | 2.06 | 1.48 | 12.12 | 0.2281 | 0.0135 | |||
| FOLD / Amicus Therapeutics, Inc. | 0.25 | 2.07 | 1.45 | -28.35 | 0.2236 | -0.1055 | |||
| FTAI / FTAI Aviation Ltd. | 0.01 | 2.07 | 1.40 | 5.74 | 0.2159 | 0.0005 | |||
| ATKR / Atkore Inc. | 0.02 | 2.06 | 1.09 | 20.00 | 0.1682 | 0.0204 | |||
| ATI / ATI Inc. | 0.00 | 0.10 | 0.0156 | 0.0156 | |||||
| AZTA / Azenta, Inc. | 0.00 | -100.00 | 0.00 | -100.00 | -0.3327 | ||||
| US68218J3014 / OmniAb, Inc. | 0.01 | 0.00 | 0.00 | 0.0000 | 0.0000 | ||||
| US68218J2024 / OmniAb, Inc. | 0.01 | 0.00 | 0.00 | 0.0000 | 0.0000 | ||||
| BECN / Beacon Roofing Supply, Inc. | 0.00 | -100.00 | 0.00 | -100.00 | -1.7202 | ||||
| ITCI / Intra-Cellular Therapies, Inc. | 0.00 | -100.00 | 0.00 | -100.00 | -0.2683 |