Mga Batayang Estadistika
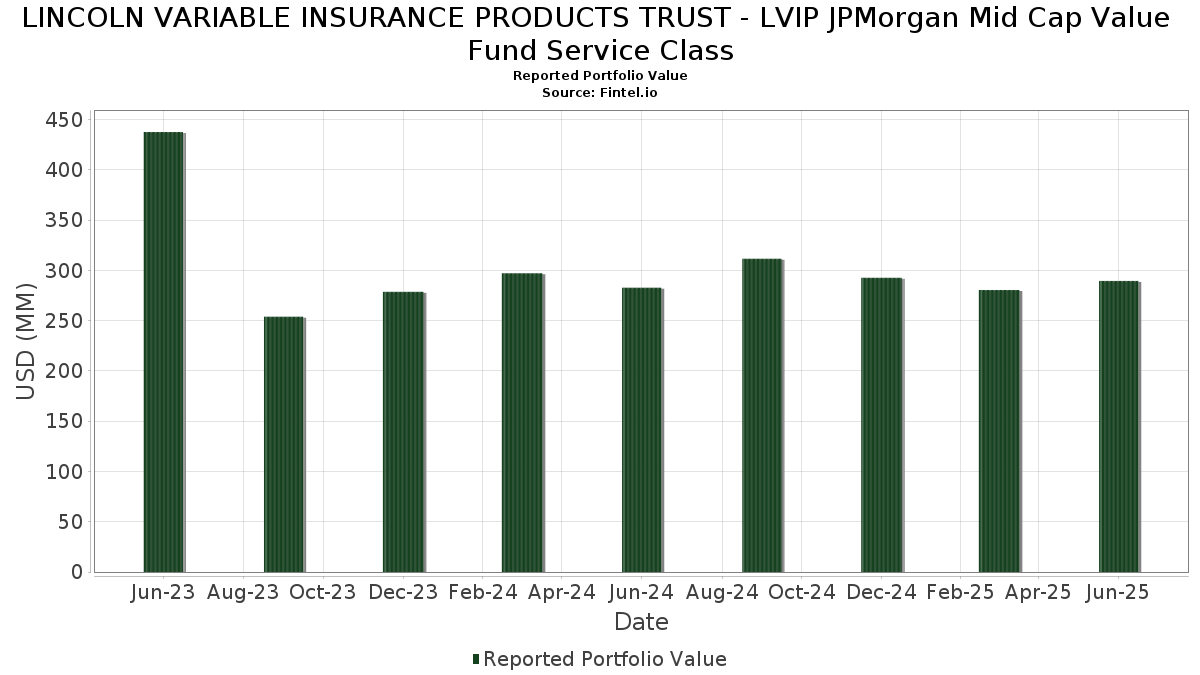
| Nilai Portofolio | $ 289,491,259 |
| Posisi Saat Ini | 97 |
Kepemilikan Terbaru, Kinerja, AUM (dari 13F, 13D)
LINCOLN VARIABLE INSURANCE PRODUCTS TRUST - LVIP JPMorgan Mid Cap Value Fund Service Class telah mengungkapkan total kepemilikan 97 dalam pengajuan SEC terbaru mereka. Nilai portofolio terbaru dihitung sebesar $ 289,491,259 USD. Aset yang Dikelola (AUM) sebenarnya adalah nilai ini ditambah kas (yang tidak diungkapkan). Aset-aset utama LINCOLN VARIABLE INSURANCE PRODUCTS TRUST - LVIP JPMorgan Mid Cap Value Fund Service Class adalah State Street Institutional Investment Trust - State Street Institutional US Govt Money Market Fnd Premier Cls (US:GVMXX) , Fidelity National Information Services, Inc. (US:FIS) , WEC Energy Group, Inc. (US:WEC) , Loews Corporation (US:L) , and State Street Corporation (US:STT) . Posisi baru LINCOLN VARIABLE INSURANCE PRODUCTS TRUST - LVIP JPMorgan Mid Cap Value Fund Service Class meliputi: Marathon Petroleum Corporation (US:MPC) , Simon Property Group, Inc. (US:SPG) , Omnicom Group Inc. (US:OMC) , Healthpeak Properties, Inc. (US:PEAK) , and Zoom Communications Inc. (US:ZM) .
Peningkatan Tertinggi Kuartal Ini
Kami menggunakan perubahan dalam alokasi portofolio karena ini adalah metrik yang paling bermakna. Perubahan dapat disebabkan oleh perdagangan atau perubahan harga saham.
| Keamanan | Saham (MM) |
Nilai (Juta Dolar AS) |
Portfolio % | ΔPorsyento ng Portfolio |
|---|---|---|---|---|
| 0.02 | 2.86 | 0.9886 | 0.9886 | |
| 0.02 | 2.75 | 0.9493 | 0.9493 | |
| 0.02 | 1.75 | 0.6037 | 0.6037 | |
| 0.05 | 2.79 | 0.9646 | 0.4843 | |
| 0.03 | 4.19 | 1.4460 | 0.4790 | |
| 0.07 | 1.30 | 0.4494 | 0.4494 | |
| 0.01 | 3.21 | 1.1081 | 0.3411 | |
| 0.05 | 4.89 | 1.6879 | 0.3134 | |
| 0.01 | 3.88 | 1.3378 | 0.3123 | |
| 0.01 | 3.53 | 1.2172 | 0.2996 |
Penurunan Tertinggi Kuartal Ini
Kami menggunakan perubahan dalam alokasi portofolio karena ini adalah metrik yang paling bermakna. Perubahan dapat disebabkan oleh perdagangan atau perubahan harga saham.
| Keamanan | Saham (MM) |
Nilai (Juta Dolar AS) |
Portfolio % | ΔPorsyento ng Portfolio |
|---|---|---|---|---|
| 5.93 | 5.93 | 2.0458 | -2.0235 | |
| 0.00 | 0.00 | -0.8789 | ||
| 0.13 | 1.85 | 0.6373 | -0.7897 | |
| 0.05 | 2.89 | 0.9961 | -0.6460 | |
| 0.00 | 0.71 | 0.2441 | -0.5337 | |
| 0.02 | 0.99 | 0.3428 | -0.4300 | |
| 0.05 | 2.78 | 0.9585 | -0.4106 | |
| 0.05 | 2.51 | 0.8670 | -0.3307 | |
| 0.09 | 2.08 | 0.7165 | -0.3298 | |
| 0.01 | 4.84 | 1.6698 | -0.2785 |
Pengajuan 13F dan Dana
Formulir ini diajukan pada 2025-08-06 untuk periode pelaporan 2025-06-30. Klik ikon tautan untuk melihat riwayat transaksi selengkapnya.
Tingkatkan ke versi premium untuk membuka data premium dan ekspor ke Excel. ![]() .
.
| Keamanan | Ketik | Harga Saham Rata-rata | Saham (MM) |
ΔSaham (%) |
ΔSaham (%) |
Nilai ($MM) |
Portpolyo (%) |
ΔPortofolio (%) |
|
|---|---|---|---|---|---|---|---|---|---|
| GVMXX / State Street Institutional Investment Trust - State Street Institutional US Govt Money Market Fnd Premier Cls | 5.93 | -48.11 | 5.93 | -48.11 | 2.0458 | -2.0235 | |||
| FIS / Fidelity National Information Services, Inc. | 0.07 | 6.66 | 5.76 | 16.29 | 1.9891 | 0.2235 | |||
| WEC / WEC Energy Group, Inc. | 0.05 | 6.56 | 5.55 | 1.89 | 1.9170 | -0.0248 | |||
| L / Loews Corporation | 0.06 | -1.80 | 5.55 | -2.07 | 1.9152 | -0.1032 | |||
| STT / State Street Corporation | 0.05 | 6.71 | 4.89 | 26.76 | 1.6879 | 0.3134 | |||
| AMP / Ameriprise Financial, Inc. | 0.01 | -19.77 | 4.84 | -11.54 | 1.6698 | -0.2785 | |||
| HIG / The Hartford Insurance Group, Inc. | 0.04 | 6.71 | 4.76 | 9.42 | 1.6448 | 0.0932 | |||
| ACGL / Arch Capital Group Ltd. | 0.05 | 6.71 | 4.66 | 1.02 | 1.6076 | -0.0349 | |||
| RJF / Raymond James Financial, Inc. | 0.03 | -12.07 | 4.64 | -2.91 | 1.6032 | -0.1012 | |||
| DGX / Quest Diagnostics Incorporated | 0.03 | 0.87 | 4.60 | 7.07 | 1.5888 | 0.0575 | |||
| MTG / MGIC Investment Corporation | 0.16 | 6.71 | 4.43 | 19.88 | 1.5305 | 0.2129 | |||
| CMS / CMS Energy Corporation | 0.06 | 6.57 | 4.27 | -1.70 | 1.4731 | -0.0737 | |||
| AME / AMETEK, Inc. | 0.02 | -4.77 | 4.25 | 0.12 | 1.4658 | -0.0454 | |||
| DOV / Dover Corporation | 0.02 | 18.76 | 4.19 | 23.88 | 1.4472 | 0.2413 | |||
| SNX / TD SYNNEX Corporation | 0.03 | 18.23 | 4.19 | 54.35 | 1.4460 | 0.4790 | |||
| WRB / W. R. Berkley Corporation | 0.06 | 5.21 | 4.16 | 8.63 | 1.4346 | 0.0715 | |||
| XEL / Xcel Energy Inc. | 0.06 | 6.57 | 4.12 | 2.51 | 1.4238 | -0.0096 | |||
| HUBB / Hubbell Incorporated | 0.01 | 9.09 | 3.88 | 34.64 | 1.3378 | 0.3123 | |||
| COR / Cencora, Inc. | 0.01 | -17.74 | 3.84 | -11.32 | 1.3258 | -0.2170 | |||
| ITT / ITT Inc. | 0.02 | 9.10 | 3.83 | 32.48 | 1.3235 | 0.2923 | |||
| TDY / Teledyne Technologies Incorporated | 0.01 | -8.31 | 3.78 | -5.64 | 1.3055 | -0.1221 | |||
| FCNCA / First Citizens BancShares, Inc. | 0.00 | 6.66 | 3.76 | 12.54 | 1.2981 | 0.1077 | |||
| HSIC / Henry Schein, Inc. | 0.05 | -2.62 | 3.71 | 3.87 | 1.2797 | 0.0080 | |||
| FANG / Diamondback Energy, Inc. | 0.03 | 47.66 | 3.66 | 26.93 | 1.2642 | 0.2360 | |||
| IR / Ingersoll Rand Inc. | 0.04 | 9.14 | 3.64 | 13.43 | 1.2568 | 0.1133 | |||
| AYI / Acuity Inc. | 0.01 | 20.85 | 3.53 | 36.93 | 1.2172 | 0.2996 | |||
| ZBRA / Zebra Technologies Corporation | 0.01 | 23.18 | 3.50 | 34.42 | 1.2094 | 0.2808 | |||
| NI / NiSource Inc. | 0.09 | 6.57 | 3.50 | 7.21 | 1.2068 | 0.0452 | |||
| LECO / Lincoln Electric Holdings, Inc. | 0.02 | 9.14 | 3.46 | 19.61 | 1.1938 | 0.1637 | |||
| MTB / M&T Bank Corporation | 0.02 | -2.27 | 3.43 | 6.07 | 1.1823 | 0.0317 | |||
| MLM / Martin Marietta Materials, Inc. | 0.01 | -1.35 | 3.40 | 13.24 | 1.1749 | 0.1043 | |||
| GPC / Genuine Parts Company | 0.03 | 19.95 | 3.29 | 22.14 | 1.1370 | 0.1762 | |||
| REG / Regency Centers Corporation | 0.05 | -7.45 | 3.28 | -10.62 | 1.1331 | -0.1754 | |||
| CTRA / Coterra Energy Inc. | 0.13 | 4.87 | 3.24 | -7.91 | 1.1169 | -0.1348 | |||
| CSL / Carlisle Companies Incorporated | 0.01 | 9.25 | 3.23 | 19.81 | 1.1148 | 0.1544 | |||
| FITB / Fifth Third Bancorp | 0.08 | 0.00 | 3.21 | 4.93 | 1.1085 | 0.0181 | |||
| RL / Ralph Lauren Corporation | 0.01 | 20.00 | 3.21 | 49.16 | 1.1081 | 0.3411 | |||
| VLTO / Veralto Corporation | 0.03 | 20.86 | 3.15 | 25.21 | 1.0891 | 0.1912 | |||
| AVB / AvalonBay Communities, Inc. | 0.02 | 6.57 | 3.12 | 1.07 | 1.0770 | -0.0231 | |||
| KR / The Kroger Co. | 0.04 | -15.27 | 3.11 | -10.21 | 1.0748 | -0.1607 | |||
| AZO / AutoZone, Inc. | 0.00 | 7.75 | 3.10 | 4.88 | 1.0687 | 0.0173 | |||
| IQV / IQVIA Holdings Inc. | 0.02 | 60.10 | 3.08 | 43.10 | 1.0638 | 0.2966 | |||
| KDP / Keurig Dr Pepper Inc. | 0.09 | 9.04 | 3.04 | 5.35 | 1.0479 | 0.0212 | |||
| WY / Weyerhaeuser Company | 0.12 | 30.03 | 3.01 | 14.10 | 1.0395 | 0.0991 | |||
| GEHC / GE HealthCare Technologies Inc. | 0.04 | 40.56 | 3.01 | 29.00 | 1.0381 | 0.2075 | |||
| AMH / American Homes 4 Rent | 0.08 | 6.57 | 2.99 | 1.67 | 1.0312 | -0.0157 | |||
| JBL / Jabil Inc. | 0.01 | -26.10 | 2.96 | 18.48 | 1.0225 | 0.1315 | |||
| WMB / The Williams Companies, Inc. | 0.05 | -40.44 | 2.89 | -37.41 | 0.9961 | -0.6460 | |||
| MPC / Marathon Petroleum Corporation | 0.02 | 2.86 | 0.9886 | 0.9886 | |||||
| JBHT / J.B. Hunt Transport Services, Inc. | 0.02 | 8.49 | 2.84 | 5.31 | 0.9787 | 0.0194 | |||
| HST / Host Hotels & Resorts, Inc. | 0.18 | 21.55 | 2.83 | 31.40 | 0.9753 | 0.2091 | |||
| RPM / RPM International Inc. | 0.03 | 9.11 | 2.82 | 3.60 | 0.9729 | 0.0037 | |||
| ON / ON Semiconductor Corporation | 0.05 | 60.94 | 2.79 | 107.42 | 0.9646 | 0.4843 | |||
| GIS / General Mills, Inc. | 0.05 | -16.62 | 2.78 | -27.75 | 0.9585 | -0.4106 | |||
| GMED / Globus Medical, Inc. | 0.05 | 38.94 | 2.75 | 12.04 | 0.9508 | 0.0748 | |||
| SPG / Simon Property Group, Inc. | 0.02 | 2.75 | 0.9493 | 0.9493 | |||||
| DRI / Darden Restaurants, Inc. | 0.01 | 9.12 | 2.72 | 14.46 | 0.9375 | 0.0923 | |||
| PSA / Public Storage | 0.01 | 29.42 | 2.70 | 26.85 | 0.9330 | 0.1741 | |||
| BALL / Ball Corporation | 0.05 | 18.85 | 2.70 | 28.03 | 0.9304 | 0.1803 | |||
| PSN / Parsons Corporation | 0.04 | 9.26 | 2.69 | 32.46 | 0.9298 | 0.2052 | |||
| BKR / Baker Hughes Company | 0.07 | 3.99 | 2.68 | -9.28 | 0.9252 | -0.1274 | |||
| SBAC / SBA Communications Corporation | 0.01 | -1.11 | 2.65 | 5.55 | 0.9132 | 0.0203 | |||
| MHK / Mohawk Industries, Inc. | 0.03 | 8.49 | 2.62 | -0.38 | 0.9051 | -0.0327 | |||
| SLGN / Silgan Holdings Inc. | 0.05 | 9.11 | 2.62 | 15.67 | 0.9044 | 0.0972 | |||
| CDW / CDW Corporation | 0.01 | 79.55 | 2.62 | 43.21 | 0.9030 | 0.2579 | |||
| POST / Post Holdings, Inc. | 0.02 | 9.11 | 2.61 | 2.23 | 0.9004 | -0.0086 | |||
| LNG / Cheniere Energy, Inc. | 0.01 | 16.49 | 2.55 | 22.60 | 0.8806 | 0.1392 | |||
| ROST / Ross Stores, Inc. | 0.02 | 54.81 | 2.54 | 54.57 | 0.8761 | 0.2910 | |||
| IP / International Paper Company | 0.05 | -14.88 | 2.51 | -25.29 | 0.8670 | -0.3307 | |||
| GDDY / GoDaddy Inc. | 0.01 | -5.48 | 2.47 | -5.54 | 0.8529 | -0.0789 | |||
| MIDD / The Middleby Corporation | 0.02 | 55.31 | 2.45 | 47.18 | 0.8466 | 0.2528 | |||
| WWD / Woodward, Inc. | 0.01 | 8.40 | 2.38 | 45.54 | 0.8232 | 0.2396 | |||
| IAC / IAC Inc. | 0.06 | 35.00 | 2.35 | 9.76 | 0.8116 | 0.0482 | |||
| ULS / UL Solutions Inc. | 0.03 | -39.77 | 2.33 | -22.20 | 0.8044 | -0.2627 | |||
| JAZZ / Jazz Pharmaceuticals plc | 0.02 | 9.11 | 2.25 | -6.76 | 0.7763 | -0.0828 | |||
| EXPE / Expedia Group, Inc. | 0.01 | 8.83 | 2.21 | 9.21 | 0.7612 | 0.0418 | |||
| BBY / Best Buy Co., Inc. | 0.03 | 7.51 | 2.17 | -1.94 | 0.7499 | -0.0395 | |||
| BBWI / Bath & Body Works, Inc. | 0.07 | 36.00 | 2.09 | 34.40 | 0.7231 | 0.1677 | |||
| RF / Regions Financial Corporation | 0.09 | -34.70 | 2.08 | -29.33 | 0.7165 | -0.3298 | |||
| WMG / Warner Music Group Corp. | 0.07 | 0.00 | 1.95 | -13.09 | 0.6738 | -0.1266 | |||
| PCG / PG&E Corporation | 0.13 | -43.19 | 1.85 | -53.91 | 0.6373 | -0.7897 | |||
| HUM / Humana Inc. | 0.01 | -12.93 | 1.80 | -19.57 | 0.6231 | -0.1763 | |||
| HSY / The Hershey Company | 0.01 | 9.11 | 1.78 | 5.88 | 0.6160 | 0.0155 | |||
| OMC / Omnicom Group Inc. | 0.02 | 1.75 | 0.6037 | 0.6037 | |||||
| PKG / Packaging Corporation of America | 0.01 | 9.11 | 1.73 | 3.83 | 0.5985 | 0.0036 | |||
| OWL / Blue Owl Capital Inc. | 0.09 | 6.71 | 1.70 | 2.29 | 0.5857 | -0.0053 | |||
| FCX / Freeport-McMoRan Inc. | 0.04 | -14.52 | 1.68 | -2.16 | 0.5798 | -0.0316 | |||
| STZ / Constellation Brands, Inc. | 0.01 | 9.12 | 1.57 | -3.27 | 0.5411 | -0.0363 | |||
| PEAK / Healthpeak Properties, Inc. | 0.07 | 1.30 | 0.4494 | 0.4494 | |||||
| GPK / Graphic Packaging Holding Company | 0.06 | 9.11 | 1.26 | -11.47 | 0.4345 | -0.0719 | |||
| COLB / Columbia Banking System, Inc. | 0.05 | 29.47 | 1.22 | 21.46 | 0.4201 | 0.0629 | |||
| USFD / US Foods Holding Corp. | 0.02 | -28.30 | 1.19 | -15.62 | 0.4123 | -0.0922 | |||
| NTRS / Northern Trust Corporation | 0.01 | 6.71 | 1.18 | 37.21 | 0.4074 | 0.1008 | |||
| SRE / Sempra | 0.01 | 23.99 | 1.00 | -35.46 | 0.3464 | -0.0076 | |||
| VTR / Ventas, Inc. | 0.02 | -50.15 | 0.99 | -54.22 | 0.3428 | -0.4300 | |||
| ZM / Zoom Communications Inc. | 0.01 | 0.79 | 0.2721 | 0.2721 | |||||
| MAA / Mid-America Apartment Communities, Inc. | 0.00 | -63.33 | 0.71 | -67.60 | 0.2441 | -0.5337 | |||
| FBIN / Fortune Brands Innovations, Inc. | 0.00 | -100.00 | 0.00 | -100.00 | -0.8789 |