Mga Batayang Estadistika
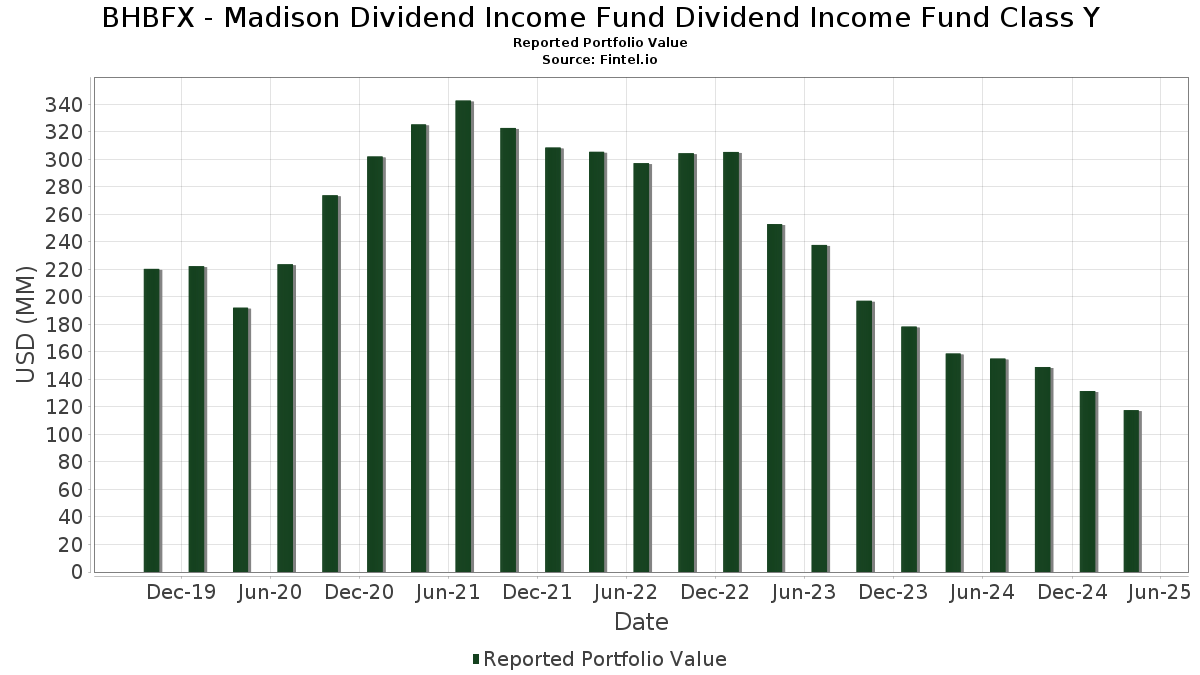
| Nilai Portofolio | $ 117,701,112 |
| Posisi Saat Ini | 41 |
Kepemilikan Terbaru, Kinerja, AUM (dari 13F, 13D)
BHBFX - Madison Dividend Income Fund Dividend Income Fund Class Y telah mengungkapkan total kepemilikan 41 dalam pengajuan SEC terbaru mereka. Nilai portofolio terbaru dihitung sebesar $ 117,701,112 USD. Aset yang Dikelola (AUM) sebenarnya adalah nilai ini ditambah kas (yang tidak diungkapkan). Aset-aset utama BHBFX - Madison Dividend Income Fund Dividend Income Fund Class Y adalah Automatic Data Processing, Inc. (US:ADP) , CME Group Inc. (US:CME) , NextEra Energy, Inc. (US:NEE) , Medtronic plc (US:MDT) , and The Home Depot, Inc. (US:HD) . Posisi baru BHBFX - Madison Dividend Income Fund Dividend Income Fund Class Y meliputi: Marsh & McLennan Companies, Inc. (US:MMC) , .
Peningkatan Tertinggi Kuartal Ini
Kami menggunakan perubahan dalam alokasi portofolio karena ini adalah metrik yang paling bermakna. Perubahan dapat disebabkan oleh perdagangan atau perubahan harga saham.
| Keamanan | Saham (MM) |
Nilai (Juta Dolar AS) |
Portfolio % | ΔPorsyento ng Portfolio |
|---|---|---|---|---|
| 0.01 | 2.71 | 2.2963 | 2.2963 | |
| 0.01 | 3.34 | 2.8377 | 1.8018 | |
| 0.02 | 5.15 | 4.3739 | 0.7663 | |
| 0.02 | 3.61 | 3.0609 | 0.6749 | |
| 0.01 | 1.82 | 1.5467 | 0.5698 | |
| 0.05 | 3.85 | 3.2710 | 0.4532 | |
| 2.44 | 2.44 | 2.0689 | 0.3971 | |
| 0.02 | 3.34 | 2.8314 | 0.2218 | |
| 0.03 | 4.11 | 3.4890 | 0.2099 | |
| 0.01 | 1.92 | 1.6318 | 0.2047 |
Penurunan Tertinggi Kuartal Ini
Kami menggunakan perubahan dalam alokasi portofolio karena ini adalah metrik yang paling bermakna. Perubahan dapat disebabkan oleh perdagangan atau perubahan harga saham.
| Keamanan | Saham (MM) |
Nilai (Juta Dolar AS) |
Portfolio % | ΔPorsyento ng Portfolio |
|---|---|---|---|---|
| 0.01 | 0.61 | 0.5135 | -2.2602 | |
| 0.00 | 4.09 | 3.4723 | -0.4248 | |
| 0.01 | 2.29 | 1.9441 | -0.4092 | |
| 0.03 | 3.86 | 3.2718 | -0.4033 | |
| 0.02 | 3.40 | 2.8865 | -0.3076 | |
| 0.01 | 4.24 | 3.5949 | -0.2974 | |
| 0.01 | 3.21 | 2.7227 | -0.2965 | |
| 0.02 | 1.42 | 1.2093 | -0.2942 | |
| 0.07 | 2.89 | 2.4505 | -0.2514 | |
| 0.01 | 3.07 | 2.6036 | -0.2357 |
Pengajuan 13F dan Dana
Formulir ini diajukan pada 2025-06-17 untuk periode pelaporan 2025-04-30. Klik ikon tautan untuk melihat riwayat transaksi selengkapnya.
Tingkatkan ke versi premium untuk membuka data premium dan ekspor ke Excel. ![]() .
.
| Keamanan | Ketik | Harga Saham Rata-rata | Saham (MM) |
ΔSaham (%) |
ΔSaham (%) |
Nilai ($MM) |
Portpolyo (%) |
ΔPortofolio (%) |
|
|---|---|---|---|---|---|---|---|---|---|
| ADP / Automatic Data Processing, Inc. | 0.02 | -6.25 | 5.41 | -7.00 | 4.5922 | 0.1773 | |||
| CME / CME Group Inc. | 0.02 | -7.46 | 5.15 | 8.39 | 4.3739 | 0.7663 | |||
| NEE / NextEra Energy, Inc. | 0.06 | -7.80 | 4.27 | -13.84 | 3.6214 | -0.1365 | |||
| MDT / Medtronic plc | 0.05 | -5.83 | 4.25 | -12.11 | 3.6040 | -0.0625 | |||
| HD / The Home Depot, Inc. | 0.01 | -5.62 | 4.24 | -17.43 | 3.5949 | -0.2974 | |||
| HON / Honeywell International Inc. | 0.02 | -7.49 | 4.16 | -12.96 | 3.5284 | -0.0963 | |||
| JNJ / Johnson & Johnson | 0.03 | -7.39 | 4.11 | -4.88 | 3.4890 | 0.2099 | |||
| BLK / BlackRock, Inc. | 0.00 | -6.28 | 4.09 | -20.33 | 3.4723 | -0.4248 | |||
| MS / Morgan Stanley | 0.03 | -4.53 | 3.86 | -20.38 | 3.2718 | -0.4033 | |||
| FAST / Fastenal Company | 0.05 | -6.11 | 3.85 | 3.80 | 3.2710 | 0.4532 | |||
| AMT / American Tower Corporation | 0.02 | -5.88 | 3.61 | 14.69 | 3.0609 | 0.6749 | |||
| EOG / EOG Resources, Inc. | 0.03 | -5.12 | 3.48 | -16.79 | 2.9496 | -0.2196 | |||
| TXN / Texas Instruments Incorporated | 0.02 | -6.80 | 3.40 | -19.20 | 2.8865 | -0.3076 | |||
| JPM / JPMorgan Chase & Co. | 0.01 | -5.19 | 3.35 | -13.23 | 2.8442 | -0.0868 | |||
| ELV / Elevance Health, Inc. | 0.01 | 130.43 | 3.34 | 144.91 | 2.8377 | 1.8018 | |||
| ABBV / AbbVie Inc. | 0.02 | -8.56 | 3.34 | -2.97 | 2.8314 | 0.2218 | |||
| CMCSA / Comcast Corporation | 0.10 | -6.61 | 3.29 | -5.11 | 2.7894 | 0.1610 | |||
| LOW / Lowe's Companies, Inc. | 0.01 | -6.21 | 3.21 | -19.36 | 2.7227 | -0.2965 | |||
| ABT / Abbott Laboratories | 0.02 | -9.54 | 3.10 | -7.55 | 2.6299 | 0.0864 | |||
| UNP / Union Pacific Corporation | 0.01 | -5.79 | 3.07 | -18.02 | 2.6036 | -0.2357 | |||
| CVX / Chevron Corporation | 0.02 | -4.74 | 3.01 | -13.15 | 2.5520 | -0.0746 | |||
| BAC / Bank of America Corporation | 0.07 | -5.85 | 2.89 | -18.90 | 2.4505 | -0.2514 | |||
| MMC / Marsh & McLennan Companies, Inc. | 0.01 | 2.71 | 2.2963 | 2.2963 | |||||
| PEP / PepsiCo, Inc. | 0.02 | -3.12 | 2.52 | -12.86 | 2.1402 | -0.0553 | |||
| GVMXX / State Street Institutional Investment Trust - State Street Institutional US Govt Money Market Fnd Premier Cls | 2.44 | 10.65 | 2.44 | 10.62 | 2.0689 | 0.3971 | |||
| XOM / Exxon Mobil Corporation | 0.02 | -5.81 | 2.40 | -6.88 | 2.0350 | 0.0813 | |||
| PAYX / Paychex, Inc. | 0.02 | -7.02 | 2.34 | -7.37 | 1.9853 | 0.0691 | |||
| APD / Air Products and Chemicals, Inc. | 0.01 | -8.65 | 2.29 | -26.15 | 1.9441 | -0.4092 | |||
| CL / Colgate-Palmolive Company | 0.02 | -8.82 | 2.29 | -3.05 | 1.9404 | 0.1508 | |||
| HSY / The Hershey Company | 0.01 | -8.73 | 1.92 | 2.23 | 1.6318 | 0.2047 | |||
| COP / ConocoPhillips | 0.02 | -2.74 | 1.90 | -12.29 | 1.6111 | -0.0314 | |||
| PG / The Procter & Gamble Company | 0.01 | -8.73 | 1.87 | -10.62 | 1.5867 | -0.0004 | |||
| TE Connectivity PLC / EC (IE000IVNQZ81) | 0.01 | 43.10 | 1.82 | 41.57 | 1.5467 | 0.5698 | |||
| MCD / McDonald's Corporation | 0.01 | -8.06 | 1.82 | 1.84 | 1.5463 | 0.1880 | |||
| ROK / Rockwell Automation, Inc. | 0.01 | -9.72 | 1.61 | -19.71 | 1.3663 | -0.1549 | |||
| CMI / Cummins Inc. | 0.01 | -7.04 | 1.60 | -23.32 | 1.3591 | -0.2259 | |||
| ADI / Analog Devices, Inc. | 0.01 | -9.76 | 1.44 | -16.98 | 1.2242 | -0.0943 | |||
| SBUX / Starbucks Corporation | 0.02 | -3.26 | 1.42 | -28.12 | 1.2093 | -0.2942 | |||
| CAT / Caterpillar Inc. | 0.00 | -7.50 | 1.14 | -22.96 | 0.9712 | -0.1563 | |||
| ACN / Accenture plc | 0.00 | -7.50 | 1.11 | -28.14 | 0.9394 | -0.2291 | |||
| USB / U.S. Bancorp | 0.01 | -80.39 | 0.61 | -83.45 | 0.5135 | -2.2602 |