Mga Batayang Estadistika
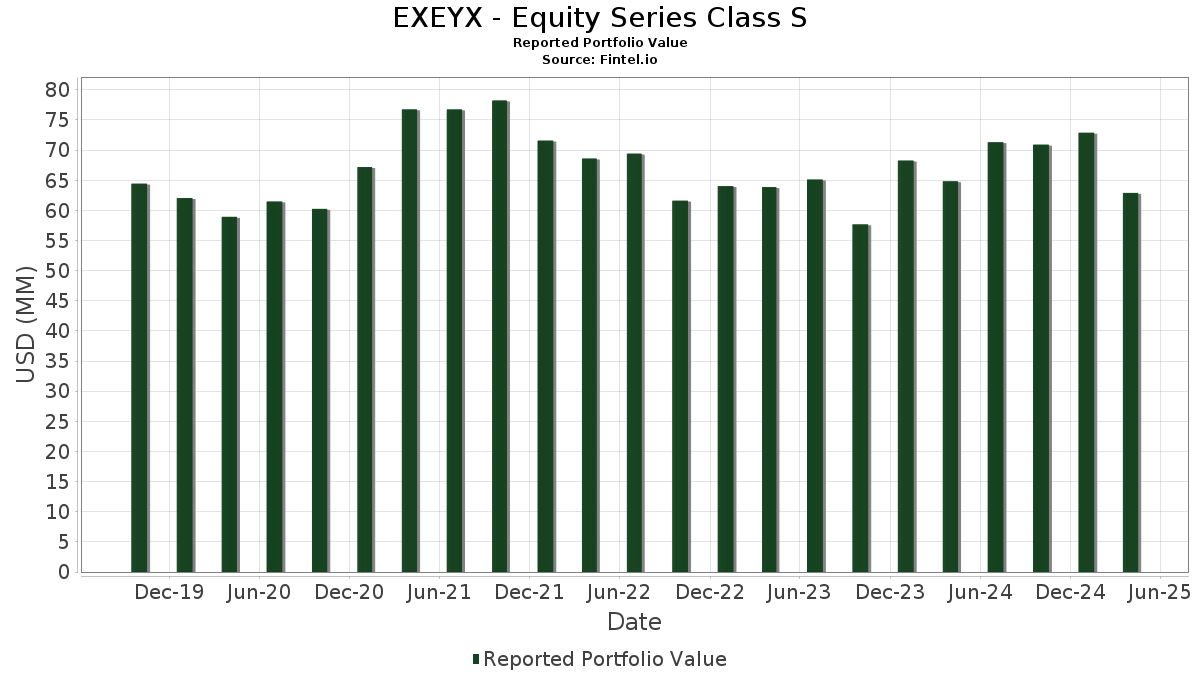
| Nilai Portofolio | $ 62,895,547 |
| Posisi Saat Ini | 44 |
Kepemilikan Terbaru, Kinerja, AUM (dari 13F, 13D)
EXEYX - Equity Series Class S telah mengungkapkan total kepemilikan 44 dalam pengajuan SEC terbaru mereka. Nilai portofolio terbaru dihitung sebesar $ 62,895,547 USD. Aset yang Dikelola (AUM) sebenarnya adalah nilai ini ditambah kas (yang tidak diungkapkan). Aset-aset utama EXEYX - Equity Series Class S adalah Microsoft Corporation (US:MSFT) , NVIDIA Corporation (US:NVDA) , Alphabet Inc. (US:GOOGL) , ServiceNow, Inc. (US:NOW) , and Mastercard Incorporated (US:MA) . Posisi baru EXEYX - Equity Series Class S meliputi: Amphenol Corporation (US:APH) , Workday, Inc. (US:WDAY) , Chipotle Mexican Grill, Inc. (US:CMG) , Danaher Corporation (US:DHR) , and .
Peningkatan Tertinggi Kuartal Ini
Kami menggunakan perubahan dalam alokasi portofolio karena ini adalah metrik yang paling bermakna. Perubahan dapat disebabkan oleh perdagangan atau perubahan harga saham.
| Keamanan | Saham (MM) |
Nilai (Juta Dolar AS) |
Portfolio % | ΔPorsyento ng Portfolio |
|---|---|---|---|---|
| 0.02 | 1.46 | 2.3161 | 2.3161 | |
| 0.01 | 1.29 | 2.0551 | 2.0551 | |
| 0.03 | 1.27 | 2.0193 | 2.0193 | |
| 0.00 | 0.98 | 1.5552 | 1.5552 | |
| 0.03 | 3.19 | 5.0758 | 1.5415 | |
| 0.01 | 2.18 | 3.4652 | 1.2465 | |
| 0.02 | 1.98 | 3.1461 | 1.0406 | |
| 0.01 | 1.19 | 1.8873 | 1.0037 | |
| 0.02 | 1.27 | 2.0271 | 0.9813 | |
| 0.00 | 2.53 | 4.0251 | 0.9415 |
Penurunan Tertinggi Kuartal Ini
Kami menggunakan perubahan dalam alokasi portofolio karena ini adalah metrik yang paling bermakna. Perubahan dapat disebabkan oleh perdagangan atau perubahan harga saham.
| Keamanan | Saham (MM) |
Nilai (Juta Dolar AS) |
Portfolio % | ΔPorsyento ng Portfolio |
|---|---|---|---|---|
| 0.00 | 0.00 | -2.1425 | ||
| 0.00 | 2.11 | 3.3520 | -2.0028 | |
| 0.00 | 0.00 | -1.9254 | ||
| 0.01 | 0.94 | 1.4915 | -1.8714 | |
| 0.00 | 0.69 | 1.0975 | -1.2462 | |
| 1.61 | 1.61 | 2.5625 | -1.2305 | |
| 0.01 | 1.87 | 2.9800 | -0.5472 | |
| 0.00 | 1.43 | 2.2827 | -0.4552 | |
| 0.01 | 2.37 | 3.7696 | -0.4124 | |
| 0.01 | 1.07 | 1.6968 | -0.3920 |
Pengajuan 13F dan Dana
Formulir ini diajukan pada 2025-06-25 untuk periode pelaporan 2025-04-30. Klik ikon tautan untuk melihat riwayat transaksi selengkapnya.
Tingkatkan ke versi premium untuk membuka data premium dan ekspor ke Excel. ![]() .
.
| Keamanan | Ketik | Harga Saham Rata-rata | Saham (MM) |
ΔSaham (%) |
ΔSaham (%) |
Nilai ($MM) |
Portpolyo (%) |
ΔPortofolio (%) |
|
|---|---|---|---|---|---|---|---|---|---|
| MSFT / Microsoft Corporation | 0.01 | 3.35 | 3.31 | -1.58 | 5.2607 | 0.6596 | |||
| NVDA / NVIDIA Corporation | 0.03 | 36.28 | 3.19 | 23.61 | 5.0758 | 1.5415 | |||
| GOOGL / Alphabet Inc. | 0.02 | 11.07 | 2.99 | -13.57 | 4.7559 | 0.0204 | |||
| NOW / ServiceNow, Inc. | 0.00 | 19.82 | 2.53 | 12.36 | 4.0251 | 0.9415 | |||
| MA / Mastercard Incorporated | 0.00 | -14.20 | 2.46 | -15.36 | 3.9229 | -0.0655 | |||
| AMZN / Amazon.com, Inc. | 0.01 | 0.00 | 2.37 | -22.41 | 3.7696 | -0.4124 | |||
| CDNS / Cadence Design Systems, Inc. | 0.01 | 34.39 | 2.18 | 34.47 | 3.4652 | 1.2465 | |||
| META / Meta Platforms, Inc. | 0.00 | -32.36 | 2.11 | -46.14 | 3.3520 | -2.0028 | |||
| TRU / TransUnion | 0.02 | 53.87 | 1.98 | 28.65 | 3.1461 | 1.0406 | |||
| V / Visa Inc. | 0.01 | -28.05 | 1.87 | -27.27 | 2.9800 | -0.5472 | |||
| CBRE / CBRE Group, Inc. | 0.01 | 19.17 | 1.71 | 0.59 | 2.7166 | 0.3920 | |||
| CPRT / Copart, Inc. | 0.03 | -15.43 | 1.71 | -10.92 | 2.7150 | 0.0920 | |||
| DGCXX / Dreyfus Government Cash Management Funds - Dreyfus Government Cash Management Fund Institutional Shares | 1.61 | -41.85 | 1.61 | -41.87 | 2.5625 | -1.2305 | |||
| LHX / L3Harris Technologies, Inc. | 0.01 | 12.86 | 1.57 | 17.13 | 2.4931 | 0.6608 | |||
| APH / Amphenol Corporation | 0.02 | 1.46 | 2.3161 | 2.3161 | |||||
| TMO / Thermo Fisher Scientific Inc. | 0.00 | 0.00 | 1.43 | -28.23 | 2.2827 | -0.4552 | |||
| KO / The Coca-Cola Company | 0.02 | -12.70 | 1.40 | -0.21 | 2.2270 | 0.3057 | |||
| BLK / BlackRock, Inc. | 0.00 | 0.00 | 1.32 | -14.99 | 2.1028 | -0.0265 | |||
| WDAY / Workday, Inc. | 0.01 | 1.29 | 2.0551 | 2.0551 | |||||
| ROL / Rollins, Inc. | 0.02 | 44.57 | 1.27 | 66.84 | 2.0271 | 0.9813 | |||
| CMG / Chipotle Mexican Grill, Inc. | 0.03 | 1.27 | 2.0193 | 2.0193 | |||||
| CSX / CSX Corporation | 0.04 | 0.00 | 1.22 | -14.59 | 1.9388 | -0.0155 | |||
| CDW / CDW Corporation | 0.01 | 120.71 | 1.19 | 108.99 | 1.8873 | 1.0037 | |||
| NDAQ / Nasdaq, Inc. | 0.01 | 49.66 | 1.13 | 38.51 | 1.8048 | 0.6832 | |||
| VRTX / Vertex Pharmaceuticals Incorporated | 0.00 | -27.29 | 1.11 | -19.74 | 1.7736 | -0.1291 | |||
| SHW / The Sherwin-Williams Company | 0.00 | 32.84 | 1.11 | 30.98 | 1.7700 | 0.6060 | |||
| FI / Fiserv, Inc. | 0.01 | -18.15 | 1.07 | -30.05 | 1.6968 | -0.3920 | |||
| ISRG / Intuitive Surgical, Inc. | 0.00 | -13.90 | 1.01 | -22.38 | 1.6075 | -0.1743 | |||
| JPM / JPMorgan Chase & Co. | 0.00 | -13.51 | 0.98 | -20.83 | 1.5559 | -0.1361 | |||
| DHR / Danaher Corporation | 0.00 | 0.98 | 1.5552 | 1.5552 | |||||
| HEIA / Heico Corp. - Class A | 0.00 | 18.93 | 0.97 | 25.55 | 1.5412 | 0.4845 | |||
| EXR / Extra Space Storage Inc. | 0.01 | -21.47 | 0.97 | -25.25 | 1.5362 | -0.2337 | |||
| NSC / Norfolk Southern Corporation | 0.00 | 0.00 | 0.96 | -12.21 | 1.5220 | 0.0291 | |||
| MCO / Moody's Corporation | 0.00 | -7.56 | 0.94 | -16.13 | 1.4987 | -0.0396 | |||
| EPAM / EPAM Systems, Inc. | 0.01 | -38.21 | 0.94 | -61.82 | 1.4915 | -1.8714 | |||
| SNPS / Synopsys, Inc. | 0.00 | 0.00 | 0.92 | -12.69 | 1.4685 | 0.0214 | |||
| JNJ / Johnson & Johnson | 0.01 | -11.33 | 0.92 | -8.89 | 1.4684 | 0.0809 | |||
| UNP / Union Pacific Corporation | 0.00 | -16.92 | 0.89 | -27.73 | 1.4242 | -0.2713 | |||
| SPGI / S&P Global Inc. | 0.00 | 0.00 | 0.86 | -4.12 | 1.3730 | 0.1406 | |||
| MAS / Masco Corporation | 0.01 | 0.00 | 0.85 | -23.60 | 1.3512 | -0.1702 | |||
| CBOE / Cboe Global Markets, Inc. | 0.00 | 0.00 | 0.79 | 8.49 | 1.2614 | 0.2611 | |||
| ICE / Intercontinental Exchange, Inc. | 0.00 | 0.00 | 0.75 | 5.08 | 1.1870 | 0.2148 | |||
| CRM / Salesforce, Inc. | 0.00 | -48.74 | 0.69 | -59.71 | 1.0975 | -1.2462 | |||
| MSCI / MSCI Inc. | 0.00 | 0.00 | 0.65 | -8.77 | 1.0281 | 0.0593 | |||
| ALB / Albemarle Corporation | 0.00 | -100.00 | 0.00 | -100.00 | -2.1425 | ||||
| AMAT / Applied Materials, Inc. | 0.00 | -100.00 | 0.00 | -100.00 | -1.9254 |