Mga Batayang Estadistika
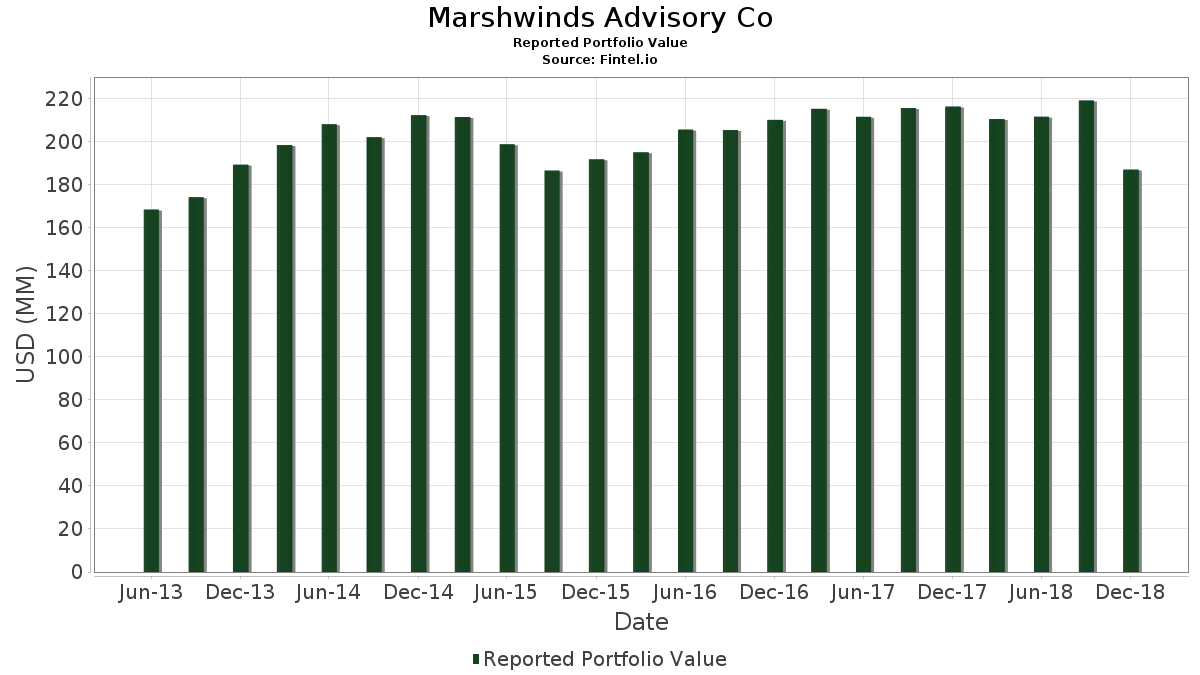
| Nilai Portofolio | $ 186,822,000 |
| Posisi Saat Ini | 124 |
Kepemilikan Terbaru, Kinerja, AUM (dari 13F, 13D)
Marshwinds Advisory Co telah mengungkapkan total kepemilikan 124 dalam pengajuan SEC terbaru mereka. Nilai portofolio terbaru dihitung sebesar $ 186,822,000 USD. Aset yang Dikelola (AUM) sebenarnya adalah nilai ini ditambah kas (yang tidak diungkapkan). Aset-aset utama Marshwinds Advisory Co adalah Microsoft Corporation (US:MSFT) , The Coca-Cola Company (US:KO) , Intuit Inc. (US:INTU) , Pfizer Inc. (US:PFE) , and Amgen Inc. (US:AMGN) .
Peningkatan Tertinggi Kuartal Ini
Kami menggunakan perubahan dalam alokasi portofolio karena ini adalah metrik yang paling bermakna. Perubahan dapat disebabkan oleh perdagangan atau perubahan harga saham.
| Keamanan | Saham (MM) |
Nilai (Juta Dolar AS) |
Portfolio % | ΔPorsyento ng Portfolio |
|---|---|---|---|---|
| 0.04 | 2.65 | 1.4158 | 1.4158 | |
| 0.14 | 6.84 | 3.6596 | 0.5438 | |
| 0.03 | 0.94 | 0.5042 | 0.5042 | |
| 0.04 | 4.52 | 2.4178 | 0.4728 | |
| 0.02 | 0.81 | 0.4330 | 0.4330 | |
| 0.06 | 4.51 | 2.4130 | 0.4305 | |
| 0.04 | 0.71 | 0.3822 | 0.3822 | |
| 0.04 | 3.71 | 1.9864 | 0.3561 | |
| 0.06 | 0.65 | 0.3485 | 0.3485 | |
| 0.06 | 0.62 | 0.3297 | 0.3297 |
Penurunan Tertinggi Kuartal Ini
Kami menggunakan perubahan dalam alokasi portofolio karena ini adalah metrik yang paling bermakna. Perubahan dapat disebabkan oleh perdagangan atau perubahan harga saham.
| Keamanan | Saham (MM) |
Nilai (Juta Dolar AS) |
Portfolio % | ΔPorsyento ng Portfolio |
|---|---|---|---|---|
| 0.01 | 0.27 | 0.1445 | -0.3516 | |
| 0.02 | 2.81 | 1.5046 | -0.3440 | |
| 0.02 | 2.48 | 1.3259 | -0.3067 | |
| 0.18 | 1.34 | 0.7173 | -0.2543 | |
| 0.06 | 3.43 | 1.8370 | -0.2354 | |
| 0.01 | 2.79 | 1.4955 | -0.2234 | |
| 0.05 | 3.23 | 1.7300 | -0.1840 | |
| 0.05 | 3.13 | 1.6738 | -0.1603 | |
| 0.02 | 2.27 | 1.2145 | -0.1499 | |
| 0.01 | 2.23 | 1.1926 | -0.1472 |
Pengajuan 13F dan Dana
Formulir ini diajukan pada 2019-01-07 untuk periode pelaporan 2018-12-31. Klik ikon tautan untuk melihat riwayat transaksi selengkapnya.
Tingkatkan ke versi premium untuk membuka data premium dan ekspor ke Excel. ![]() .
.
| Keamanan | Ketik | Harga Saham Rata-rata | Saham (MM) |
ΔSaham (%) |
ΔSaham (%) |
Nilai ($MM) |
Portpolyo (%) |
ΔPortofolio (%) |
|
|---|---|---|---|---|---|---|---|---|---|
| MSFT / Microsoft Corporation | 0.07 | -5.01 | 7.19 | -15.65 | 3.8464 | -0.0450 | |||
| KO / The Coca-Cola Company | 0.14 | -2.22 | 6.84 | 0.23 | 3.6596 | 0.5438 | |||
| INTU / Intuit Inc. | 0.03 | 0.00 | 5.32 | -13.43 | 2.8498 | 0.0405 | |||
| PFE / Pfizer Inc. | 0.12 | -3.53 | 5.06 | -4.46 | 2.7074 | 0.2891 | |||
| AMGN / Amgen Inc. | 0.03 | -3.81 | 4.95 | -9.67 | 2.6512 | 0.1466 | |||
| LLY / Eli Lilly and Company | 0.04 | -1.64 | 4.52 | 6.08 | 2.4178 | 0.4728 | |||
| MRK / Merck & Co., Inc. | 0.06 | -3.57 | 4.51 | 3.87 | 2.4130 | 0.4305 | |||
| ORCL / Oracle Corporation | 0.10 | -5.05 | 4.47 | -16.84 | 2.3921 | -0.0627 | |||
| ABT / Abbott Laboratories | 0.06 | -3.88 | 4.19 | -5.24 | 2.2438 | 0.2230 | |||
| CSCO / Cisco Systems, Inc. | 0.10 | -2.69 | 4.18 | -13.34 | 2.2385 | 0.0340 | |||
| MDLZ / Mondelez International, Inc. | 0.10 | -4.42 | 4.00 | -10.94 | 2.1405 | 0.0895 | |||
| INTC / Intel Corporation | 0.08 | -2.88 | 3.92 | -3.62 | 2.0966 | 0.2402 | |||
| MMM / 3M Company | 0.02 | -0.50 | 3.74 | -10.02 | 2.0035 | 0.1032 | |||
| PG / The Procter & Gamble Company | 0.04 | -5.84 | 3.71 | 3.98 | 1.9864 | 0.3561 | |||
| EMR / Emerson Electric Co. | 0.06 | -3.03 | 3.43 | -24.36 | 1.8370 | -0.2354 | |||
| DOW / Dow Inc. | 0.06 | -4.97 | 3.34 | -20.98 | 1.7883 | -0.1430 | |||
| T / AT&T Inc. | 0.12 | -2.95 | 3.33 | -17.52 | 1.7819 | -0.0617 | |||
| SO / The Southern Company | 0.08 | -4.55 | 3.30 | -3.85 | 1.7648 | 0.1984 | |||
| XOM / Exxon Mobil Corporation | 0.05 | -3.84 | 3.23 | -22.86 | 1.7300 | -0.1840 | |||
| COP / ConocoPhillips | 0.05 | -3.31 | 3.13 | -22.12 | 1.6738 | -0.1603 | |||
| HD / The Home Depot, Inc. | 0.02 | -4.67 | 2.85 | -20.92 | 1.5239 | -0.1206 | |||
| RTN / Raytheon Co. | 0.02 | -6.38 | 2.81 | -30.54 | 1.5046 | -0.3440 | |||
| ABBV / AbbVie Inc. | 0.03 | -5.22 | 2.80 | -7.63 | 1.4971 | 0.1140 | |||
| NOC / Northrop Grumman Corporation | 0.01 | -3.80 | 2.79 | -25.75 | 1.4955 | -0.2234 | |||
| ESE / ESCO Technologies Inc. | 0.04 | -3.42 | 2.65 | -6.37 | 1.4158 | 1.4158 | |||
| ADSK / Autodesk, Inc. | 0.02 | -3.23 | 2.60 | -20.29 | 1.3922 | -0.0983 | |||
| IBM / International Business Machines Corporation | 0.02 | -7.80 | 2.48 | -30.69 | 1.3259 | -0.3067 | |||
| TR / Tootsie Roll Industries, Inc. | 0.07 | -3.86 | 2.47 | 9.78 | 1.3216 | 0.2942 | |||
| DUKH / Northern Lights Fund Trust - Ocean Park High Income ETF | 0.03 | -3.59 | 2.43 | 3.98 | 1.2996 | 0.2330 | |||
| VZ / Verizon Communications Inc. | 0.04 | -5.85 | 2.43 | -0.86 | 1.2991 | 0.1809 | |||
| JNJ / Johnson & Johnson | 0.02 | -0.27 | 2.33 | -6.83 | 1.2477 | 0.1048 | |||
| META / Meta Platforms, Inc. | 0.02 | -4.68 | 2.27 | -24.04 | 1.2145 | -0.1499 | |||
| BMY / Bristol-Myers Squibb Company | 0.04 | -2.38 | 2.24 | -18.27 | 1.1974 | -0.0529 | |||
| GD / General Dynamics Corporation | 0.01 | -1.05 | 2.23 | -24.04 | 1.1926 | -0.1472 | |||
| CVX / Chevron Corporation | 0.02 | -5.48 | 2.22 | -15.93 | 1.1894 | -0.0179 | |||
| SYK / Stryker Corporation | 0.01 | 0.00 | 2.16 | -11.79 | 1.1578 | 0.0377 | |||
| ED / Consolidated Edison, Inc. | 0.03 | -6.08 | 2.04 | -5.74 | 1.0909 | 0.1033 | |||
| CAT / Caterpillar Inc. | 0.02 | 0.01 | 1.92 | -16.69 | 1.0261 | -0.0250 | |||
| PSX / Phillips 66 | 0.02 | -2.12 | 1.87 | -25.17 | 0.9993 | -0.1404 | |||
| KHC / The Kraft Heinz Company | 0.04 | -2.81 | 1.86 | -24.09 | 0.9951 | -0.1236 | |||
| DIS / The Walt Disney Company | 0.02 | -3.45 | 1.84 | -9.50 | 0.9844 | 0.0561 | |||
| PEP / PepsiCo, Inc. | 0.02 | -6.82 | 1.74 | -7.90 | 0.9292 | 0.0682 | |||
| ADP / Automatic Data Processing, Inc. | 0.01 | 0.00 | 1.67 | -12.96 | 0.8918 | 0.0174 | |||
| ADI / Analog Devices, Inc. | 0.02 | -1.01 | 1.47 | -8.10 | 0.7890 | 0.0563 | |||
| MDT / Medtronic plc | 0.02 | 0.00 | 1.47 | -7.54 | 0.7874 | 0.0606 | |||
| AXP / American Express Company | 0.01 | 0.01 | 1.36 | -10.49 | 0.7306 | 0.0340 | |||
| DE / Deere & Company | 0.01 | 0.00 | 1.35 | -0.81 | 0.7248 | 0.1012 | |||
| FLO / Flowers Foods, Inc. | 0.07 | -1.35 | 1.34 | -2.33 | 0.7189 | 0.0908 | |||
| GE / General Electric Company | 0.18 | -6.07 | 1.34 | -37.00 | 0.7173 | -0.2543 | |||
| HON / Honeywell International Inc. | 0.01 | -5.13 | 1.28 | -24.65 | 0.6873 | -0.0911 | |||
| ETN / Eaton Corporation plc | 0.02 | -0.27 | 1.28 | -21.03 | 0.6873 | -0.0555 | |||
| HSY / The Hershey Company | 0.01 | -2.85 | 1.28 | 2.07 | 0.6857 | 0.1124 | |||
| CPB / The Campbell's Company | 0.04 | 43.13 | 1.25 | 28.88 | 0.6712 | 0.2268 | |||
| SBDKP / Stanley Black & Decker Inc - 4.75% PRF PERPETUAL USD 100 | 0.01 | 0.00 | 1.25 | -18.25 | 0.6712 | -0.0295 | |||
| CSX / CSX Corporation | 0.02 | -11.51 | 1.22 | -25.78 | 0.6520 | -0.0976 | |||
| DTE / DTE Energy Company | 0.01 | -7.68 | 1.16 | -6.67 | 0.6214 | 0.0532 | |||
| IR / Ingersoll Rand Inc. | 0.01 | -7.88 | 1.12 | -17.83 | 0.5995 | -0.0231 | |||
| VFC / V.F. Corporation | 0.02 | 0.00 | 1.09 | -23.62 | 0.5834 | -0.0684 | |||
| SU / Suncor Energy Inc. | 0.03 | -2.32 | 0.94 | -29.33 | 0.5042 | 0.5042 | |||
| EVRG / Evergy, Inc. | 0.02 | -3.21 | 0.92 | 0.00 | 0.4914 | 0.0720 | |||
| WY / Weyerhaeuser Company | 0.04 | -2.42 | 0.88 | -33.89 | 0.4689 | -0.1364 | |||
| SLB / Schlumberger Limited | 0.02 | 4.55 | 0.81 | -38.10 | 0.4330 | 0.4330 | |||
| PPG / PPG Industries, Inc. | 0.01 | -6.06 | 0.79 | -12.00 | 0.4239 | 0.0128 | |||
| CMC / Commercial Metals Company | 0.04 | -8.33 | 0.71 | -28.46 | 0.3822 | 0.3822 | |||
| WFC / Wells Fargo & Company | 0.01 | 0.07 | 0.65 | -12.21 | 0.3501 | 0.0098 | |||
| GEOS / Geospace Technologies Corporation | 0.06 | -3.37 | 0.65 | -27.26 | 0.3485 | 0.3485 | |||
| ADM / Archer-Daniels-Midland Company | 0.02 | 0.00 | 0.64 | -18.49 | 0.3420 | -0.0161 | |||
| TFX / Teleflex Incorporated | 0.00 | 0.00 | 0.62 | -2.97 | 0.3319 | 0.0400 | |||
| RYAM / Rayonier Advanced Materials Inc. | 0.06 | -4.69 | 0.62 | -44.95 | 0.3297 | 0.3297 | |||
| MDP / Meredith Holdings Corp | 0.01 | 2.16 | 0.61 | 3.89 | 0.3287 | 0.3287 | |||
| SNA / Snap-on Incorporated | 0.00 | -7.65 | 0.61 | -26.90 | 0.3287 | -0.0551 | |||
| BRK.B / Berkshire Hathaway Inc. | 0.00 | -1.67 | 0.60 | -6.23 | 0.3222 | 0.0290 | |||
| WMBAX / Ivy Funds - Delaware Ivy Municipal Bond Fd USD Cls A | 0.05 | 0.00 | 0.60 | 0.00 | 0.3190 | 0.0468 | |||
| DGX / Quest Diagnostics Incorporated | 0.01 | 0.00 | 0.59 | -22.85 | 0.3163 | -0.0336 | |||
| CAH / Cardinal Health, Inc. | 0.01 | 0.00 | 0.59 | -17.46 | 0.3137 | -0.0107 | |||
| MUR / Murphy Oil Corporation | 0.02 | -1.25 | 0.56 | -30.71 | 0.2971 | 0.2971 | |||
| Fidelity Natl Financial (FNF G / (316326107) | 0.02 | 0.55 | 0.0000 | ||||||
| UVV / Universal Corporation | 0.01 | 2.16 | 0.55 | -14.97 | 0.2949 | -0.0011 | |||
| FIS / Fidelity National Information Services, Inc. | 0.01 | -2.77 | 0.54 | -8.63 | 0.2890 | 0.0191 | |||
| AEE / Ameren Corporation | 0.01 | 0.00 | 0.53 | 3.09 | 0.2853 | 0.0491 | |||
| TSS / Total System Services, Inc. | 0.01 | -28.62 | 0.53 | -41.28 | 0.2848 | -0.1291 | |||
| MAS / Masco Corporation | 0.02 | 0.00 | 0.53 | -20.09 | 0.2810 | -0.0191 | |||
| BKR / Baker Hughes Company | 0.02 | 2.32 | 0.52 | -34.99 | 0.2794 | -0.0874 | |||
| PKE / Park Aerospace Corp. | 0.03 | -2.70 | 0.52 | -9.72 | 0.2783 | 0.0152 | |||
| 872307903 / TCF Financial Corporation | 0.01 | -3.94 | 0.52 | -13.30 | 0.2757 | 0.0043 | |||
| NSC / Norfolk Southern Corporation | 0.00 | -6.21 | 0.51 | -22.32 | 0.2719 | -0.0268 | |||
| RTX / RTX Corporation | 0.00 | 7.39 | 0.51 | -18.26 | 0.2708 | -0.0119 | |||
| NWL / Newell Brands Inc. | 0.03 | -3.84 | 0.49 | -12.05 | 0.2617 | 0.0078 | |||
| LW / Lamb Weston Holdings, Inc. | 0.01 | -1.73 | 0.48 | 8.58 | 0.2575 | 0.2575 | |||
| WPC / W. P. Carey Inc. | 0.01 | 0.00 | 0.47 | 1.51 | 0.2516 | 0.2516 | |||
| KMB / Kimberly-Clark Corporation | 0.00 | -16.40 | 0.47 | -16.06 | 0.2489 | -0.0042 | |||
| CAG / Conagra Brands, Inc. | 0.02 | -1.59 | 0.46 | -38.18 | 0.2478 | -0.0943 | |||
| GIFI / Gulf Island Fabrication, Inc. | 0.06 | -4.20 | 0.41 | -30.41 | 0.2205 | 0.2205 | |||
| PAYX / Paychex, Inc. | 0.01 | 0.02 | 0.40 | -11.50 | 0.2141 | 0.0076 | |||
| JPM / JPMorgan Chase & Co. | 0.00 | 0.19 | 0.36 | -13.22 | 0.1932 | 0.0032 | |||
| US0549371070 / BB&T Corp. | 0.01 | 0.18 | 0.35 | -10.59 | 0.1852 | 0.0084 | |||
| TMO / Thermo Fisher Scientific Inc. | 0.00 | 0.00 | 0.34 | -8.20 | 0.1799 | 0.0127 | |||
| AAPL / Apple Inc. | 0.00 | 14.15 | 0.33 | -20.33 | 0.1782 | -0.0127 | |||
| Glencore Xstrata PLC (2.10) / (063082236) | 0.09 | 0.33 | 0.0000 | ||||||
| HWKN / Hawkins, Inc. | 0.01 | -2.49 | 0.32 | -3.90 | 0.1713 | 0.1713 | |||
| IP / International Paper Company | 0.01 | 0.00 | 0.32 | -17.92 | 0.1691 | -0.0067 | |||
| WBA / Walgreens Boots Alliance, Inc. | 0.00 | 0.02 | 0.31 | -6.42 | 0.1638 | 0.0144 | |||
| NSRGY / Nestlé S.A. - Depositary Receipt (Common Stock) | 0.00 | 0.00 | 0.30 | -2.60 | 0.1606 | 0.0199 | |||
| LUMN / Lumen Technologies, Inc. | 0.02 | -0.65 | 0.27 | -28.87 | 0.1451 | -0.0290 | |||
| BAC / Bank of America Corporation | 0.01 | -70.22 | 0.27 | -75.14 | 0.1445 | -0.3516 | |||
| KEY / KeyCorp | 0.02 | 0.00 | 0.27 | -25.69 | 0.1440 | -0.0214 | |||
| TAP / Molson Coors Beverage Company | 0.00 | 0.00 | 0.26 | -8.80 | 0.1386 | 0.0089 | |||
| BKI / Black Knight Inc - Class A | 0.01 | 0.00 | 0.26 | -13.18 | 0.1376 | 0.1376 | |||
| SYY / Sysco Corporation | 0.00 | -2.38 | 0.26 | -16.56 | 0.1376 | -0.0031 | |||
| RF / Regions Financial Corporation | 0.02 | -2.77 | 0.25 | -29.05 | 0.1360 | -0.0276 | |||
| SNV / Synovus Financial Corp. | 0.01 | -7.70 | 0.25 | -35.55 | 0.1349 | -0.0437 | |||
| GIS / General Mills, Inc. | 0.01 | 0.00 | 0.24 | -9.51 | 0.1274 | 0.0073 | |||
| RAVN / Raven Industries, Inc. | 0.01 | -7.55 | 0.23 | -26.73 | 0.1247 | 0.1247 | |||
| SEE / Sealed Air Corporation | 0.01 | -6.97 | 0.23 | -19.10 | 0.1247 | -0.0068 | |||
| HUBB / Hubbell Incorporated | 0.00 | 7.23 | 0.22 | -20.22 | 0.1183 | -0.0082 | |||
| PM / Philip Morris International Inc. | 0.00 | -12.89 | 0.22 | -28.80 | 0.1178 | -0.0234 | |||
| STI / Solidion Technology, Inc. | 0.00 | 0.00 | 0.22 | -24.39 | 0.1162 | -0.0149 | |||
| RECN / Resources Connection, Inc. | 0.01 | -11.11 | 0.21 | -23.91 | 0.1124 | 0.1124 | |||
| BAX / Baxter International Inc. | 0.00 | -13.10 | 0.21 | -25.81 | 0.1108 | -0.0166 | |||
| LEE / Lee Enterprises, Incorporated | 0.08 | 0.00 | 0.17 | -20.10 | 0.0894 | -0.0061 | |||
| GCI / Gannett Co., Inc. | 0.01 | -9.93 | 0.11 | -18.71 | 0.0605 | -0.0030 | |||
| BRSLF / Barsele Minerals Corp. | 0.10 | 0.00 | 0.03 | -53.85 | 0.0161 | 0.0161 | |||
| ORMNF / Orex Minerals Inc. | 0.10 | 0.00 | 0.01 | -33.33 | 0.0032 | 0.0032 | |||
| 828334103 / Silver Viper Minerals Corp. | 0.10 | 0.00 | 0.00 | 0.00 | 0.0005 | 0.0001 | |||
| CMP / Compass Minerals International, Inc. | 0.00 | -100.00 | 0.00 | -100.00 | 0.0000 | ||||
| FLS / Flowserve Corporation | 0.00 | -100.00 | 0.00 | -100.00 | -0.1124 | ||||
| PNR / Pentair plc | 0.00 | -100.00 | 0.00 | -100.00 | -0.0914 | ||||
| WMT / Walmart Inc. | 0.00 | -100.00 | 0.00 | -100.00 | -0.1421 | ||||
| BHP / BHP Group Limited - Depositary Receipt (Common Stock) | 0.00 | -100.00 | 0.00 | -100.00 | 0.0000 |