Mga Batayang Estadistika
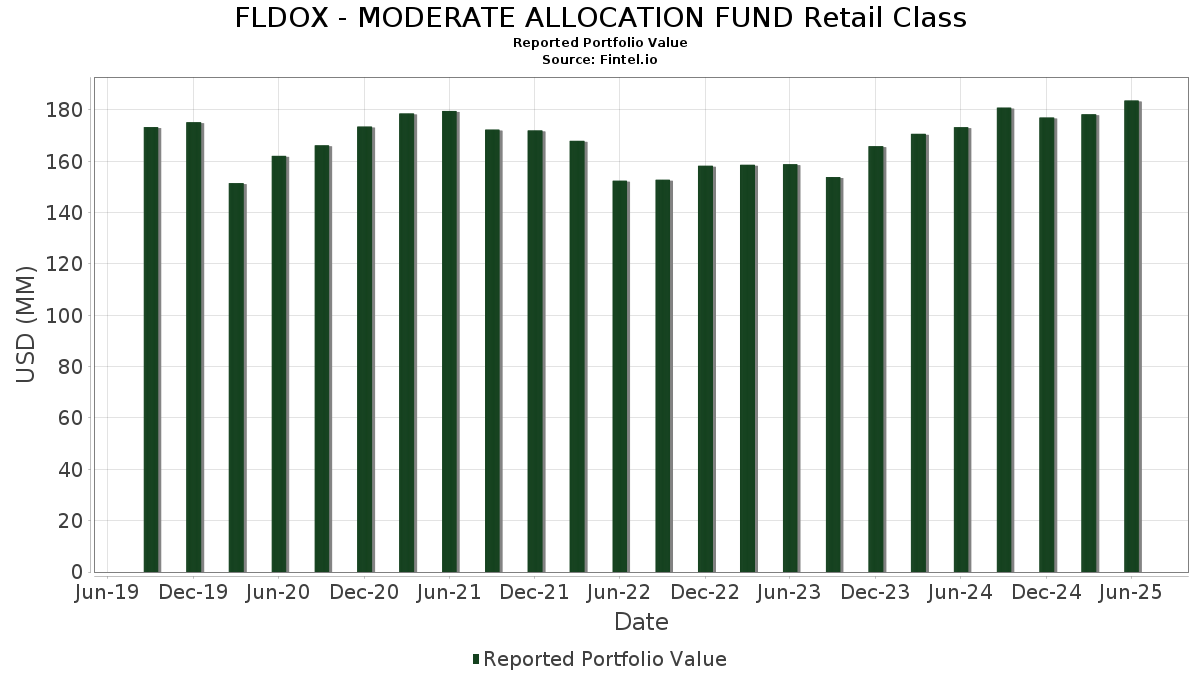
| Nilai Portofolio | $ 183,628,638 |
| Posisi Saat Ini | 170 |
Kepemilikan Terbaru, Kinerja, AUM (dari 13F, 13D)
FLDOX - MODERATE ALLOCATION FUND Retail Class telah mengungkapkan total kepemilikan 170 dalam pengajuan SEC terbaru mereka. Nilai portofolio terbaru dihitung sebesar $ 183,628,638 USD. Aset yang Dikelola (AUM) sebenarnya adalah nilai ini ditambah kas (yang tidak diungkapkan). Aset-aset utama FLDOX - MODERATE ALLOCATION FUND Retail Class adalah F/A-TTL BND-Z (US:US31617L7982) , Baird Core Plus Bond Inst (US:US0570718702) , iShares Trust - iShares 7-10 Year Treasury Bond ETF (US:IEF) , iShares Trust - iShares J.P. Morgan USD Emerging Markets Bond ETF (US:EMB) , and BrandywineGLOBAL High Yield Fund (US:US52472T7182) . Posisi baru FLDOX - MODERATE ALLOCATION FUND Retail Class meliputi: Morningstar, Inc. (US:MORN) , Crown Holdings, Inc. (US:CCK) , VeriSign, Inc. (US:VRSN) , Kodiak Gas Services, Inc. (US:KGS) , and Jack Henry & Associates, Inc. (US:JKHY) .
Peningkatan Tertinggi Kuartal Ini
Kami menggunakan perubahan dalam alokasi portofolio karena ini adalah metrik yang paling bermakna. Perubahan dapat disebabkan oleh perdagangan atau perubahan harga saham.
| Keamanan | Saham (MM) |
Nilai (Juta Dolar AS) |
Portfolio % | ΔPorsyento ng Portfolio |
|---|---|---|---|---|
| 0.14 | 13.32 | 7.2110 | 7.2110 | |
| 0.03 | 4.68 | 2.5334 | 0.7535 | |
| 0.01 | 6.74 | 3.6464 | 0.5205 | |
| 0.00 | 0.78 | 0.4247 | 0.4247 | |
| 0.00 | 0.78 | 0.4246 | 0.4227 | |
| 0.00 | 0.70 | 0.3768 | 0.3768 | |
| 0.00 | 1.13 | 0.6124 | 0.2912 | |
| 0.00 | 0.53 | 0.2853 | 0.2853 | |
| 0.00 | 0.51 | 0.2738 | 0.2667 | |
| 0.02 | 4.46 | 2.4123 | 0.2583 |
Penurunan Tertinggi Kuartal Ini
Kami menggunakan perubahan dalam alokasi portofolio karena ini adalah metrik yang paling bermakna. Perubahan dapat disebabkan oleh perdagangan atau perubahan harga saham.
| Keamanan | Saham (MM) |
Nilai (Juta Dolar AS) |
Portfolio % | ΔPorsyento ng Portfolio |
|---|---|---|---|---|
| 22.49 | 12.1719 | -1.9367 | ||
| 0.01 | 1.95 | 1.0554 | -1.2521 | |
| 0.01 | 5.20 | 2.8144 | -0.8300 | |
| 0.00 | 0.36 | 0.1931 | -0.4157 | |
| 0.00 | 0.11 | 0.0596 | -0.2736 | |
| 2.06 | 19.77 | 10.7002 | -0.2710 | |
| 1.89 | 19.32 | 10.4573 | -0.2677 | |
| 0.10 | 8.97 | 4.8521 | -0.2420 | |
| 0.00 | 0.25 | 0.1340 | -0.1843 | |
| 0.00 | 0.10 | 0.0560 | -0.1732 |
Pengajuan 13F dan Dana
Formulir ini diajukan pada 2025-08-13 untuk periode pelaporan 2025-06-30. Klik ikon tautan untuk melihat riwayat transaksi selengkapnya.
Tingkatkan ke versi premium untuk membuka data premium dan ekspor ke Excel. ![]() .
.
| Keamanan | Ketik | Harga Saham Rata-rata | Saham (MM) |
ΔSaham (%) |
ΔSaham (%) |
Nilai ($MM) |
Portpolyo (%) |
ΔPortofolio (%) |
|
|---|---|---|---|---|---|---|---|---|---|
| Meeder Government / (58510R614) | 22.49 | -11.17 | 12.1719 | -1.9367 | |||||
| US31617L7982 / F/A-TTL BND-Z | 2.06 | 0.00 | 19.77 | 0.42 | 10.7002 | -0.2710 | |||
| US0570718702 / Baird Core Plus Bond Inst | 1.89 | 0.00 | 19.32 | 0.39 | 10.4573 | -0.2677 | |||
| IEF / iShares Trust - iShares 7-10 Year Treasury Bond ETF | 0.14 | 13.32 | 7.2110 | 7.2110 | |||||
| EMB / iShares Trust - iShares J.P. Morgan USD Emerging Markets Bond ETF | 0.10 | -4.08 | 8.97 | -1.94 | 4.8521 | -0.2420 | |||
| US52472T7182 / BrandywineGLOBAL High Yield Fund | 0.85 | 0.00 | 8.64 | -0.09 | 4.6781 | -0.1433 | |||
| DODIX / Dodge & Cox Funds - Dodge & Cox Income Fund | 0.65 | 0.00 | 8.22 | 0.32 | 4.4471 | -0.1173 | |||
| MSFT / Microsoft Corporation | 0.01 | -9.35 | 6.74 | 20.11 | 3.6464 | 0.5205 | |||
| Fidelity Adv Short / (US31641Q7896) | 0.62 | 1.51 | 5.60 | 2.53 | 3.0298 | -0.0126 | |||
| FIJEX / Frost Family of Funds - Frost Total Return Bond Fund Institutional Class | 0.57 | 0.00 | 5.50 | -0.81 | 2.9765 | -0.1134 | |||
| BRK.B / Berkshire Hathaway Inc. | 0.01 | -12.82 | 5.20 | -20.49 | 2.8144 | -0.8300 | |||
| NVDA / NVIDIA Corporation | 0.03 | 0.53 | 4.68 | 46.56 | 2.5334 | 0.7535 | |||
| AMZN / Amazon.com, Inc. | 0.02 | 0.00 | 4.46 | 15.32 | 2.4123 | 0.2583 | |||
| META / Meta Platforms, Inc. | 0.00 | -17.03 | 2.65 | 6.29 | 1.4364 | 0.0445 | |||
| GOOG / Alphabet Inc. | 0.01 | -4.10 | 2.33 | 8.88 | 1.2608 | 0.0687 | |||
| COST / Costco Wholesale Corporation | 0.00 | -6.71 | 2.33 | -2.35 | 1.2590 | -0.0685 | |||
| AAPL / Apple Inc. | 0.01 | -49.02 | 1.95 | -52.91 | 1.0554 | -1.2521 | |||
| MA / Mastercard Incorporated | 0.00 | -11.73 | 1.81 | -9.52 | 0.9771 | -0.1346 | |||
| SPG / Simon Property Group, Inc. | 0.01 | 0.00 | 1.63 | -3.21 | 0.8813 | -0.0561 | |||
| WMT / Walmart Inc. | 0.01 | 0.00 | 1.42 | 11.39 | 0.7678 | 0.0580 | |||
| BK / The Bank of New York Mellon Corporation | 0.01 | 0.00 | 1.30 | 8.64 | 0.7010 | 0.0366 | |||
| STT / State Street Corporation | 0.01 | 0.00 | 1.19 | 18.68 | 0.6434 | 0.0857 | |||
| NFLX / Netflix, Inc. | 0.00 | 36.73 | 1.13 | 96.35 | 0.6124 | 0.2912 | |||
| ORCL / Oracle Corporation | 0.00 | 12.85 | 1.00 | 76.54 | 0.5422 | 0.2259 | |||
| GILD / Gilead Sciences, Inc. | 0.01 | 0.00 | 0.95 | -1.04 | 0.5134 | -0.0208 | |||
| YUM / Yum! Brands, Inc. | 0.01 | 0.00 | 0.92 | -5.83 | 0.4983 | -0.0465 | |||
| EOG / EOG Resources, Inc. | 0.01 | 0.00 | 0.83 | -6.73 | 0.4498 | -0.0467 | |||
| LLY / Eli Lilly and Company | 0.00 | 3.33 | 0.82 | -2.49 | 0.4446 | -0.0248 | |||
| ECL / Ecolab Inc. | 0.00 | -4.88 | 0.79 | 1.16 | 0.4266 | -0.0079 | |||
| GD / General Dynamics Corporation | 0.00 | 0.78 | 0.4247 | 0.4247 | |||||
| AME / AMETEK, Inc. | 0.00 | 22,721.05 | 0.78 | 26,033.33 | 0.4246 | 0.4227 | |||
| ABBV / AbbVie Inc. | 0.00 | 69.86 | 0.74 | 50.61 | 0.4030 | 0.1273 | |||
| TXN / Texas Instruments Incorporated | 0.00 | 14.62 | 0.74 | 32.50 | 0.4018 | 0.0894 | |||
| COF / Capital One Financial Corporation | 0.00 | 98.93 | 0.71 | 137.46 | 0.3843 | 0.2174 | |||
| MORN / Morningstar, Inc. | 0.00 | 0.70 | 0.3768 | 0.3768 | |||||
| PM / Philip Morris International Inc. | 0.00 | 29.86 | 0.69 | 49.13 | 0.3717 | 0.1148 | |||
| DIS / The Walt Disney Company | 0.01 | 27.39 | 0.64 | 59.95 | 0.3483 | 0.1242 | |||
| AVGO / Broadcom Inc. | 0.00 | -23.77 | 0.64 | 25.39 | 0.3477 | 0.0624 | |||
| AMGN / Amgen Inc. | 0.00 | 18.46 | 0.64 | 6.15 | 0.3462 | 0.0104 | |||
| BLD / TopBuild Corp. | 0.00 | 12.48 | 0.59 | 19.60 | 0.3204 | 0.0441 | |||
| TT / Trane Technologies plc | 0.00 | 0.00 | 0.56 | 29.91 | 0.3011 | 0.0623 | |||
| SYF / Synchrony Financial | 0.01 | 167.09 | 0.54 | 237.11 | 0.2902 | 0.2014 | |||
| STE / STERIS plc | 0.00 | 0.53 | 0.2853 | 0.2853 | |||||
| NFG / National Fuel Gas Company | 0.01 | 1.09 | 0.53 | 8.23 | 0.2850 | 0.0136 | |||
| BPOP / Popular, Inc. | 0.00 | 178.71 | 0.52 | 232.69 | 0.2811 | 0.1941 | |||
| UAL / United Airlines Holdings, Inc. | 0.01 | 0.00 | 0.52 | 15.37 | 0.2804 | 0.0301 | |||
| PLTR / Palantir Technologies Inc. | 0.00 | 60.14 | 0.51 | 189.71 | 0.2744 | 0.1764 | |||
| NOC / Northrop Grumman Corporation | 0.00 | 3,948.00 | 0.51 | 4,108.33 | 0.2738 | 0.2667 | |||
| MPWR / Monolithic Power Systems, Inc. | 0.00 | 446.83 | 0.50 | 1,017.78 | 0.2727 | 0.2428 | |||
| MU / Micron Technology, Inc. | 0.00 | 33.54 | 0.48 | 95.90 | 0.2589 | 0.1224 | |||
| LMT / Lockheed Martin Corporation | 0.00 | 97.80 | 0.46 | 99.56 | 0.2474 | 0.1033 | |||
| ETN / Eaton Corporation plc | 0.00 | 14,022.22 | 0.45 | 45,200.00 | 0.2455 | 0.2444 | |||
| EHC / Encompass Health Corporation | 0.00 | 0.00 | 0.42 | 20.93 | 0.2256 | 0.0338 | |||
| ADBE / Adobe Inc. | 0.00 | 68.10 | 0.41 | 9.07 | 0.2217 | -0.0048 | |||
| HUBB / Hubbell Incorporated | 0.00 | 4,480.95 | 0.39 | 9,700.00 | 0.2126 | 0.2096 | |||
| UNP / Union Pacific Corporation | 0.00 | -63.44 | 0.36 | -65.87 | 0.1931 | -0.4157 | |||
| PSA / Public Storage | 0.00 | 82.11 | 0.33 | 42.61 | 0.1778 | 0.0451 | |||
| EA / Electronic Arts Inc. | 0.00 | 856.78 | 0.30 | 985.71 | 0.1646 | 0.1485 | |||
| CUBI / Customers Bancorp, Inc. | 0.01 | 723.20 | 0.30 | 2,645.45 | 0.1636 | 0.1563 | |||
| BCC / Boise Cascade Company | 0.00 | 57.44 | 0.30 | 39.53 | 0.1625 | 0.0424 | |||
| CSCO / Cisco Systems, Inc. | 0.00 | 1,218.90 | 0.30 | 1,775.00 | 0.1624 | 0.1524 | |||
| PLAB / Photronics, Inc. | 0.02 | 214.22 | 0.30 | 186.41 | 0.1597 | 0.1020 | |||
| SWKS / Skyworks Solutions, Inc. | 0.00 | 91.55 | 0.29 | 61.11 | 0.1573 | 0.0566 | |||
| JNJ / Johnson & Johnson | 0.00 | -38.04 | 0.28 | -43.06 | 0.1535 | -0.1234 | |||
| ALLE / Allegion plc | 0.00 | 0.00 | 0.28 | 10.67 | 0.1516 | 0.0103 | |||
| CCK / Crown Holdings, Inc. | 0.00 | 0.27 | 0.1469 | 0.1469 | |||||
| CAH / Cardinal Health, Inc. | 0.00 | 0.00 | 0.26 | 21.66 | 0.1434 | 0.0223 | |||
| Mini MSCI EAFE / DE (MFSU50000) | 0.26 | 0.1411 | 0.1411 | ||||||
| NEM / Newmont Corporation | 0.00 | 25.13 | 0.26 | 50.88 | 0.1397 | 0.0444 | |||
| MOH / Molina Healthcare, Inc. | 0.00 | 0.00 | 0.26 | -9.51 | 0.1395 | -0.0193 | |||
| LOPE / Grand Canyon Education, Inc. | 0.00 | 47.42 | 0.25 | 61.15 | 0.1374 | 0.0495 | |||
| XOM / Exxon Mobil Corporation | 0.00 | -52.18 | 0.25 | -56.74 | 0.1340 | -0.1843 | |||
| VZ / Verizon Communications Inc. | 0.01 | 0.00 | 0.24 | -4.40 | 0.1294 | -0.0103 | |||
| DAL / Delta Air Lines, Inc. | 0.00 | 0.00 | 0.23 | 13.04 | 0.1268 | 0.0111 | |||
| MCK / McKesson Corporation | 0.00 | 11.31 | 0.23 | 42.86 | 0.1249 | 0.0349 | |||
| CNC / Centene Corporation | 0.00 | 0.00 | 0.21 | -10.88 | 0.1157 | -0.0175 | |||
| DVN / Devon Energy Corporation | 0.01 | 0.00 | 0.21 | -14.75 | 0.1127 | -0.0237 | |||
| VRSN / VeriSign, Inc. | 0.00 | 0.20 | 0.1099 | 0.1099 | |||||
| TSLA / Tesla, Inc. | 0.00 | -30.12 | 0.20 | -14.53 | 0.1085 | -0.0219 | |||
| CASH / Pathward Financial, Inc. | 0.00 | 143.86 | 0.20 | 166.22 | 0.1071 | 0.0654 | |||
| JCI / Johnson Controls International plc | 0.00 | 0.00 | 0.20 | 31.76 | 0.1057 | 0.0232 | |||
| IESC / IES Holdings, Inc. | 0.00 | 90.40 | 0.17 | 246.94 | 0.0922 | 0.0644 | |||
| JBL / Jabil Inc. | 0.00 | 0.17 | 0.0895 | 0.0895 | |||||
| TPR / Tapestry, Inc. | 0.00 | 294.53 | 0.16 | 396.97 | 0.0891 | 0.0704 | |||
| BKH / Black Hills Corporation | 0.00 | -35.03 | 0.16 | -40.07 | 0.0885 | -0.0631 | |||
| FAF / First American Financial Corporation | 0.00 | 32.65 | 0.16 | 23.85 | 0.0876 | 0.0149 | |||
| KGS / Kodiak Gas Services, Inc. | 0.00 | 0.16 | 0.0867 | 0.0867 | |||||
| AIN / Albany International Corp. | 0.00 | 144.81 | 0.16 | 149.21 | 0.0850 | 0.0498 | |||
| TRGP / Targa Resources Corp. | 0.00 | -41.41 | 0.15 | -49.13 | 0.0797 | -0.0816 | |||
| KR / The Kroger Co. | 0.00 | 0.00 | 0.14 | 5.88 | 0.0783 | 0.0022 | |||
| PLXS / Plexus Corp. | 0.00 | 5,157.89 | 0.14 | 13,400.00 | 0.0732 | 0.0723 | |||
| REGN / Regeneron Pharmaceuticals, Inc. | 0.00 | 1,481.25 | 0.13 | 1,100.00 | 0.0719 | 0.0647 | |||
| CMCSA / Comcast Corporation | 0.00 | 0.00 | 0.13 | -2.96 | 0.0711 | -0.0046 | |||
| HEI / HEICO Corporation | 0.00 | 166.67 | 0.13 | 573.68 | 0.0696 | 0.0585 | |||
| RCL / Royal Caribbean Cruises Ltd. | 0.00 | 0.00 | 0.13 | 53.01 | 0.0690 | 0.0224 | |||
| EAT / Brinker International, Inc. | 0.00 | 1,000.00 | 0.12 | 1,277.78 | 0.0676 | 0.0624 | |||
| CIVI / Civitas Resources, Inc. | 0.00 | 578.35 | 0.12 | 439.13 | 0.0672 | 0.0543 | |||
| BBY / Best Buy Co., Inc. | 0.00 | -11.37 | 0.12 | -42.31 | 0.0651 | -0.0495 | |||
| BWXT / BWX Technologies, Inc. | 0.00 | -60.59 | 0.12 | -42.57 | 0.0631 | -0.0498 | |||
| COP / ConocoPhillips | 0.00 | 0.00 | 0.12 | -14.18 | 0.0623 | -0.0128 | |||
| FCX / Freeport-McMoRan Inc. | 0.00 | 0.12 | 0.0622 | 0.0622 | |||||
| AIG / American International Group, Inc. | 0.00 | -65.59 | 0.11 | -59.86 | 0.0609 | -0.0925 | |||
| FIX / Comfort Systems USA, Inc. | 0.00 | 0.11 | 0.0604 | 0.0604 | |||||
| PRIM / Primoris Services Corporation | 0.00 | 0.11 | 0.0602 | 0.0602 | |||||
| NTRS / Northern Trust Corporation | 0.00 | -85.09 | 0.11 | -81.57 | 0.0596 | -0.2736 | |||
| MMS / Maximus, Inc. | 0.00 | 0.00 | 0.11 | 2.83 | 0.0592 | -0.0000 | |||
| JKHY / Jack Henry & Associates, Inc. | 0.00 | 0.10 | 0.0561 | 0.0561 | |||||
| TXRH / Texas Roadhouse, Inc. | 0.00 | 22.94 | 0.10 | 39.19 | 0.0560 | 0.0143 | |||
| AMAT / Applied Materials, Inc. | 0.00 | -72.68 | 0.10 | -75.30 | 0.0560 | -0.1732 | |||
| AXS / AXIS Capital Holdings Limited | 0.00 | 0.10 | 0.0546 | 0.0546 | |||||
| LPLA / LPL Financial Holdings Inc. | 0.00 | -62.80 | 0.10 | -35.76 | 0.0528 | -0.0425 | |||
| AGX / Argan, Inc. | 0.00 | -34.72 | 0.10 | 10.23 | 0.0525 | 0.0032 | |||
| BFAM / Bright Horizons Family Solutions Inc. | 0.00 | 85.85 | 0.10 | 82.69 | 0.0518 | 0.0223 | |||
| FCFS / FirstCash Holdings, Inc. | 0.00 | 380.27 | 0.10 | 458.82 | 0.0516 | 0.0418 | |||
| Mini MSCI Emg Mkt / DE (MESU50000) | 0.09 | 0.0497 | 0.0497 | ||||||
| ANET / Arista Networks Inc | 0.00 | 0.08 | 0.0455 | 0.0455 | |||||
| URI / United Rentals, Inc. | 0.00 | 0.08 | 0.0444 | 0.0444 | |||||
| ALLY / Ally Financial Inc. | 0.00 | -37.86 | 0.08 | -33.33 | 0.0423 | -0.0233 | |||
| DAVE / Dave Inc. | 0.00 | 0.08 | 0.0411 | 0.0411 | |||||
| UI / Ubiquiti Inc. | 0.00 | 0.00 | 0.07 | 32.14 | 0.0403 | 0.0090 | |||
| WBS / Webster Financial Corporation | 0.00 | 0.07 | 0.0398 | 0.0398 | |||||
| TOST / Toast, Inc. | 0.00 | 468.33 | 0.07 | 677.78 | 0.0383 | 0.0331 | |||
| ASAN / Asana, Inc. | 0.01 | 32.79 | 0.07 | 22.81 | 0.0380 | 0.0062 | |||
| QCOM / QUALCOMM Incorporated | 0.00 | -51.65 | 0.05 | -50.47 | 0.0290 | -0.0306 | |||
| FLR / Fluor Corporation | 0.00 | 18.28 | 0.05 | 68.97 | 0.0267 | 0.0105 | |||
| Russell 2000 Futures / DE (RTYU50000) | 0.05 | 0.0256 | 0.0256 | ||||||
| DRS / Leonardo DRS, Inc. | 0.00 | 0.05 | 0.0247 | 0.0247 | |||||
| CVCO / Cavco Industries, Inc. | 0.00 | -24.81 | 0.04 | -37.68 | 0.0235 | -0.0150 | |||
| SEZL / Sezzle Inc. | 0.00 | 180.95 | 0.04 | 2,000.00 | 0.0229 | 0.0213 | |||
| ROKU / Roku, Inc. | 0.00 | 116.74 | 0.04 | 180.00 | 0.0228 | 0.0141 | |||
| SM / SM Energy Company | 0.00 | 3,098.08 | 0.04 | 1,950.00 | 0.0222 | 0.0209 | |||
| CCSI / Consensus Cloud Solutions, Inc. | 0.00 | 0.00 | 0.04 | 0.00 | 0.0220 | -0.0007 | |||
| IBM / International Business Machines Corporation | 0.00 | -88.21 | 0.04 | -78.95 | 0.0219 | -0.0927 | |||
| MYRG / MYR Group Inc. | 0.00 | 3,071.43 | 0.04 | 0.0218 | 0.0214 | ||||
| UTI / Universal Technical Institute, Inc. | 0.00 | 0.00 | 0.04 | 31.03 | 0.0210 | 0.0046 | |||
| PEN / Penumbra, Inc. | 0.00 | 0.04 | 0.0208 | 0.0208 | |||||
| UHS / Universal Health Services, Inc. | 0.00 | 0.04 | 0.0207 | 0.0207 | |||||
| L / Loews Corporation | 0.00 | -6.80 | 0.04 | -7.50 | 0.0204 | -0.0022 | |||
| MLI / Mueller Industries, Inc. | 0.00 | 0.04 | 0.0193 | 0.0193 | |||||
| OVV / Ovintiv Inc. | 0.00 | 0.00 | 0.03 | -10.53 | 0.0185 | -0.0029 | |||
| RUSHA / Rush Enterprises, Inc. | 0.00 | 12.89 | 0.03 | 32.00 | 0.0181 | 0.0032 | |||
| VMI / Valmont Industries, Inc. | 0.00 | 653.85 | 0.03 | 966.67 | 0.0173 | 0.0153 | |||
| CW / Curtiss-Wright Corporation | 0.00 | -76.25 | 0.03 | 22.73 | 0.0151 | 0.0017 | |||
| AEVA / Aeva Technologies, Inc. | 0.00 | 0.03 | 0.0146 | 0.0146 | |||||
| ATKR / Atkore Inc. | 0.00 | -37.52 | 0.02 | -47.73 | 0.0127 | -0.0121 | |||
| BJ / BJ's Wholesale Club Holdings, Inc. | 0.00 | 288.89 | 0.02 | 1,000.00 | 0.0123 | 0.0111 | |||
| CATY / Cathay General Bancorp | 0.00 | -14.75 | 0.02 | 50.00 | 0.0115 | 0.0027 | |||
| RL / Ralph Lauren Corporation | 0.00 | 0.02 | 0.0107 | 0.0107 | |||||
| NTRA / Natera, Inc. | 0.00 | -78.02 | 0.02 | -73.61 | 0.0103 | -0.0302 | |||
| PNRG / PrimeEnergy Resources Corporation | 0.00 | 0.00 | 0.02 | -34.62 | 0.0093 | -0.0056 | |||
| VST / Vistra Corp. | 0.00 | -91.85 | 0.02 | -86.78 | 0.0088 | -0.0587 | |||
| SKYW / SkyWest, Inc. | 0.00 | 409.68 | 0.02 | 700.00 | 0.0088 | 0.0073 | |||
| ZUMZ / Zumiez Inc. | 0.00 | 0.00 | 0.01 | -12.50 | 0.0079 | -0.0012 | |||
| HII / Huntington Ingalls Industries, Inc. | 0.00 | -94.16 | 0.01 | -94.67 | 0.0071 | -0.1271 | |||
| WWD / Woodward, Inc. | 0.00 | 0.01 | 0.0069 | 0.0069 | |||||
| GPOR / Gulfport Energy Corporation | 0.00 | 0.00 | 0.01 | 10.00 | 0.0064 | 0.0004 | |||
| QCRH / QCR Holdings, Inc. | 0.00 | 0.00 | 0.01 | -8.33 | 0.0063 | -0.0005 | |||
| INCY / Incyte Corporation | 0.00 | 0.01 | 0.0055 | 0.0055 | |||||
| JILL / J.Jill, Inc. | 0.00 | 0.00 | 0.01 | -25.00 | 0.0051 | -0.0019 | |||
| AVT / Avnet, Inc. | 0.00 | -92.09 | 0.01 | -91.74 | 0.0049 | -0.0635 | |||
| WFRD / Weatherford International plc | 0.00 | 0.00 | 0.01 | 0.00 | 0.0040 | -0.0004 | |||
| WABC / Westamerica Bancorporation | 0.00 | 0.01 | 0.0031 | 0.0031 | |||||
| REVG / REV Group, Inc. | 0.00 | -94.63 | 0.01 | -92.65 | 0.0030 | -0.0351 | |||
| PRG / PROG Holdings, Inc. | 0.00 | 0.00 | 0.00 | 33.33 | 0.0024 | 0.0002 | |||
| STC / Stewart Information Services Corporation | 0.00 | 0.00 | 0.00 | 0.00 | 0.0023 | -0.0003 | |||
| TK / Teekay Corporation Ltd. | 0.00 | 0.00 | 0.00 | 33.33 | 0.0022 | 0.0004 | |||
| BRY / Berry Corporation | 0.00 | 66.86 | 0.00 | 50.00 | 0.0021 | 0.0006 | |||
| NNE / NANO Nuclear Energy Inc. | 0.00 | 0.00 | 0.0019 | 0.0019 | |||||
| LCII / LCI Industries | 0.00 | -71.29 | 0.00 | -84.62 | 0.0014 | -0.0063 | |||
| US15942R1418 / CHAPARRAL ENERGY INC SER B WT 10/01/25 | 0.00 | 0.00 | 0.00 | 0.0000 | 0.0000 | ||||
| AVA / Avista Corporation | 0.00 | -100.00 | 0.00 | -100.00 | -0.0151 | ||||
| WLDN / Willdan Group, Inc. | 0.00 | -100.00 | 0.00 | -100.00 | -0.0044 | ||||
| AR / Antero Resources Corporation | 0.00 | -100.00 | 0.00 | -100.00 | -0.0136 | ||||
| MDLM / Medley Management Inc. | 0.00 | -100.00 | 0.00 | 0.0000 | |||||
| BEPC / Brookfield Renewable Corporation | 0.00 | -100.00 | 0.00 | -100.00 | -0.0484 | ||||
| INOD / Innodata Inc. | 0.00 | -100.00 | 0.00 | -100.00 | -0.0049 | ||||
| US17888HAB96 / Civitas Resources Inc | 0.00 | 0.00 | 0.00 | 0.0000 | 0.0000 | ||||
| SR / Spire Inc. | 0.00 | -100.00 | 0.00 | -100.00 | -0.1536 | ||||
| ATGE / Adtalem Global Education Inc. | 0.00 | -100.00 | 0.00 | -100.00 | -0.0174 | ||||
| S&P 500 Mini Futures / DE (ESU500000) | -0.07 | -0.0356 | -0.0356 |