Mga Batayang Estadistika
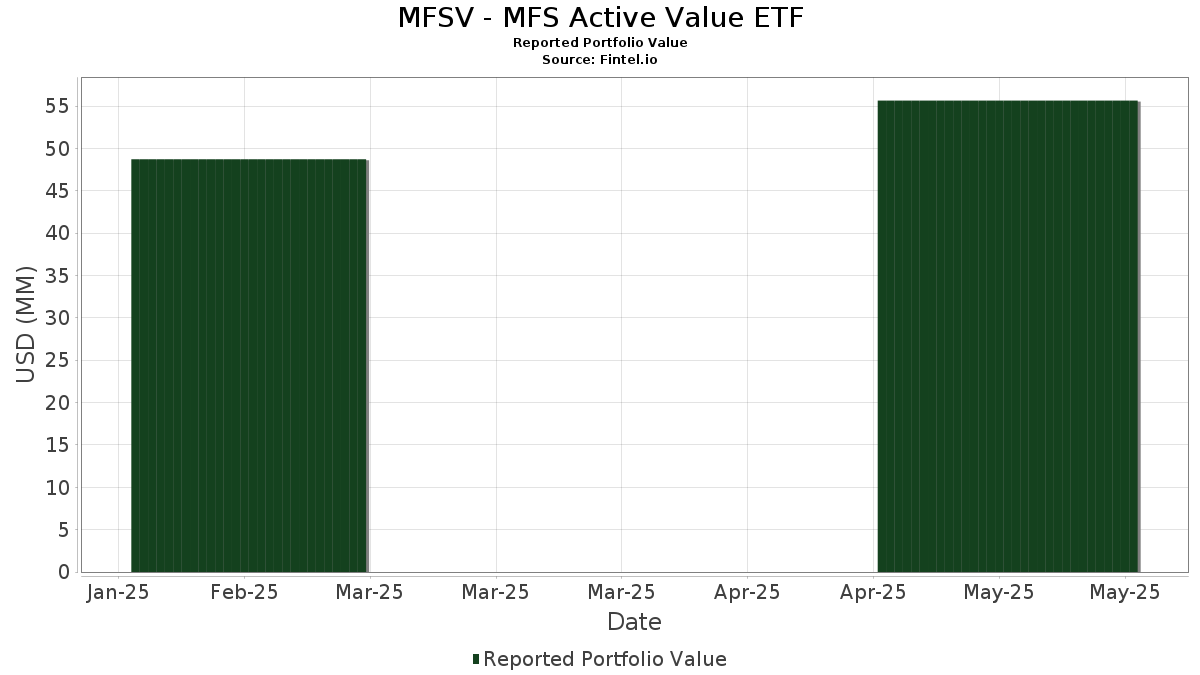
| Nilai Portofolio | $ 55,643,207 |
| Posisi Saat Ini | 59 |
Kepemilikan Terbaru, Kinerja, AUM (dari 13F, 13D)
MFSV - MFS Active Value ETF telah mengungkapkan total kepemilikan 59 dalam pengajuan SEC terbaru mereka. Nilai portofolio terbaru dihitung sebesar $ 55,643,207 USD. Aset yang Dikelola (AUM) sebenarnya adalah nilai ini ditambah kas (yang tidak diungkapkan). Aset-aset utama MFSV - MFS Active Value ETF adalah The Progressive Corporation (US:PGR) , JPMorgan Chase & Co. (US:JPM) , The Cigna Group (US:CI) , McKesson Corporation (US:MCK) , and Duke Energy Corporation (US:DUK) . Posisi baru MFSV - MFS Active Value ETF meliputi: LPL Financial Holdings Inc. (US:LPLA) , .
Peningkatan Tertinggi Kuartal Ini
Kami menggunakan perubahan dalam alokasi portofolio karena ini adalah metrik yang paling bermakna. Perubahan dapat disebabkan oleh perdagangan atau perubahan harga saham.
| Keamanan | Saham (MM) |
Nilai (Juta Dolar AS) |
Portfolio % | ΔPorsyento ng Portfolio |
|---|---|---|---|---|
| 0.00 | 0.32 | 0.5808 | 0.5808 | |
| 0.01 | 0.78 | 1.3906 | 0.4223 | |
| 0.01 | 1.33 | 2.3856 | 0.4190 | |
| 0.01 | 0.68 | 1.2141 | 0.3906 | |
| 0.01 | 1.08 | 1.9289 | 0.3381 | |
| 0.00 | 0.71 | 1.2729 | 0.2490 | |
| 0.01 | 1.22 | 2.1886 | 0.2300 | |
| 0.02 | 0.96 | 1.7179 | 0.2076 | |
| 0.00 | 1.32 | 2.3685 | 0.1952 | |
| 0.00 | 1.75 | 3.1376 | 0.1824 |
Penurunan Tertinggi Kuartal Ini
Kami menggunakan perubahan dalam alokasi portofolio karena ini adalah metrik yang paling bermakna. Perubahan dapat disebabkan oleh perdagangan atau perubahan harga saham.
| Keamanan | Saham (MM) |
Nilai (Juta Dolar AS) |
Portfolio % | ΔPorsyento ng Portfolio |
|---|---|---|---|---|
| 0.00 | 0.00 | -0.7870 | ||
| 0.00 | 0.36 | 0.6521 | -0.4354 | |
| 0.00 | 0.97 | 1.7413 | -0.4010 | |
| 0.01 | 0.82 | 1.4722 | -0.3945 | |
| 0.00 | 0.31 | 0.5481 | -0.3799 | |
| 0.02 | 0.81 | 1.4580 | -0.3430 | |
| 0.01 | 1.10 | 1.9672 | -0.2659 | |
| 0.01 | 0.84 | 1.5116 | -0.2050 | |
| 0.01 | 1.24 | 2.2272 | -0.1986 | |
| 0.01 | 0.96 | 1.7196 | -0.1706 |
Pengajuan 13F dan Dana
Formulir ini diajukan pada 2025-07-25 untuk periode pelaporan 2025-05-31. Klik ikon tautan untuk melihat riwayat transaksi selengkapnya.
Tingkatkan ke versi premium untuk membuka data premium dan ekspor ke Excel. ![]() .
.
| Keamanan | Ketik | Harga Saham Rata-rata | Saham (MM) |
ΔSaham (%) |
ΔSaham (%) |
Nilai ($MM) |
Portpolyo (%) |
ΔPortofolio (%) |
|
|---|---|---|---|---|---|---|---|---|---|
| PGR / The Progressive Corporation | 0.01 | 16.89 | 2.67 | 18.12 | 4.7786 | 0.1539 | |||
| JPM / JPMorgan Chase & Co. | 0.01 | 16.93 | 2.47 | 16.66 | 4.4185 | 0.0887 | |||
| CI / The Cigna Group | 0.01 | 16.79 | 1.78 | 19.77 | 3.1816 | 0.1445 | |||
| MCK / McKesson Corporation | 0.00 | 7.99 | 1.75 | 21.36 | 3.1376 | 0.1824 | |||
| DUK / Duke Energy Corporation | 0.01 | 16.90 | 1.44 | 17.09 | 2.5809 | 0.0622 | |||
| XOM / Exxon Mobil Corporation | 0.01 | 16.86 | 1.35 | 7.34 | 2.4122 | -0.1554 | |||
| BA / The Boeing Company | 0.01 | 16.79 | 1.33 | 38.69 | 2.3856 | 0.4190 | |||
| TRV / The Travelers Companies, Inc. | 0.00 | 16.79 | 1.32 | 24.62 | 2.3685 | 0.1952 | |||
| ABT / Abbott Laboratories | 0.01 | 16.82 | 1.27 | 13.14 | 2.2697 | -0.0247 | |||
| UNP / Union Pacific Corporation | 0.01 | 16.79 | 1.24 | 4.90 | 2.2272 | -0.1986 | |||
| RTX / RTX Corporation | 0.01 | 24.45 | 1.22 | 27.72 | 2.1886 | 0.2300 | |||
| SO / The Southern Company | 0.01 | 16.88 | 1.21 | 17.18 | 2.1775 | 0.0531 | |||
| NSRGY / Nestlé S.A. - Depositary Receipt (Common Stock) | 0.01 | 5.72 | 1.17 | 16.67 | 2.0963 | 0.0428 | |||
| AXP / American Express Company | 0.00 | 17.00 | 1.16 | 14.33 | 2.0744 | 0.0003 | |||
| MMC / Marsh & McLennan Companies, Inc. | 0.00 | 16.79 | 1.14 | 14.79 | 2.0454 | 0.0077 | |||
| MS / Morgan Stanley | 0.01 | 16.94 | 1.13 | 12.49 | 2.0185 | -0.0328 | |||
| CVX / Chevron Corporation | 0.01 | 16.84 | 1.10 | 0.64 | 1.9672 | -0.2659 | |||
| ADI / Analog Devices, Inc. | 0.01 | 16.79 | 1.08 | 8.63 | 1.9426 | -0.1015 | |||
| NDAQ / Nasdaq, Inc. | 0.01 | 37.33 | 1.08 | 38.66 | 1.9289 | 0.3381 | |||
| HD / The Home Depot, Inc. | 0.00 | 16.76 | 1.07 | 8.43 | 1.9130 | -0.1036 | |||
| PLD / Prologis, Inc. | 0.01 | 32.59 | 1.06 | 16.23 | 1.9013 | 0.0311 | |||
| HLT / Hilton Worldwide Holdings Inc. | 0.00 | 16.75 | 0.99 | 9.51 | 1.7749 | -0.0782 | |||
| AON / Aon plc | 0.00 | 2.15 | 0.97 | -7.08 | 1.7413 | -0.4010 | |||
| ABBV / AbbVie Inc. | 0.01 | 16.79 | 0.96 | 4.01 | 1.7196 | -0.1706 | |||
| D / Dominion Energy, Inc. | 0.02 | 29.90 | 0.96 | 29.99 | 1.7179 | 0.2076 | |||
| KLAC / KLA Corporation | 0.00 | 16.79 | 0.96 | 24.74 | 1.7174 | 0.1433 | |||
| ACN / Accenture plc | 0.00 | 16.78 | 0.95 | 6.18 | 1.6950 | -0.1298 | |||
| KKR / KKR & Co. Inc. | 0.01 | 34.84 | 0.93 | 20.76 | 1.6591 | 0.0891 | |||
| MDLZ / Mondelez International, Inc. | 0.01 | 16.88 | 0.92 | 22.90 | 1.6548 | 0.1147 | |||
| PG / The Procter & Gamble Company | 0.01 | 16.79 | 0.91 | 14.11 | 1.6248 | -0.0024 | |||
| GD / General Dynamics Corporation | 0.00 | 17.06 | 0.87 | 29.12 | 1.5583 | 0.1782 | |||
| ELV / Elevance Health, Inc. | 0.00 | 16.79 | 0.87 | 12.89 | 1.5555 | -0.0186 | |||
| COP / ConocoPhillips | 0.01 | 16.92 | 0.84 | 0.72 | 1.5116 | -0.2050 | |||
| NOC / Northrop Grumman Corporation | 0.00 | 16.79 | 0.83 | 22.53 | 1.4927 | 0.1012 | |||
| C / Citigroup Inc. | 0.01 | -4.32 | 0.82 | -9.88 | 1.4722 | -0.3945 | |||
| BAC / Bank of America Corporation | 0.02 | -3.34 | 0.81 | -7.51 | 1.4580 | -0.3430 | |||
| WFC / Wells Fargo & Company | 0.01 | 71.91 | 0.78 | 64.19 | 1.3906 | 0.4223 | |||
| HON / Honeywell International Inc. | 0.00 | 16.79 | 0.74 | 24.45 | 1.3228 | 0.1069 | |||
| NXPI / NXP Semiconductors N.V. | 0.00 | 42.25 | 0.74 | 26.03 | 1.3206 | 0.1237 | |||
| PCAR / PACCAR Inc | 0.01 | 16.96 | 0.73 | 2.38 | 1.3122 | -0.1532 | |||
| ETN / Eaton Corporation plc | 0.00 | 30.16 | 0.71 | 42.28 | 1.2729 | 0.2490 | |||
| LNT / Alliant Energy Corporation | 0.01 | 16.82 | 0.69 | 12.56 | 1.2384 | -0.0180 | |||
| KVUE / Kenvue Inc. | 0.03 | 16.88 | 0.69 | 18.18 | 1.2363 | 0.0410 | |||
| PFE / Pfizer Inc. | 0.03 | 16.88 | 0.69 | 3.92 | 1.2356 | -0.1240 | |||
| ITW / Illinois Tool Works Inc. | 0.00 | 16.78 | 0.69 | 8.53 | 1.2317 | -0.0668 | |||
| XEL / Xcel Energy Inc. | 0.01 | 73.33 | 0.68 | 68.83 | 1.2141 | 0.3906 | |||
| PCG / PG&E Corporation | 0.04 | 25.92 | 0.68 | 30.19 | 1.2137 | 0.1473 | |||
| JNJ / Johnson & Johnson | 0.00 | 16.79 | 0.63 | 9.74 | 1.1322 | -0.0459 | |||
| PEP / PepsiCo, Inc. | 0.00 | 16.79 | 0.63 | 0.16 | 1.1292 | -0.1611 | |||
| EFX / Equifax Inc. | 0.00 | 16.79 | 0.55 | 25.92 | 0.9849 | 0.0903 | |||
| TXN / Texas Instruments Incorporated | 0.00 | 16.78 | 0.51 | 8.94 | 0.9190 | -0.0451 | |||
| GVMXX / State Street Institutional Investment Trust - State Street Institutional US Govt Money Market Fnd Premier Cls | 0.47 | 4.27 | 0.47 | 4.20 | 0.8449 | -0.0813 | |||
| CRH / CRH plc | 0.00 | 37.40 | 0.45 | 22.34 | 0.8055 | 0.0519 | |||
| DEO / Diageo plc - Depositary Receipt (Common Stock) | 0.00 | -31.59 | 0.36 | -31.51 | 0.6521 | -0.4354 | |||
| MAA / Mid-America Apartment Communities, Inc. | 0.00 | 16.77 | 0.35 | 8.92 | 0.6354 | -0.0321 | |||
| RHHBY / Roche Holding AG - Depositary Receipt (Common Stock) | 0.01 | 16.95 | 0.33 | 12.85 | 0.5831 | -0.0071 | |||
| LPLA / LPL Financial Holdings Inc. | 0.00 | 0.32 | 0.5808 | 0.5808 | |||||
| MRK / Merck & Co., Inc. | 0.00 | 16.79 | 0.31 | -2.80 | 0.5605 | -0.0981 | |||
| TGT / Target Corporation | 0.00 | -10.78 | 0.31 | -32.52 | 0.5481 | -0.3799 | |||
| DD / DuPont de Nemours, Inc. | 0.00 | -100.00 | 0.00 | -100.00 | -0.7870 |