Mga Batayang Estadistika
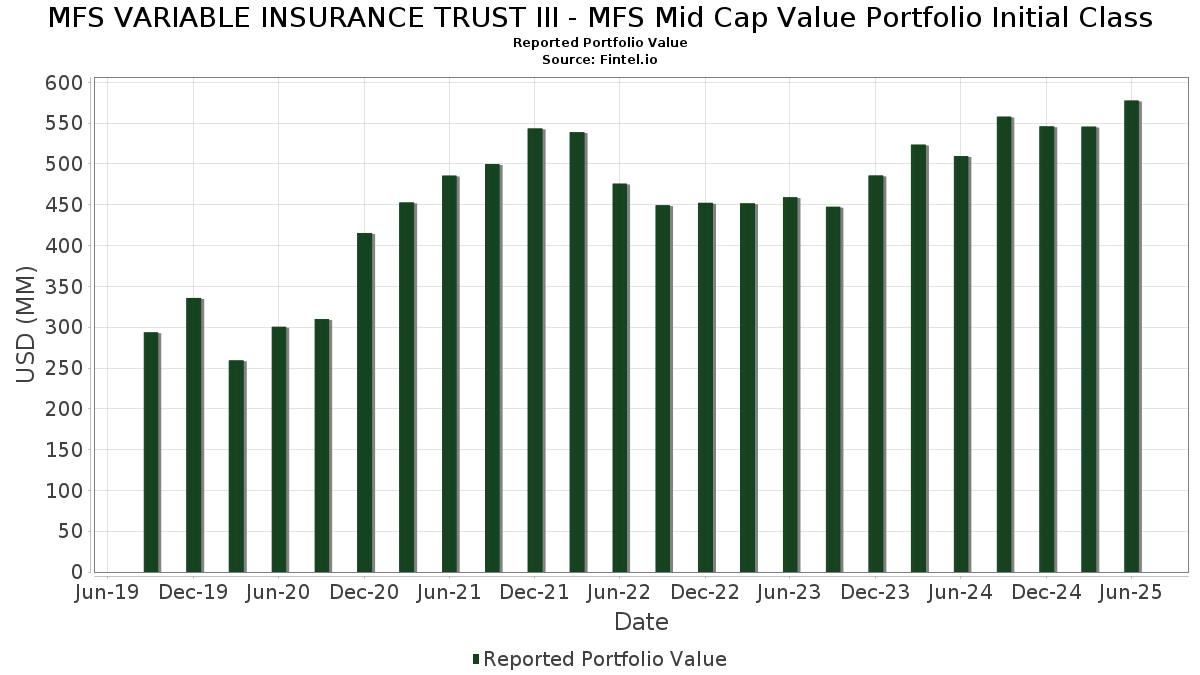
| Nilai Portofolio | $ 577,728,619 |
| Posisi Saat Ini | 143 |
Kepemilikan Terbaru, Kinerja, AUM (dari 13F, 13D)
MFS VARIABLE INSURANCE TRUST III - MFS Mid Cap Value Portfolio Initial Class telah mengungkapkan total kepemilikan 143 dalam pengajuan SEC terbaru mereka. Nilai portofolio terbaru dihitung sebesar $ 577,728,619 USD. Aset yang Dikelola (AUM) sebenarnya adalah nilai ini ditambah kas (yang tidak diungkapkan). Aset-aset utama MFS VARIABLE INSURANCE TRUST III - MFS Mid Cap Value Portfolio Initial Class adalah MFS Institutional Money Market Portfolio (US:US55291X1090) , Raymond James Financial, Inc. (US:RJF) , The Hartford Insurance Group, Inc. (US:HIG) , US Foods Holding Corp. (US:USFD) , and M&T Bank Corporation (US:MTB) . Posisi baru MFS VARIABLE INSURANCE TRUST III - MFS Mid Cap Value Portfolio Initial Class meliputi: Becton, Dickinson and Company (US:BDX) , Amcor plc (US:AMCR) , nVent Electric plc (US:NVT) , Nucor Corporation (US:NUE) , and Entegris, Inc. (US:ENTG) .
Peningkatan Tertinggi Kuartal Ini
Kami menggunakan perubahan dalam alokasi portofolio karena ini adalah metrik yang paling bermakna. Perubahan dapat disebabkan oleh perdagangan atau perubahan harga saham.
| Keamanan | Saham (MM) |
Nilai (Juta Dolar AS) |
Portfolio % | ΔPorsyento ng Portfolio |
|---|---|---|---|---|
| 0.02 | 4.06 | 0.7063 | 0.7063 | |
| 0.39 | 3.55 | 0.6180 | 0.6180 | |
| 0.05 | 3.34 | 0.5811 | 0.5811 | |
| 0.02 | 2.67 | 0.4645 | 0.4645 | |
| 0.03 | 2.51 | 0.4364 | 0.4364 | |
| 0.15 | 2.03 | 0.3532 | 0.3532 | |
| 0.01 | 1.82 | 0.3161 | 0.3161 | |
| 0.13 | 6.56 | 1.1412 | 0.2980 | |
| 0.09 | 7.11 | 1.2372 | 0.2030 | |
| 0.14 | 6.04 | 1.0512 | 0.1989 |
Penurunan Tertinggi Kuartal Ini
Kami menggunakan perubahan dalam alokasi portofolio karena ini adalah metrik yang paling bermakna. Perubahan dapat disebabkan oleh perdagangan atau perubahan harga saham.
| Keamanan | Saham (MM) |
Nilai (Juta Dolar AS) |
Portfolio % | ΔPorsyento ng Portfolio |
|---|---|---|---|---|
| 0.05 | 3.68 | 0.6402 | -0.4060 | |
| 8.53 | 8.54 | 1.4849 | -0.3825 | |
| 0.06 | 7.44 | 1.2946 | -0.2709 | |
| 0.04 | 2.54 | 0.4411 | -0.2374 | |
| 0.43 | 5.92 | 1.0307 | -0.2185 | |
| 0.05 | 4.23 | 0.7357 | -0.1495 | |
| 0.04 | 6.20 | 1.0782 | -0.1429 | |
| 0.12 | 3.78 | 0.6584 | -0.1371 | |
| 0.27 | 5.67 | 0.9860 | -0.1250 | |
| 0.06 | 4.37 | 0.7608 | -0.1222 |
Pengajuan 13F dan Dana
Formulir ini diajukan pada 2025-08-25 untuk periode pelaporan 2025-06-30. Klik ikon tautan untuk melihat riwayat transaksi selengkapnya.
Tingkatkan ke versi premium untuk membuka data premium dan ekspor ke Excel. ![]() .
.
| Keamanan | Ketik | Harga Saham Rata-rata | Saham (MM) |
ΔSaham (%) |
ΔSaham (%) |
Nilai ($MM) |
Portpolyo (%) |
ΔPortofolio (%) |
|
|---|---|---|---|---|---|---|---|---|---|
| US55291X1090 / MFS Institutional Money Market Portfolio | 8.53 | -16.03 | 8.54 | -16.03 | 1.4849 | -0.3825 | |||
| RJF / Raymond James Financial, Inc. | 0.05 | 7.39 | 7.87 | 18.57 | 1.3694 | 0.1497 | |||
| HIG / The Hartford Insurance Group, Inc. | 0.06 | -14.83 | 7.44 | -12.67 | 1.2946 | -0.2709 | |||
| USFD / US Foods Holding Corp. | 0.09 | 7.38 | 7.11 | 26.35 | 1.2372 | 0.2030 | |||
| MTB / M&T Bank Corporation | 0.03 | 7.38 | 6.72 | 16.53 | 1.1699 | 0.1098 | |||
| FXI / Flex Ltd. | 0.13 | -5.28 | 6.56 | 42.95 | 1.1412 | 0.2980 | |||
| WTY / Willis Towers Watson Public Limited Company | 0.02 | 7.38 | 6.37 | -2.61 | 1.1087 | -0.0935 | |||
| EXE / Expand Energy Corporation | 0.05 | 7.38 | 6.34 | 12.80 | 1.1022 | 0.0704 | |||
| AIZ / Assurant, Inc. | 0.03 | 7.38 | 6.29 | 1.11 | 1.0946 | -0.0487 | |||
| PEG / Public Service Enterprise Group Incorporated | 0.07 | 7.38 | 6.25 | 9.83 | 1.0881 | 0.0419 | |||
| A / Agilent Technologies, Inc. | 0.05 | 7.38 | 6.24 | 8.32 | 1.0851 | 0.0273 | |||
| TRGP / Targa Resources Corp. | 0.04 | 7.38 | 6.20 | -6.76 | 1.0782 | -0.1429 | |||
| COR / Cencora, Inc. | 0.02 | -8.81 | 6.20 | -1.67 | 1.0777 | -0.0797 | |||
| ARMK / Aramark | 0.14 | 7.38 | 6.04 | 30.24 | 1.0512 | 0.1989 | |||
| WAB / Westinghouse Air Brake Technologies Corporation | 0.03 | 7.39 | 6.03 | 23.98 | 1.0497 | 0.1555 | |||
| NTRS / Northern Trust Corporation | 0.05 | -15.06 | 5.95 | 9.17 | 1.0354 | 0.0339 | |||
| PCG / PG&E Corporation | 0.43 | 7.38 | 5.92 | -12.87 | 1.0307 | -0.2185 | |||
| FIS / Fidelity National Information Services, Inc. | 0.07 | 7.38 | 5.90 | 17.07 | 1.0262 | 0.1004 | |||
| EXR / Extra Space Storage Inc. | 0.04 | 7.38 | 5.88 | 6.64 | 1.0224 | 0.0098 | |||
| KVUE / Kenvue Inc. | 0.27 | 7.38 | 5.67 | -6.28 | 0.9860 | -0.1250 | |||
| CMS / CMS Energy Corporation | 0.08 | 7.38 | 5.52 | -0.95 | 0.9611 | -0.0636 | |||
| ALLE / Allegion plc | 0.04 | 7.38 | 5.48 | 18.62 | 0.9531 | 0.1046 | |||
| GPK / Graphic Packaging Holding Company | 0.26 | 17.55 | 5.39 | -4.59 | 0.9372 | -0.1001 | |||
| US21871X1090 / Corebridge Financial, Inc. | 0.15 | 3.12 | 5.34 | 15.95 | 0.9294 | 0.0829 | |||
| VICI / VICI Properties Inc. | 0.16 | 7.39 | 5.27 | 7.33 | 0.9172 | 0.0146 | |||
| AIG / American International Group, Inc. | 0.06 | 1.08 | 5.23 | -0.49 | 0.9100 | -0.0557 | |||
| LNT / Alliant Energy Corporation | 0.09 | 7.38 | 5.21 | 0.91 | 0.9056 | -0.0422 | |||
| EQH / Equitable Holdings, Inc. | 0.09 | 3.12 | 5.16 | 11.04 | 0.8976 | 0.0440 | |||
| Aptiv PLC / EC (JE00BTDN8H13) | 0.08 | 7.38 | 5.15 | 23.13 | 0.8956 | 0.1274 | |||
| TOL / Toll Brothers, Inc. | 0.04 | 7.38 | 5.10 | 16.08 | 0.8867 | 0.0799 | |||
| PNR / Pentair plc | 0.05 | 7.38 | 5.07 | 26.03 | 0.8820 | 0.1429 | |||
| GLW / Corning Incorporated | 0.09 | 7.38 | 4.96 | 23.36 | 0.8627 | 0.1241 | |||
| GFL / GFL Environmental Inc. | 0.10 | 7.38 | 4.94 | 12.16 | 0.8586 | 0.0502 | |||
| TE Connectivity PLC / EC (IE000IVNQZ81) | 0.03 | 7.39 | 4.91 | 28.17 | 0.8534 | 0.1502 | |||
| RF / Regions Financial Corporation | 0.21 | 7.38 | 4.87 | 16.23 | 0.8474 | 0.0775 | |||
| LDOS / Leidos Holdings, Inc. | 0.03 | 7.38 | 4.81 | 25.54 | 0.8363 | 0.1328 | |||
| J / Jacobs Solutions Inc. | 0.04 | 7.39 | 4.78 | 16.75 | 0.8318 | 0.0795 | |||
| LKQ / LKQ Corporation | 0.13 | 7.38 | 4.71 | -6.57 | 0.8191 | -0.1068 | |||
| DD / DuPont de Nemours, Inc. | 0.07 | 7.38 | 4.68 | -1.37 | 0.8139 | -0.0576 | |||
| BRX / Brixmor Property Group Inc. | 0.18 | 7.38 | 4.60 | 5.33 | 0.8010 | -0.0022 | |||
| TRU / TransUnion | 0.05 | 7.39 | 4.58 | 13.85 | 0.7967 | 0.0578 | |||
| CDW / CDW Corporation | 0.03 | 7.38 | 4.56 | 19.68 | 0.7924 | 0.0931 | |||
| LHX / L3Harris Technologies, Inc. | 0.02 | 7.39 | 4.55 | 28.70 | 0.7912 | 0.1419 | |||
| EWBC / East West Bancorp, Inc. | 0.04 | -9.52 | 4.52 | 1.80 | 0.7863 | -0.0295 | |||
| WPC / W. P. Carey Inc. | 0.07 | 7.38 | 4.51 | 6.15 | 0.7842 | 0.0040 | |||
| PNW / Pinnacle West Capital Corporation | 0.05 | 7.38 | 4.46 | 0.88 | 0.7759 | -0.0364 | |||
| THG / The Hanover Insurance Group, Inc. | 0.03 | 5.26 | 4.41 | 2.80 | 0.7671 | -0.0210 | |||
| CCEP / COCA COLA EUROPACIFIC COMPANY GUAR REGS 11/27 1.5 | 0.05 | -12.05 | 4.40 | -6.29 | 0.7649 | -0.0972 | |||
| EMN / Eastman Chemical Company | 0.06 | 7.38 | 4.37 | -9.01 | 0.7608 | -0.1222 | |||
| FANG / Diamondback Energy, Inc. | 0.03 | 7.38 | 4.37 | -7.71 | 0.7598 | -0.1097 | |||
| AGCO / AGCO Corporation | 0.04 | 7.39 | 4.37 | 19.69 | 0.7593 | 0.0892 | |||
| ESS / Essex Property Trust, Inc. | 0.02 | 7.38 | 4.33 | -0.73 | 0.7538 | -0.0481 | |||
| SUI / Sun Communities, Inc. | 0.03 | 7.38 | 4.31 | 5.57 | 0.7491 | -0.0001 | |||
| DAL / Delta Air Lines, Inc. | 0.09 | 7.38 | 4.29 | 21.11 | 0.7457 | 0.0956 | |||
| EA / Electronic Arts Inc. | 0.03 | -6.02 | 4.28 | 3.86 | 0.7448 | -0.0125 | |||
| ACI / Albertsons Companies, Inc. | 0.20 | 7.38 | 4.25 | 5.04 | 0.7392 | -0.0040 | |||
| RRX / Regal Rexnord Corporation | 0.03 | 7.39 | 4.23 | 36.70 | 0.7362 | 0.1676 | |||
| GPN / Global Payments Inc. | 0.05 | 7.38 | 4.23 | -12.22 | 0.7357 | -0.1495 | |||
| PR / Permian Resources Corporation | 0.31 | 7.38 | 4.22 | 5.60 | 0.7349 | -0.0000 | |||
| H / Hyatt Hotels Corporation | 0.03 | 26.03 | 4.21 | 43.69 | 0.7325 | 0.1941 | |||
| MAA / Mid-America Apartment Communities, Inc. | 0.03 | 7.39 | 4.20 | -5.15 | 0.7303 | -0.0829 | |||
| ROST / Ross Stores, Inc. | 0.03 | 23.61 | 4.19 | 23.38 | 0.7290 | 0.1052 | |||
| SYY / Sysco Corporation | 0.06 | 25.49 | 4.17 | 26.66 | 0.7256 | 0.1206 | |||
| CNP / CenterPoint Energy, Inc. | 0.11 | 5.27 | 4.17 | 6.74 | 0.7250 | 0.0078 | |||
| VOYA / Voya Financial, Inc. | 0.06 | 3.12 | 4.10 | 8.06 | 0.7139 | 0.0161 | |||
| NSC / Norfolk Southern Corporation | 0.02 | 7.38 | 4.09 | 16.04 | 0.7123 | 0.0641 | |||
| CPW / Check Point Software Technologies Ltd. | 0.02 | 3.12 | 4.09 | 0.10 | 0.7119 | -0.0392 | |||
| FERG / Ferguson Enterprises Inc. | 0.02 | 7.38 | 4.09 | 45.91 | 0.7111 | 0.1965 | |||
| INGR / Ingredion Incorporated | 0.03 | 7.38 | 4.06 | 7.72 | 0.7064 | 0.0138 | |||
| BDX / Becton, Dickinson and Company | 0.02 | 4.06 | 0.7063 | 0.7063 | |||||
| SRE / Sempra | 0.05 | 7.38 | 4.03 | 14.03 | 0.7016 | 0.0518 | |||
| STE / STERIS plc | 0.02 | 7.38 | 4.03 | 13.82 | 0.7008 | 0.0505 | |||
| VLO / Valero Energy Corporation | 0.03 | 7.39 | 4.02 | 9.30 | 0.6994 | 0.0236 | |||
| LH / Labcorp Holdings Inc. | 0.02 | 7.38 | 3.99 | 21.12 | 0.6935 | 0.0888 | |||
| JLL / Jones Lang LaSalle Incorporated | 0.02 | 7.39 | 3.98 | 10.81 | 0.6920 | 0.0324 | |||
| VTR / Ventas, Inc. | 0.06 | 7.38 | 3.87 | -1.37 | 0.6740 | -0.0477 | |||
| VNX / NXP Semiconductors N.V. | 0.02 | 7.38 | 3.84 | 23.44 | 0.6688 | 0.0967 | |||
| ATO / Atmos Energy Corporation | 0.02 | 7.38 | 3.83 | 7.05 | 0.6660 | 0.0090 | |||
| KBR / KBR, Inc. | 0.08 | 7.38 | 3.81 | 3.34 | 0.6624 | -0.0144 | |||
| ZBRA / Zebra Technologies Corporation | 0.01 | 7.39 | 3.79 | 17.18 | 0.6597 | 0.0652 | |||
| SLM / SLM Corporation | 0.12 | -21.71 | 3.78 | -12.61 | 0.6584 | -0.1371 | |||
| AVY / Avery Dennison Corporation | 0.02 | 7.39 | 3.78 | 5.88 | 0.6582 | 0.0017 | |||
| IFF / International Flavors & Fragrances Inc. | 0.05 | 7.39 | 3.76 | 1.79 | 0.6543 | -0.0247 | |||
| ITT / ITT Inc. | 0.02 | 5.26 | 3.74 | 27.83 | 0.6514 | 0.1131 | |||
| PAGP / Plains GP Holdings, L.P. - Limited Partnership | 0.19 | 7.39 | 3.72 | -2.34 | 0.6469 | -0.0525 | |||
| OTIS / Otis Worldwide Corporation | 0.04 | 7.38 | 3.69 | 3.05 | 0.6416 | -0.0160 | |||
| CTVA / Corteva, Inc. | 0.05 | -45.43 | 3.68 | -35.37 | 0.6402 | -0.4060 | |||
| BC / Brunswick Corporation | 0.07 | 7.39 | 3.66 | 10.18 | 0.6365 | 0.0263 | |||
| ERE / Everest Group, Ltd. | 0.01 | 7.38 | 3.63 | 0.44 | 0.6308 | -0.0325 | |||
| IP / International Paper Company | 0.08 | 7.38 | 3.62 | -5.74 | 0.6292 | -0.0757 | |||
| Viking Holdings Ltd / EC (BMG93A5A1010) | 0.07 | 7.38 | 3.61 | 43.97 | 0.6272 | 0.1671 | |||
| UHS / Universal Health Services, Inc. | 0.02 | 7.38 | 3.59 | 3.52 | 0.6246 | -0.0125 | |||
| AMCR / Amcor plc | 0.39 | 3.55 | 0.6180 | 0.6180 | |||||
| FTI / TechnipFMC plc | 0.10 | 7.38 | 3.48 | 16.68 | 0.6050 | 0.0575 | |||
| DRI / Darden Restaurants, Inc. | 0.02 | 7.39 | 3.47 | 12.66 | 0.6038 | 0.0379 | |||
| JHX / James Hardie Industries plc - Depositary Receipt (Common Stock) | 0.13 | 37.29 | 3.40 | 56.70 | 0.5923 | 0.1931 | |||
| BJ / BJ's Wholesale Club Holdings, Inc. | 0.03 | -6.40 | 3.40 | -11.54 | 0.5910 | -0.1146 | |||
| HUM / Humana Inc. | 0.01 | 29.31 | 3.37 | 19.48 | 0.5858 | 0.0680 | |||
| HWM / Howmet Aerospace Inc. | 0.02 | -38.77 | 3.35 | -12.14 | 0.5832 | -0.1178 | |||
| NVT / nVent Electric plc | 0.05 | 3.34 | 0.5811 | 0.5811 | |||||
| BA.PRA / The Boeing Company - Preferred Security | 0.05 | 0.00 | 3.34 | 13.66 | 0.5806 | 0.0411 | |||
| LNC / Lincoln National Corporation | 0.09 | 3.12 | 3.27 | -0.64 | 0.5694 | -0.0358 | |||
| CG / The Carlyle Group Inc. | 0.06 | 7.38 | 3.24 | 26.64 | 0.5632 | 0.0935 | |||
| MGMXX / JPMorgan Trust II - JPMorgan U.S. Government Money Market Fund IM | 3.22 | 56.64 | 3.22 | 56.62 | 0.5597 | 0.1824 | |||
| FITB / Fifth Third Bancorp | 0.08 | 7.38 | 3.22 | 12.68 | 0.5597 | 0.0351 | |||
| PCAR / PACCAR Inc | 0.03 | 7.38 | 3.17 | 4.86 | 0.5517 | -0.0040 | |||
| HSY / The Hershey Company | 0.02 | 7.38 | 3.16 | 4.23 | 0.5492 | -0.0074 | |||
| NDSN / Nordson Corporation | 0.01 | 7.39 | 3.13 | 14.13 | 0.5437 | 0.0406 | |||
| SWK / Stanley Black & Decker, Inc. | 0.05 | 7.39 | 3.11 | -5.35 | 0.5415 | -0.0628 | |||
| OMC / Omnicom Group Inc. | 0.04 | 7.38 | 3.00 | -6.81 | 0.5212 | -0.0695 | |||
| MHK / Mohawk Industries, Inc. | 0.03 | 34.40 | 2.97 | 23.41 | 0.5165 | 0.0745 | |||
| ASH / Ashland Inc. | 0.06 | 7.38 | 2.95 | -8.91 | 0.5137 | -0.0820 | |||
| RVTY / Revvity, Inc. | 0.03 | 34.35 | 2.89 | 22.83 | 0.5027 | 0.0705 | |||
| MAT / Mattel, Inc. | 0.14 | 7.38 | 2.74 | 8.96 | 0.4763 | 0.0148 | |||
| PB / Prosperity Bancshares, Inc. | 0.04 | 7.39 | 2.72 | 5.66 | 0.4740 | 0.0004 | |||
| TPG / TPG Inc. | 0.05 | -15.58 | 2.68 | -6.66 | 0.4658 | -0.0611 | |||
| NUE / Nucor Corporation | 0.02 | 2.67 | 0.4645 | 0.4645 | |||||
| REXR / Rexford Industrial Realty, Inc. | 0.07 | 7.38 | 2.66 | -2.42 | 0.4623 | -0.0381 | |||
| BLDR / Builders FirstSource, Inc. | 0.02 | 7.39 | 2.58 | 0.27 | 0.4491 | -0.0238 | |||
| GEHC / GE HealthCare Technologies Inc. | 0.03 | 7.38 | 2.57 | -1.42 | 0.4471 | -0.0320 | |||
| JBHT / J.B. Hunt Transport Services, Inc. | 0.02 | 7.39 | 2.57 | 4.22 | 0.4467 | -0.0059 | |||
| SYF / Synchrony Financial | 0.04 | 7.38 | 2.55 | 35.39 | 0.4434 | 0.0975 | |||
| SKX / Skechers U.S.A., Inc. | 0.04 | -38.22 | 2.54 | -31.34 | 0.4411 | -0.2374 | |||
| BRSL / Brightstar Lottery PLC | 0.16 | 7.39 | 2.51 | 4.41 | 0.4366 | -0.0050 | |||
| ENTG / Entegris, Inc. | 0.03 | 2.51 | 0.4364 | 0.4364 | |||||
| ALK / Alaska Air Group, Inc. | 0.05 | 7.38 | 2.48 | 7.92 | 0.4316 | 0.0094 | |||
| SWKS / Skyworks Solutions, Inc. | 0.03 | 25.87 | 2.41 | 45.09 | 0.4194 | 0.1142 | |||
| COLB / Columbia Banking System, Inc. | 0.10 | 7.38 | 2.39 | 0.67 | 0.4161 | -0.0204 | |||
| IJF / ICON Public Limited Company | 0.02 | 7.39 | 2.34 | -10.77 | 0.4065 | -0.0745 | |||
| CAG / Conagra Brands, Inc. | 0.11 | 7.39 | 2.20 | -17.61 | 0.3820 | -0.1074 | |||
| EIX / Edison International | 0.04 | 7.38 | 2.19 | -5.96 | 0.3814 | -0.0469 | |||
| KNX / Knight-Swift Transportation Holdings Inc. | 0.05 | 7.39 | 2.12 | 9.24 | 0.3683 | 0.0122 | |||
| AES / The AES Corporation | 0.19 | 7.38 | 2.04 | -9.07 | 0.3557 | -0.0573 | |||
| AVTR / Avantor, Inc. | 0.15 | 2.03 | 0.3532 | 0.3532 | |||||
| BIIB / Biogen Inc. | 0.02 | 7.39 | 1.98 | -1.40 | 0.3439 | -0.0246 | |||
| TFX / Teleflex Incorporated | 0.02 | 7.39 | 1.91 | -8.04 | 0.3322 | -0.0492 | |||
| LW / Lamb Weston Holdings, Inc. | 0.04 | 7.38 | 1.85 | 4.45 | 0.3226 | -0.0035 | |||
| NXST / Nexstar Media Group, Inc. | 0.01 | 1.82 | 0.3161 | 0.3161 | |||||
| NWL / Newell Brands Inc. | 0.33 | 7.38 | 1.80 | -6.45 | 0.3127 | -0.0404 | |||
| PEGA / Pegasystems Inc. | 0.03 | 114.76 | 1.75 | 67.21 | 0.3052 | 0.1124 | |||
| HAL / Halliburton Company | 0.08 | 7.38 | 1.67 | -13.73 | 0.2907 | -0.0652 | |||
| SARO / StandardAero, Inc. | 0.04 | 7.38 | 1.34 | 27.63 | 0.2323 | 0.0400 | |||
| OGN / Organon & Co. | 0.13 | 7.38 | 1.28 | -30.19 | 0.2226 | -0.1141 |