Mga Batayang Estadistika
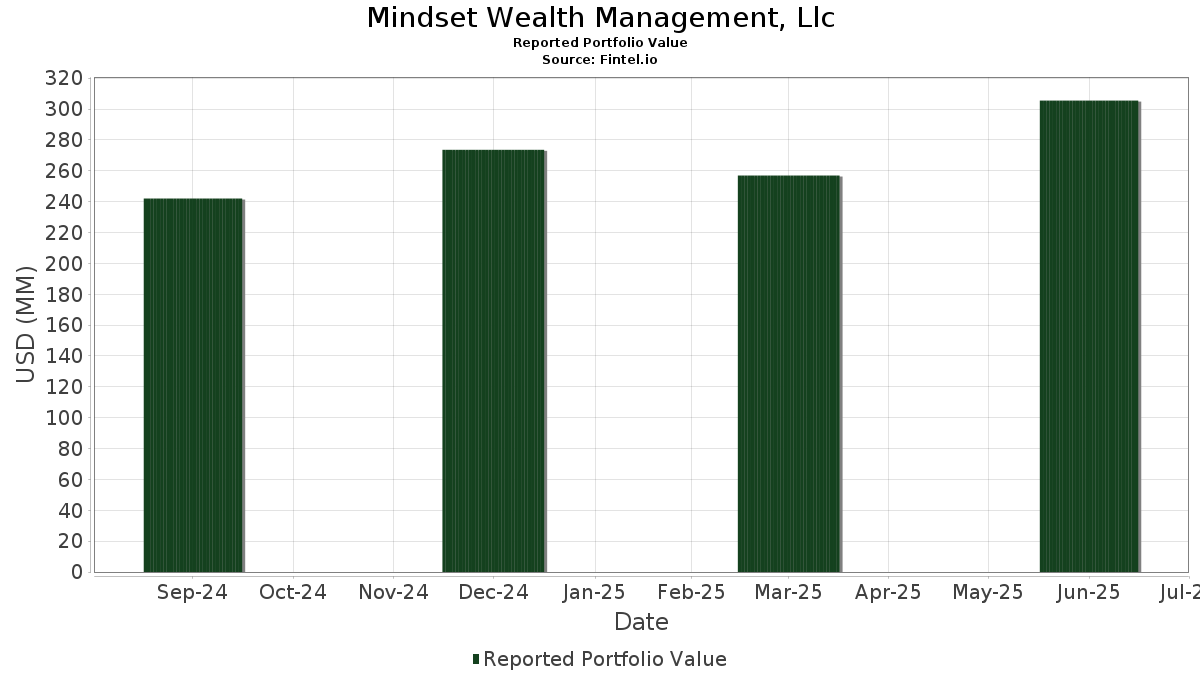
| Nilai Portofolio | $ 305,490,062 |
| Posisi Saat Ini | 153 |
Kepemilikan Terbaru, Kinerja, AUM (dari 13F, 13D)
Mindset Wealth Management, Llc telah mengungkapkan total kepemilikan 153 dalam pengajuan SEC terbaru mereka. Nilai portofolio terbaru dihitung sebesar $ 305,490,062 USD. Aset yang Dikelola (AUM) sebenarnya adalah nilai ini ditambah kas (yang tidak diungkapkan). Aset-aset utama Mindset Wealth Management, Llc adalah NVIDIA Corporation (US:NVDA) , Apple Inc. (US:AAPL) , CME Group Inc. (US:CME) , Amazon.com, Inc. (US:AMZN) , and Meta Platforms, Inc. (US:META) . Posisi baru Mindset Wealth Management, Llc meliputi: Sezzle Inc. (US:SEZL) , Carrier Global Corporation (US:CARR) , Vanguard Index Funds - Vanguard Mid-Cap ETF (US:VO) , Coherent Corp. (US:COHR) , and iShares Trust - iShares Core MSCI Total International Stock ETF (US:IXUS) .
Peningkatan Tertinggi Kuartal Ini
Kami menggunakan perubahan dalam alokasi portofolio karena ini adalah metrik yang paling bermakna. Perubahan dapat disebabkan oleh perdagangan atau perubahan harga saham.
| Keamanan | Saham (MM) |
Nilai (Juta Dolar AS) |
Portfolio % | ΔPorsyento ng Portfolio |
|---|---|---|---|---|
| 0.92 | 145.25 | 47.5471 | 5.4087 | |
| 0.00 | 2.24 | 0.7328 | 0.3777 | |
| 0.24 | 1.61 | 0.5259 | 0.3395 | |
| 0.01 | 3.12 | 1.0197 | 0.2927 | |
| 0.01 | 1.55 | 0.5068 | 0.1344 | |
| 0.00 | 0.39 | 0.1272 | 0.1272 | |
| 0.01 | 0.37 | 0.1219 | 0.1219 | |
| 0.00 | 0.35 | 0.1151 | 0.1151 | |
| 0.00 | 0.34 | 0.1123 | 0.1123 | |
| 0.00 | 0.34 | 0.1122 | 0.1122 |
Penurunan Tertinggi Kuartal Ini
Kami menggunakan perubahan dalam alokasi portofolio karena ini adalah metrik yang paling bermakna. Perubahan dapat disebabkan oleh perdagangan atau perubahan harga saham.
| Keamanan | Saham (MM) |
Nilai (Juta Dolar AS) |
Portfolio % | ΔPorsyento ng Portfolio |
|---|---|---|---|---|
| 0.22 | 45.30 | 14.8272 | -4.2738 | |
| 0.03 | 8.55 | 2.7995 | -0.4015 | |
| 0.02 | 3.03 | 0.9924 | -0.2607 | |
| 0.02 | 1.23 | 0.4038 | -0.1569 | |
| 0.02 | 1.54 | 0.5032 | -0.1449 | |
| 0.01 | 1.58 | 0.5158 | -0.1439 | |
| 0.06 | 0.18 | 0.0589 | -0.1426 | |
| 0.01 | 1.28 | 0.4189 | -0.1315 | |
| 0.00 | 1.91 | 0.6260 | -0.1171 | |
| 0.01 | 2.34 | 0.7646 | -0.1141 |
Pengajuan 13F dan Dana
Formulir ini diajukan pada 2025-08-11 untuk periode pelaporan 2025-06-30. Klik ikon tautan untuk melihat riwayat transaksi selengkapnya.
Tingkatkan ke versi premium untuk membuka data premium dan ekspor ke Excel. ![]() .
.
| Keamanan | Ketik | Harga Saham Rata-rata | Saham (MM) |
ΔSaham (%) |
ΔSaham (%) |
Nilai ($MM) |
Portpolyo (%) |
ΔPortofolio (%) |
|
|---|---|---|---|---|---|---|---|---|---|
| NVDA / NVIDIA Corporation | 0.92 | -7.96 | 145.25 | 34.17 | 47.5471 | 5.4087 | |||
| AAPL / Apple Inc. | 0.22 | -0.07 | 45.30 | -7.70 | 14.8272 | -4.2738 | |||
| CME / CME Group Inc. | 0.03 | 0.09 | 8.55 | 4.00 | 2.7995 | -0.4015 | |||
| AMZN / Amazon.com, Inc. | 0.03 | 0.35 | 6.58 | 15.71 | 2.1535 | -0.0594 | |||
| META / Meta Platforms, Inc. | 0.00 | -1.96 | 3.25 | 25.55 | 1.0635 | 0.0562 | |||
| AVGO / Broadcom Inc. | 0.01 | 1.30 | 3.12 | 66.85 | 1.0197 | 0.2927 | |||
| YUM / Yum! Brands, Inc. | 0.02 | 0.00 | 3.03 | -5.84 | 0.9924 | -0.2607 | |||
| GOOGL / Alphabet Inc. | 0.02 | 2.14 | 2.97 | 16.41 | 0.9731 | -0.0209 | |||
| AXP / American Express Company | 0.01 | 1.30 | 2.82 | 20.11 | 0.9228 | 0.0091 | |||
| MSFT / Microsoft Corporation | 0.00 | -2.78 | 2.35 | 28.87 | 0.7686 | 0.0592 | |||
| V / Visa Inc. | 0.01 | 2.13 | 2.34 | 3.46 | 0.7646 | -0.1141 | |||
| QQQ / Invesco QQQ Trust, Series 1 | 0.00 | 108.53 | 2.24 | 145.39 | 0.7328 | 0.3777 | |||
| BRK.B / Berkshire Hathaway Inc. | 0.00 | 9.82 | 1.91 | 0.16 | 0.6260 | -0.1171 | |||
| USA / Liberty All-Star Equity Fund | 0.24 | 222.67 | 1.61 | 235.98 | 0.5259 | 0.3395 | |||
| XOM / Exxon Mobil Corporation | 0.01 | 2.56 | 1.58 | -7.02 | 0.5158 | -0.1439 | |||
| ORCL / Oracle Corporation | 0.01 | 3.48 | 1.55 | 61.92 | 0.5068 | 0.1344 | |||
| MRK / Merck & Co., Inc. | 0.02 | 4.68 | 1.54 | -7.69 | 0.5032 | -0.1449 | |||
| TFC / Truist Financial Corporation | 0.04 | 1.62 | 1.52 | 6.22 | 0.4980 | -0.0597 | |||
| PM / Philip Morris International Inc. | 0.01 | -0.51 | 1.49 | 14.14 | 0.4864 | -0.0202 | |||
| RTX / RTX Corporation | 0.01 | 32.09 | 1.46 | 45.71 | 0.4779 | 0.0877 | |||
| TSLA / Tesla, Inc. | 0.00 | -9.71 | 1.35 | 10.66 | 0.4417 | -0.0329 | |||
| ABBV / AbbVie Inc. | 0.01 | 2.15 | 1.28 | -9.55 | 0.4189 | -0.1315 | |||
| GLW / Corning Incorporated | 0.02 | -4.02 | 1.27 | 10.27 | 0.4148 | -0.0325 | |||
| AMD / Advanced Micro Devices, Inc. | 0.01 | 10.00 | 1.25 | 51.95 | 0.4089 | 0.0889 | |||
| OKE / ONEOK, Inc. | 0.02 | 4.08 | 1.23 | -14.37 | 0.4038 | -0.1569 | |||
| FNB / F.N.B. Corporation | 0.08 | 0.00 | 1.21 | 8.39 | 0.3977 | -0.0385 | |||
| TMUS / T-Mobile US, Inc. | 0.00 | 10.56 | 1.12 | -1.24 | 0.3657 | -0.0745 | |||
| NFLX / Netflix, Inc. | 0.00 | 2.27 | 1.09 | 46.89 | 0.3559 | 0.0678 | |||
| GOOG / Alphabet Inc. | 0.01 | 3.42 | 1.05 | 17.43 | 0.3444 | -0.0043 | |||
| CRWD / CrowdStrike Holdings, Inc. | 0.00 | 8.35 | 0.99 | 56.56 | 0.3246 | 0.0780 | |||
| MS / Morgan Stanley | 0.01 | 0.91 | 0.92 | 21.93 | 0.3023 | 0.0073 | |||
| LLY / Eli Lilly and Company | 0.00 | -2.64 | 0.92 | -8.19 | 0.3011 | -0.0885 | |||
| STX / Seagate Technology Holdings plc | 0.01 | -19.99 | 0.90 | 35.91 | 0.2939 | 0.0368 | |||
| KLAC / KLA Corporation | 0.00 | 2.27 | 0.89 | 34.75 | 0.2909 | 0.0342 | |||
| YUMC / Yum China Holdings, Inc. | 0.02 | 0.00 | 0.86 | -14.14 | 0.2825 | -0.1086 | |||
| QLD / ProShares Trust - ProShares Ultra QQQ | 0.01 | 0.00 | 0.83 | 32.42 | 0.2703 | 0.0276 | |||
| IBM / International Business Machines Corporation | 0.00 | 9.83 | 0.81 | 30.37 | 0.2642 | 0.0229 | |||
| JPM / JPMorgan Chase & Co. | 0.00 | -5.28 | 0.81 | 11.94 | 0.2639 | -0.0164 | |||
| KDP / Keurig Dr Pepper Inc. | 0.02 | 14.25 | 0.80 | 10.47 | 0.2626 | -0.0203 | |||
| LMT / Lockheed Martin Corporation | 0.00 | -6.91 | 0.79 | -3.41 | 0.2593 | -0.0600 | |||
| PH / Parker-Hannifin Corporation | 0.00 | 0.09 | 0.79 | 15.06 | 0.2577 | -0.0087 | |||
| IRM / Iron Mountain Incorporated | 0.01 | -2.14 | 0.77 | 16.72 | 0.2516 | -0.0048 | |||
| CSCO / Cisco Systems, Inc. | 0.01 | -0.22 | 0.77 | 12.30 | 0.2511 | -0.0150 | |||
| NOW / ServiceNow, Inc. | 0.00 | -5.35 | 0.75 | 22.30 | 0.2445 | 0.0067 | |||
| MAIN / Main Street Capital Corporation | 0.01 | 3.51 | 0.74 | 8.04 | 0.2422 | -0.0241 | |||
| ISRG / Intuitive Surgical, Inc. | 0.00 | 1.27 | 0.74 | 11.03 | 0.2409 | -0.0169 | |||
| TXN / Texas Instruments Incorporated | 0.00 | 3.86 | 0.73 | 20.03 | 0.2393 | 0.0022 | |||
| HD / The Home Depot, Inc. | 0.00 | 5.15 | 0.73 | 5.22 | 0.2377 | -0.0310 | |||
| PTY / PIMCO Corporate & Income Opportunity Fund | 0.05 | 0.00 | 0.72 | -3.74 | 0.2358 | -0.0557 | |||
| COST / Costco Wholesale Corporation | 0.00 | 0.41 | 0.72 | 5.12 | 0.2353 | -0.0309 | |||
| CMI / Cummins Inc. | 0.00 | 4.07 | 0.71 | 8.70 | 0.2332 | -0.0218 | |||
| HUBB / Hubbell Incorporated | 0.00 | 0.58 | 0.70 | 24.16 | 0.2306 | 0.0097 | |||
| KR / The Kroger Co. | 0.01 | 5.57 | 0.69 | 11.87 | 0.2253 | -0.0142 | |||
| XLK / The Select Sector SPDR Trust - The Technology Select Sector SPDR Fund | 0.00 | 80.07 | 0.67 | 120.93 | 0.2179 | 0.1006 | |||
| ALSN / Allison Transmission Holdings, Inc. | 0.01 | 0.94 | 0.64 | 0.31 | 0.2109 | -0.0393 | |||
| ICE / Intercontinental Exchange, Inc. | 0.00 | 0.00 | 0.62 | 6.30 | 0.2045 | -0.0241 | |||
| BKR / Baker Hughes Company | 0.02 | 9.86 | 0.62 | -4.16 | 0.2038 | -0.0491 | |||
| QCOM / QUALCOMM Incorporated | 0.00 | 2.58 | 0.62 | 6.34 | 0.2034 | -0.0240 | |||
| GMED / Globus Medical, Inc. | 0.01 | 0.00 | 0.62 | -19.38 | 0.2031 | -0.0964 | |||
| CVX / Chevron Corporation | 0.00 | 0.00 | 0.61 | -14.37 | 0.2011 | -0.0783 | |||
| PLTR / Palantir Technologies Inc. | 0.00 | 52.09 | 0.61 | 145.97 | 0.1997 | 0.1031 | |||
| MA / Mastercard Incorporated | 0.00 | 0.09 | 0.60 | 2.56 | 0.1967 | -0.0313 | |||
| SO / The Southern Company | 0.01 | 18.09 | 0.58 | 17.89 | 0.1901 | -0.0016 | |||
| CI / The Cigna Group | 0.00 | 5.86 | 0.57 | 6.32 | 0.1875 | -0.0221 | |||
| SMCI / Super Micro Computer, Inc. | 0.01 | -36.93 | 0.57 | -9.73 | 0.1855 | -0.0588 | |||
| INGR / Ingredion Incorporated | 0.00 | 1.23 | 0.56 | 1.46 | 0.1821 | -0.0311 | |||
| MO / Altria Group, Inc. | 0.01 | 15.48 | 0.55 | 12.81 | 0.1789 | -0.0097 | |||
| HON / Honeywell International Inc. | 0.00 | -12.26 | 0.53 | -3.64 | 0.1735 | -0.0402 | |||
| PRU / Prudential Financial, Inc. | 0.00 | 1.21 | 0.50 | -2.71 | 0.1646 | -0.0364 | |||
| BAC / Bank of America Corporation | 0.01 | 0.49 | 0.50 | 13.90 | 0.1639 | -0.0071 | |||
| ETN / Eaton Corporation plc | 0.00 | -0.85 | 0.50 | 30.29 | 0.1636 | 0.0142 | |||
| CMG / Chipotle Mexican Grill, Inc. | 0.01 | 0.00 | 0.49 | 12.02 | 0.1617 | -0.0102 | |||
| MGK / Vanguard World Fund - Vanguard Mega Cap Growth ETF | 0.00 | 0.00 | 0.49 | 18.78 | 0.1594 | -0.0005 | |||
| UNH / UnitedHealth Group Incorporated | 0.00 | 22.77 | 0.48 | -26.88 | 0.1559 | -0.0976 | |||
| SSO / ProShares Trust - ProShares Ultra S&P500 | 0.00 | 0.00 | 0.47 | 18.00 | 0.1547 | -0.0011 | |||
| JNJ / Johnson & Johnson | 0.00 | 0.82 | 0.47 | -7.30 | 0.1542 | -0.0432 | |||
| ANET / Arista Networks Inc | 0.00 | -19.13 | 0.47 | 6.85 | 0.1533 | -0.0174 | |||
| CAT / Caterpillar Inc. | 0.00 | 0.17 | 0.47 | 17.93 | 0.1530 | -0.0013 | |||
| TNK / Teekay Tankers Ltd. | 0.01 | 0.00 | 0.47 | 8.88 | 0.1528 | -0.0139 | |||
| MET / MetLife, Inc. | 0.01 | 0.00 | 0.47 | 0.22 | 0.1527 | -0.0286 | |||
| CSX / CSX Corporation | 0.01 | -4.11 | 0.46 | 6.28 | 0.1497 | -0.0177 | |||
| PANW / Palo Alto Networks, Inc. | 0.00 | 0.48 | 0.43 | 20.51 | 0.1407 | 0.0019 | |||
| ALL / The Allstate Corporation | 0.00 | 16.67 | 0.42 | 13.44 | 0.1384 | -0.0067 | |||
| DUK / Duke Energy Corporation | 0.00 | 7.58 | 0.42 | 3.98 | 0.1371 | -0.0195 | |||
| TSCO / Tractor Supply Company | 0.01 | 0.00 | 0.42 | -4.36 | 0.1368 | -0.0330 | |||
| DIS / The Walt Disney Company | 0.00 | -5.39 | 0.41 | 19.01 | 0.1332 | -0.0000 | |||
| SEZL / Sezzle Inc. | 0.00 | 0.39 | 0.1272 | 0.1272 | |||||
| AMP / Ameriprise Financial, Inc. | 0.00 | 0.00 | 0.37 | 10.39 | 0.1219 | -0.0096 | |||
| CARR / Carrier Global Corporation | 0.01 | 0.37 | 0.1219 | 0.1219 | |||||
| MU / Micron Technology, Inc. | 0.00 | -3.21 | 0.37 | 37.41 | 0.1217 | 0.0163 | |||
| CRM / Salesforce, Inc. | 0.00 | -7.28 | 0.37 | -5.64 | 0.1205 | -0.0315 | |||
| TTD / The Trade Desk, Inc. | 0.01 | 0.00 | 0.36 | 31.39 | 0.1181 | 0.0114 | |||
| CRDO / Credo Technology Group Holding Ltd | 0.00 | 0.35 | 0.1151 | 0.1151 | |||||
| MCD / McDonald's Corporation | 0.00 | 19.94 | 0.35 | 12.14 | 0.1151 | -0.0069 | |||
| VRT / Vertiv Holdings Co | 0.00 | -10.18 | 0.35 | 60.27 | 0.1149 | 0.0294 | |||
| SPY / SPDR S&P 500 ETF | 0.00 | -1.40 | 0.35 | 9.09 | 0.1139 | -0.0104 | |||
| FSLR / First Solar, Inc. | 0.00 | 5.00 | 0.35 | 37.70 | 0.1138 | 0.0154 | |||
| RDDT / Reddit, Inc. | 0.00 | 14.85 | 0.35 | 65.07 | 0.1132 | 0.0316 | |||
| GE / General Electric Company | 0.00 | 3.00 | 0.34 | 32.31 | 0.1129 | 0.0116 | |||
| VO / Vanguard Index Funds - Vanguard Mid-Cap ETF | 0.00 | 0.34 | 0.1123 | 0.1123 | |||||
| CLS / Celestica Inc. | 0.00 | 0.34 | 0.1122 | 0.1122 | |||||
| ADBE / Adobe Inc. | 0.00 | 0.00 | 0.34 | 0.88 | 0.1121 | -0.0200 | |||
| COHR / Coherent Corp. | 0.00 | 0.34 | 0.1099 | 0.1099 | |||||
| SHOP / Shopify Inc. | 0.00 | -0.89 | 0.33 | 19.71 | 0.1097 | 0.0008 | |||
| PG / The Procter & Gamble Company | 0.00 | -17.25 | 0.32 | -22.60 | 0.1056 | -0.0567 | |||
| UBER / Uber Technologies, Inc. | 0.00 | -3.29 | 0.31 | 23.81 | 0.1022 | 0.0041 | |||
| INTC / Intel Corporation | 0.01 | -4.90 | 0.31 | -6.13 | 0.1002 | -0.0268 | |||
| T / AT&T Inc. | 0.01 | 1.33 | 0.30 | 3.75 | 0.0997 | -0.0146 | |||
| WMT / Walmart Inc. | 0.00 | -1.34 | 0.30 | 9.78 | 0.0993 | -0.0081 | |||
| AMAT / Applied Materials, Inc. | 0.00 | 0.00 | 0.30 | 26.05 | 0.0983 | 0.0056 | |||
| PYPL / PayPal Holdings, Inc. | 0.00 | 0.00 | 0.30 | 13.79 | 0.0973 | -0.0043 | |||
| IXUS / iShares Trust - iShares Core MSCI Total International Stock ETF | 0.00 | 0.30 | 0.0973 | 0.0973 | |||||
| PEY / Invesco Exchange-Traded Fund Trust - Invesco High Yield Equity Dividend Achievers ETF | 0.01 | 0.00 | 0.30 | -5.13 | 0.0972 | -0.0244 | |||
| SYK / Stryker Corporation | 0.00 | 7.14 | 0.30 | 13.85 | 0.0971 | -0.0043 | |||
| AEE / Ameren Corporation | 0.00 | 0.00 | 0.30 | -4.21 | 0.0970 | -0.0236 | |||
| GEV / GE Vernova Inc. | 0.00 | 0.29 | 0.0961 | 0.0961 | |||||
| GWW / W.W. Grainger, Inc. | 0.00 | 0.00 | 0.28 | 5.22 | 0.0926 | -0.0120 | |||
| FIX / Comfort Systems USA, Inc. | 0.00 | 0.28 | 0.0922 | 0.0922 | |||||
| VT / Vanguard International Equity Index Funds - Vanguard Total World Stock ETF | 0.00 | 0.00 | 0.28 | 10.67 | 0.0920 | -0.0067 | |||
| VZ / Verizon Communications Inc. | 0.01 | 25.07 | 0.28 | 19.15 | 0.0919 | 0.0003 | |||
| EMR / Emerson Electric Co. | 0.00 | 0.00 | 0.28 | 21.30 | 0.0917 | 0.0020 | |||
| O / Realty Income Corporation | 0.00 | 11.53 | 0.28 | 10.80 | 0.0909 | -0.0067 | |||
| XYZ / Block, Inc. | 0.00 | -10.76 | 0.27 | 11.34 | 0.0871 | -0.0057 | |||
| WM / Waste Management, Inc. | 0.00 | 4.51 | 0.27 | 3.52 | 0.0868 | -0.0131 | |||
| NRIM / Northrim BanCorp, Inc. | 0.00 | 0.00 | 0.26 | 27.80 | 0.0859 | 0.0057 | |||
| SCHX / Schwab Strategic Trust - Schwab U.S. Large-Cap ETF | 0.01 | 0.13 | 0.26 | 11.06 | 0.0855 | -0.0062 | |||
| IWM / iShares Trust - iShares Russell 2000 ETF | 0.00 | 0.00 | 0.26 | 8.33 | 0.0853 | -0.0085 | |||
| HOOD / Robinhood Markets, Inc. | 0.00 | 0.26 | 0.0837 | 0.0837 | |||||
| APP / AppLovin Corporation | 0.00 | 0.25 | 0.0831 | 0.0831 | |||||
| AGX / Argan, Inc. | 0.00 | 0.25 | 0.0828 | 0.0828 | |||||
| BHP / BHP Group Limited - Depositary Receipt (Common Stock) | 0.01 | 0.00 | 0.25 | -0.79 | 0.0820 | -0.0164 | |||
| VYM / Vanguard Whitehall Funds - Vanguard High Dividend Yield ETF | 0.00 | 0.00 | 0.25 | 3.32 | 0.0817 | -0.0123 | |||
| SNPS / Synopsys, Inc. | 0.00 | -17.67 | 0.25 | -1.60 | 0.0806 | -0.0168 | |||
| ES / Eversource Energy | 0.00 | 0.00 | 0.24 | 2.52 | 0.0799 | -0.0128 | |||
| SRAD / Sportradar Group AG | 0.01 | -22.67 | 0.24 | 0.42 | 0.0784 | -0.0144 | |||
| ABT / Abbott Laboratories | 0.00 | 1.83 | 0.23 | 4.61 | 0.0744 | -0.0103 | |||
| VTI / Vanguard Index Funds - Vanguard Total Stock Market ETF | 0.00 | 0.00 | 0.23 | 10.24 | 0.0742 | -0.0056 | |||
| LEN / Lennar Corporation | 0.00 | 0.00 | 0.23 | -3.85 | 0.0739 | -0.0173 | |||
| W7D / Workday, Inc. | 0.00 | 0.22 | 0.0727 | 0.0727 | |||||
| HUM / Humana Inc. | 0.00 | 4.48 | 0.22 | -3.57 | 0.0710 | -0.0165 | |||
| KO / The Coca-Cola Company | 0.00 | -22.99 | 0.21 | -23.84 | 0.0701 | -0.0394 | |||
| ALAB / Astera Labs, Inc. | 0.00 | 0.21 | 0.0677 | 0.0677 | |||||
| PLMR / Palomar Holdings, Inc. | 0.00 | -24.32 | 0.20 | -14.89 | 0.0657 | -0.0260 | |||
| BSCV / Invesco Exchange-Traded Self-Indexed Fund Trust - Invesco BulletShares 2031 Corporate Bond ETF | 0.01 | 0.19 | 0.0621 | 0.0621 | |||||
| BSCT / Invesco Exchange-Traded Self-Indexed Fund Trust - Invesco BulletShares 2029 Corporate Bond ETF | 0.01 | 0.19 | 0.0616 | 0.0616 | |||||
| SRTS / Sensus Healthcare, Inc. | 0.04 | 1.30 | 0.19 | 1.65 | 0.0607 | -0.0104 | |||
| OMER / Omeros Corporation | 0.06 | -4.76 | 0.18 | -65.18 | 0.0589 | -0.1426 | |||
| CDZI / Cadiz Inc. | 0.04 | 7.32 | 0.13 | 9.17 | 0.0431 | -0.0037 | |||
| EPSN / Epsilon Energy Ltd. | 0.01 | 0.00 | 0.09 | 3.66 | 0.0281 | -0.0039 | |||
| REI / Ring Energy, Inc. | 0.07 | 0.00 | 0.05 | -31.17 | 0.0175 | -0.0127 | |||
| BB / BlackBerry Limited | 0.01 | 0.00 | 0.05 | 21.62 | 0.0150 | 0.0003 | |||
| CIF / MFS Intermediate High Income Fund | 0.01 | 0.00 | 0.02 | 0.00 | 0.0081 | -0.0014 | |||
| ASRT / Assertio Holdings, Inc. | 0.03 | 19.00 | 0.02 | 13.33 | 0.0058 | -0.0003 | |||
| NCNO / nCino, Inc. | 0.00 | -100.00 | 0.00 | 0.0000 | |||||
| OKTA / Okta, Inc. | 0.00 | -100.00 | 0.00 | 0.0000 | |||||
| KRYS / Krystal Biotech, Inc. | 0.00 | -100.00 | 0.00 | 0.0000 | |||||
| PFE / Pfizer Inc. | 0.00 | -100.00 | 0.00 | 0.0000 | |||||
| JAMF / Jamf Holding Corp. | 0.00 | -100.00 | 0.00 | 0.0000 | |||||
| TW / Tradeweb Markets Inc. | 0.00 | -100.00 | 0.00 | 0.0000 | |||||
| EXEL / Exelixis, Inc. | 0.00 | -100.00 | 0.00 | 0.0000 | |||||
| UPWK / Upwork Inc. | 0.00 | -100.00 | 0.00 | 0.0000 | |||||
| PGR / The Progressive Corporation | 0.00 | -100.00 | 0.00 | 0.0000 | |||||
| EXLS / ExlService Holdings, Inc. | 0.00 | -100.00 | 0.00 | 0.0000 | |||||
| BBDC / Barings BDC, Inc. | 0.00 | -100.00 | 0.00 | 0.0000 |