Mga Batayang Estadistika
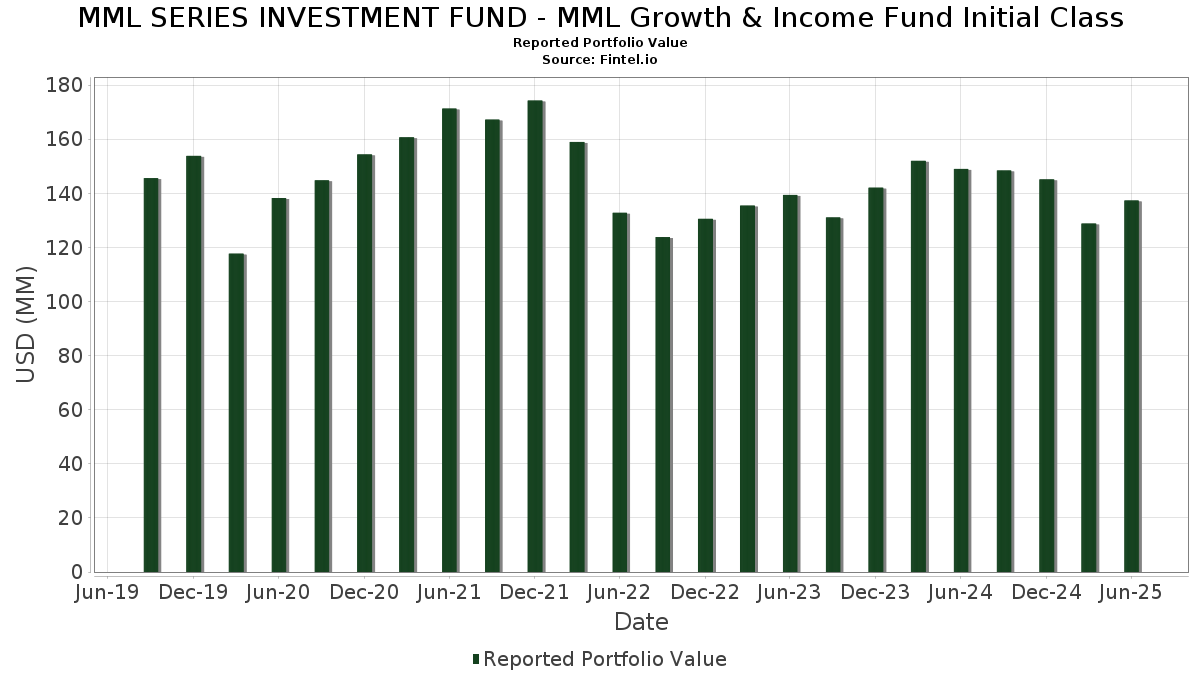
| Nilai Portofolio | $ 137,312,181 |
| Posisi Saat Ini | 107 |
Kepemilikan Terbaru, Kinerja, AUM (dari 13F, 13D)
MML SERIES INVESTMENT FUND - MML Growth & Income Fund Initial Class telah mengungkapkan total kepemilikan 107 dalam pengajuan SEC terbaru mereka. Nilai portofolio terbaru dihitung sebesar $ 137,312,181 USD. Aset yang Dikelola (AUM) sebenarnya adalah nilai ini ditambah kas (yang tidak diungkapkan). Aset-aset utama MML SERIES INVESTMENT FUND - MML Growth & Income Fund Initial Class adalah Microsoft Corporation (US:MSFT) , NVIDIA Corporation (US:NVDA) , Apple Inc. (US:AAPL) , Amazon.com, Inc. (US:AMZN) , and Alphabet Inc. (US:GOOGL) . Posisi baru MML SERIES INVESTMENT FUND - MML Growth & Income Fund Initial Class meliputi: Automatic Data Processing, Inc. (US:ADP) , The Williams Companies, Inc. (US:WMB) , Gilead Sciences, Inc. (US:GILD) , Cencora, Inc. (US:COR) , and .
Peningkatan Tertinggi Kuartal Ini
Kami menggunakan perubahan dalam alokasi portofolio karena ini adalah metrik yang paling bermakna. Perubahan dapat disebabkan oleh perdagangan atau perubahan harga saham.
| Keamanan | Saham (MM) |
Nilai (Juta Dolar AS) |
Portfolio % | ΔPorsyento ng Portfolio |
|---|---|---|---|---|
| 0.06 | 9.70 | 7.0647 | 2.0353 | |
| 0.02 | 4.40 | 3.2092 | 1.1247 | |
| 0.02 | 11.87 | 8.6515 | 1.0464 | |
| 0.00 | 0.76 | 0.5533 | 0.5533 | |
| 0.01 | 0.72 | 0.5256 | 0.5256 | |
| 0.00 | 1.49 | 1.0880 | 0.4726 | |
| 0.01 | 0.64 | 0.4662 | 0.4662 | |
| 0.01 | 4.00 | 2.9135 | 0.3370 | |
| 0.00 | 0.42 | 0.3039 | 0.3039 | |
| 0.04 | 1.90 | 1.3837 | 0.2849 |
Penurunan Tertinggi Kuartal Ini
Kami menggunakan perubahan dalam alokasi portofolio karena ini adalah metrik yang paling bermakna. Perubahan dapat disebabkan oleh perdagangan atau perubahan harga saham.
| Keamanan | Saham (MM) |
Nilai (Juta Dolar AS) |
Portfolio % | ΔPorsyento ng Portfolio |
|---|---|---|---|---|
| 0.00 | 0.77 | 0.5599 | -1.3675 | |
| 0.03 | 5.67 | 4.1308 | -0.8581 | |
| 0.00 | 0.05 | 0.0366 | -0.7468 | |
| 0.03 | 1.16 | 0.8483 | -0.3041 | |
| 0.02 | 0.71 | 0.5148 | -0.2560 | |
| 0.01 | 0.99 | 0.7192 | -0.2356 | |
| 0.01 | 1.23 | 0.8999 | -0.2179 | |
| 0.00 | 0.91 | 0.6653 | -0.2118 | |
| 0.01 | 1.22 | 0.8881 | -0.2076 | |
| 0.00 | 1.30 | 0.9500 | -0.1951 |
Pengajuan 13F dan Dana
Formulir ini diajukan pada 2025-08-25 untuk periode pelaporan 2025-06-30. Klik ikon tautan untuk melihat riwayat transaksi selengkapnya.
Tingkatkan ke versi premium untuk membuka data premium dan ekspor ke Excel. ![]() .
.
| Keamanan | Ketik | Harga Saham Rata-rata | Saham (MM) |
ΔSaham (%) |
ΔSaham (%) |
Nilai ($MM) |
Portpolyo (%) |
ΔPortofolio (%) |
|
|---|---|---|---|---|---|---|---|---|---|
| MSFT / Microsoft Corporation | 0.02 | -8.53 | 11.87 | 21.20 | 8.6515 | 1.0464 | |||
| NVDA / NVIDIA Corporation | 0.06 | 2.67 | 9.70 | 49.66 | 7.0647 | 2.0353 | |||
| AAPL / Apple Inc. | 0.03 | -4.49 | 5.67 | -11.78 | 4.1308 | -0.8581 | |||
| AMZN / Amazon.com, Inc. | 0.02 | -5.38 | 5.19 | 9.13 | 3.7805 | 0.0890 | |||
| GOOGL / Alphabet Inc. | 0.03 | -5.06 | 5.19 | 8.20 | 3.7801 | 0.0576 | |||
| AVGO / Broadcom Inc. | 0.02 | -0.37 | 4.40 | 64.08 | 3.2092 | 1.1247 | |||
| META / Meta Platforms, Inc. | 0.01 | -5.92 | 4.00 | 20.49 | 2.9135 | 0.3370 | |||
| MA / Mastercard Incorporated | 0.00 | -2.88 | 2.62 | -0.42 | 1.9086 | -0.1336 | |||
| JPM / JPMorgan Chase & Co. | 0.01 | -16.46 | 2.28 | -1.26 | 1.6626 | -0.1316 | |||
| HD / The Home Depot, Inc. | 0.01 | -2.03 | 2.00 | -2.01 | 1.4593 | -0.1270 | |||
| TSLA / Tesla, Inc. | 0.01 | -1.99 | 1.98 | 20.10 | 1.4463 | 0.1636 | |||
| NEE / NextEra Energy, Inc. | 0.03 | -1.91 | 1.96 | -3.97 | 1.4273 | -0.1558 | |||
| TYIA / Johnson Controls International plc | 0.02 | -4.49 | 1.92 | 25.95 | 1.4008 | 0.2156 | |||
| BAC / Bank of America Corporation | 0.04 | 18.31 | 1.90 | 34.13 | 1.3837 | 0.2849 | |||
| MS / Morgan Stanley | 0.01 | -2.36 | 1.81 | 17.86 | 1.3181 | 0.1269 | |||
| IBM / International Business Machines Corporation | 0.01 | 6.75 | 1.79 | 26.50 | 1.3049 | 0.2063 | |||
| ADI / Analog Devices, Inc. | 0.01 | 3.63 | 1.74 | 22.29 | 1.2677 | 0.1634 | |||
| LLY / Eli Lilly and Company | 0.00 | -2.20 | 1.70 | -7.68 | 1.2355 | -0.1906 | |||
| PG / The Procter & Gamble Company | 0.01 | 0.00 | 1.68 | -6.55 | 1.2276 | -0.1714 | |||
| CDNS / Cadence Design Systems, Inc. | 0.01 | -2.55 | 1.57 | 18.10 | 1.1416 | 0.1115 | |||
| SPGI / S&P Global Inc. | 0.00 | -2.58 | 1.55 | 1.11 | 1.1308 | -0.0609 | |||
| LIN / Linde plc | 0.00 | 0.00 | 1.50 | 0.74 | 1.0951 | -0.0628 | |||
| NFLX / Netflix, Inc. | 0.00 | 31.18 | 1.49 | 88.51 | 1.0880 | 0.4726 | |||
| TJX / The TJX Companies, Inc. | 0.01 | -2.75 | 1.44 | -1.37 | 1.0500 | -0.0846 | |||
| V / Visa Inc. | 0.00 | 6.96 | 1.43 | 8.31 | 1.0455 | 0.0176 | |||
| EQIX / Equinix, Inc. | 0.00 | -9.40 | 1.30 | -11.60 | 0.9500 | -0.1951 | |||
| ABBV / AbbVie Inc. | 0.01 | -3.19 | 1.23 | -14.25 | 0.8999 | -0.2179 | |||
| CSA / Accenture plc | 0.00 | 0.00 | 1.22 | -4.23 | 0.8908 | -0.1000 | |||
| PLD / Prologis, Inc. | 0.01 | -8.17 | 1.22 | -13.68 | 0.8881 | -0.2076 | |||
| DHR / Danaher Corporation | 0.01 | -3.21 | 1.22 | -6.68 | 0.8856 | -0.1260 | |||
| RF / Regions Financial Corporation | 0.05 | -3.43 | 1.20 | 4.54 | 0.8736 | -0.0169 | |||
| SLB / Schlumberger Limited | 0.03 | -3.01 | 1.16 | -21.56 | 0.8483 | -0.3041 | |||
| MSI / Motorola Solutions, Inc. | 0.00 | 3.84 | 1.16 | -0.26 | 0.8447 | -0.0577 | |||
| CI / The Cigna Group | 0.00 | -3.50 | 1.16 | -3.02 | 0.8431 | -0.0833 | |||
| 3EC / Eaton Corporation plc | 0.00 | -10.18 | 1.12 | 17.99 | 0.8127 | 0.0787 | |||
| XYL / Xylem Inc. | 0.01 | 0.00 | 1.11 | 8.22 | 0.8065 | 0.0130 | |||
| AXP / American Express Company | 0.00 | -3.59 | 1.10 | 14.29 | 0.8052 | 0.0547 | |||
| SYY / Sysco Corporation | 0.01 | -3.57 | 1.06 | -2.67 | 0.7719 | -0.0731 | |||
| MET / MetLife, Inc. | 0.01 | 0.00 | 1.06 | 0.19 | 0.7719 | -0.0492 | |||
| LNG / Cheniere Energy, Inc. | 0.00 | 0.00 | 1.05 | 5.30 | 0.7675 | -0.0095 | |||
| COST / Costco Wholesale Corporation | 0.00 | -3.73 | 1.05 | 0.77 | 0.7639 | -0.0438 | |||
| HLT / Hilton Worldwide Holdings Inc. | 0.00 | -3.98 | 1.03 | 12.39 | 0.7542 | 0.0392 | |||
| HON / Honeywell International Inc. | 0.00 | -4.05 | 1.03 | 5.56 | 0.7479 | -0.0072 | |||
| ZTS / Zoetis Inc. | 0.01 | 3.18 | 1.01 | -2.33 | 0.7330 | -0.0661 | |||
| ECL / Ecolab Inc. | 0.00 | -3.90 | 1.00 | 2.14 | 0.7312 | -0.0315 | |||
| ISRG / Intuitive Surgical, Inc. | 0.00 | -4.07 | 1.00 | 5.27 | 0.7286 | -0.0089 | |||
| PEP / PepsiCo, Inc. | 0.01 | -8.86 | 0.99 | -19.77 | 0.7192 | -0.2356 | |||
| AMP / Ameriprise Financial, Inc. | 0.00 | 0.00 | 0.98 | 10.28 | 0.7117 | 0.0239 | |||
| CMI / Cummins Inc. | 0.00 | -17.15 | 0.94 | -13.47 | 0.6883 | -0.1588 | |||
| IDXX / IDEXX Laboratories, Inc. | 0.00 | -4.21 | 0.93 | 22.30 | 0.6761 | 0.0873 | |||
| TSCO / Tractor Supply Company | 0.02 | 0.00 | 0.92 | -4.26 | 0.6722 | -0.0756 | |||
| UNP / Union Pacific Corporation | 0.00 | -17.02 | 0.91 | -19.22 | 0.6653 | -0.2118 | |||
| BKNG / Booking Holdings Inc. | 0.00 | 0.00 | 0.91 | 25.59 | 0.6623 | 0.1008 | |||
| BLK / BlackRock, Inc. | 0.00 | -4.42 | 0.91 | 5.96 | 0.6606 | -0.0037 | |||
| CMG / Chipotle Mexican Grill, Inc. | 0.02 | 0.00 | 0.89 | 11.75 | 0.6520 | 0.0308 | |||
| UBER / Uber Technologies, Inc. | 0.01 | -7.50 | 0.85 | 18.44 | 0.6182 | 0.0622 | |||
| WDAY / Workday, Inc. | 0.00 | -4.49 | 0.85 | -1.85 | 0.6180 | -0.0528 | |||
| ASML / ASML Holding N.V. | 0.00 | -5.00 | 0.81 | 14.96 | 0.5881 | 0.0430 | |||
| ICE / Intercontinental Exchange, Inc. | 0.00 | 0.00 | 0.79 | 6.34 | 0.5749 | -0.0010 | |||
| VRTX / Vertex Pharmaceuticals Incorporated | 0.00 | 13.35 | 0.79 | 4.11 | 0.5729 | -0.0135 | |||
| TMO / Thermo Fisher Scientific Inc. | 0.00 | 0.00 | 0.78 | -18.54 | 0.5702 | -0.1754 | |||
| KKR / KKR & Co. Inc. | 0.01 | -5.02 | 0.77 | 9.38 | 0.5612 | 0.0141 | |||
| UNH / UnitedHealth Group Incorporated | 0.00 | -48.04 | 0.77 | -69.06 | 0.5599 | -1.3675 | |||
| PGR / The Progressive Corporation | 0.00 | 0.00 | 0.76 | -5.69 | 0.5558 | -0.0722 | |||
| ADP / Automatic Data Processing, Inc. | 0.00 | 0.76 | 0.5533 | 0.5533 | |||||
| MMC / Marsh & McLennan Companies, Inc. | 0.00 | 0.00 | 0.76 | -10.41 | 0.5517 | -0.1044 | |||
| FI / Fiserv, Inc. | 0.00 | 15.50 | 0.75 | -9.83 | 0.5486 | -0.0996 | |||
| ANET / Arista Networks Inc | 0.01 | -5.40 | 0.75 | 24.92 | 0.5444 | 0.0801 | |||
| DE / Deere & Company | 0.00 | 0.00 | 0.74 | 8.30 | 0.5428 | 0.0090 | |||
| PH / Parker-Hannifin Corporation | 0.00 | -26.21 | 0.74 | -15.22 | 0.5359 | -0.1375 | |||
| WMB / The Williams Companies, Inc. | 0.01 | 0.72 | 0.5256 | 0.5256 | |||||
| CHD / Church & Dwight Co., Inc. | 0.01 | 0.00 | 0.71 | -12.71 | 0.5206 | -0.1147 | |||
| VZ / Verizon Communications Inc. | 0.02 | -25.40 | 0.71 | -28.83 | 0.5148 | -0.2560 | |||
| CRWD / CrowdStrike Holdings, Inc. | 0.00 | -13.26 | 0.68 | 25.28 | 0.4955 | 0.0742 | |||
| BALL / Ball Corporation | 0.01 | 11.33 | 0.67 | 19.93 | 0.4870 | 0.0544 | |||
| CRM / Salesforce, Inc. | 0.00 | -5.91 | 0.66 | -4.46 | 0.4842 | -0.0554 | |||
| DT / Dynatrace, Inc. | 0.01 | 10.78 | 0.64 | 29.76 | 0.4671 | 0.0835 | |||
| GILD / Gilead Sciences, Inc. | 0.01 | 0.64 | 0.4662 | 0.4662 | |||||
| URI / United Rentals, Inc. | 0.00 | -6.53 | 0.61 | 12.25 | 0.4480 | 0.0232 | |||
| FERG / Ferguson Enterprises Inc. | 0.00 | -6.47 | 0.60 | 27.02 | 0.4357 | 0.0705 | |||
| CDW / CDW Corporation | 0.00 | -5.72 | 0.60 | 5.11 | 0.4352 | -0.0061 | |||
| CPRT / Copart, Inc. | 0.01 | 42.59 | 0.58 | 23.77 | 0.4213 | 0.0583 | |||
| GEV / GE Vernova Inc. | 0.00 | -7.13 | 0.57 | 61.13 | 0.4168 | 0.1409 | |||
| NOW / ServiceNow, Inc. | 0.00 | 0.00 | 0.55 | 29.15 | 0.3978 | 0.0696 | |||
| LKQ / LKQ Corporation | 0.01 | 0.00 | 0.54 | -13.02 | 0.3944 | -0.0886 | |||
| MRK / Merck & Co., Inc. | 0.01 | -6.79 | 0.54 | -17.86 | 0.3927 | -0.1163 | |||
| CL / Colgate-Palmolive Company | 0.01 | 0.00 | 0.54 | -2.90 | 0.3907 | -0.0384 | |||
| FDX / FedEx Corporation | 0.00 | 0.00 | 0.46 | -6.83 | 0.3386 | -0.0483 | |||
| A / Agilent Technologies, Inc. | 0.00 | -8.50 | 0.46 | -7.66 | 0.3340 | -0.0515 | |||
| COR / Cencora, Inc. | 0.00 | 0.42 | 0.3039 | 0.3039 | |||||
| AMAT / Applied Materials, Inc. | 0.00 | -35.29 | 0.39 | -18.43 | 0.2808 | -0.0857 | |||
| MDB / MongoDB, Inc. | 0.00 | 0.00 | 0.36 | 19.74 | 0.2653 | 0.0292 | |||
| KMX / CarMax, Inc. | 0.01 | 0.00 | 0.36 | -13.77 | 0.2606 | -0.0613 | |||
| BMY / Bristol-Myers Squibb Company | 0.01 | 0.00 | 0.36 | -24.09 | 0.2595 | -0.1048 | |||
| FIXED INC CLEARING CORP.REPO / RA (000000000) | 0.36 | 0.2595 | 0.2595 | ||||||
| ARM / Arm Holdings plc - Depositary Receipt (Common Stock) | 0.00 | 0.00 | 0.34 | 51.34 | 0.2477 | 0.0735 | |||
| DECK / Deckers Outdoor Corporation | 0.00 | 21.18 | 0.32 | 11.58 | 0.2320 | 0.0107 | |||
| ABNB / Airbnb, Inc. | 0.00 | 0.00 | 0.28 | 10.67 | 0.2043 | 0.0078 | |||
| EOG / EOG Resources, Inc. | 0.00 | -36.28 | 0.25 | -40.75 | 0.1850 | -0.1466 | |||
| FWONK / Formula One Group | 0.00 | 0.00 | 0.25 | 16.11 | 0.1788 | 0.0147 | |||
| SBAC / SBA Communications Corporation | 0.00 | 0.20 | 0.1424 | 0.1424 | |||||
| IVV / iShares Trust - iShares Core S&P 500 ETF | 0.00 | -95.49 | 0.05 | -95.04 | 0.0366 | -0.7468 | |||
| PURCHASED USD / SOLD EUR / DFE (000000000) | -0.00 | -0.0003 | -0.0003 | ||||||
| XS1450864779 / China Government Bond - JPMorgan Chase | -0.00 | -0.0025 | -0.0025 | ||||||
| PURCHASED USD / SOLD EUR / DFE (000000000) | -0.00 | -0.0025 | -0.0025 | ||||||
| US90269A5341 / UBSW (LUV) (conv) 4.25% 2/6/2020 | -0.00 | -0.0025 | -0.0025 | ||||||
| PURCHASED USD / SOLD EUR / DFE (000000000) | -0.00 | -0.0026 | -0.0026 |