Mga Batayang Estadistika
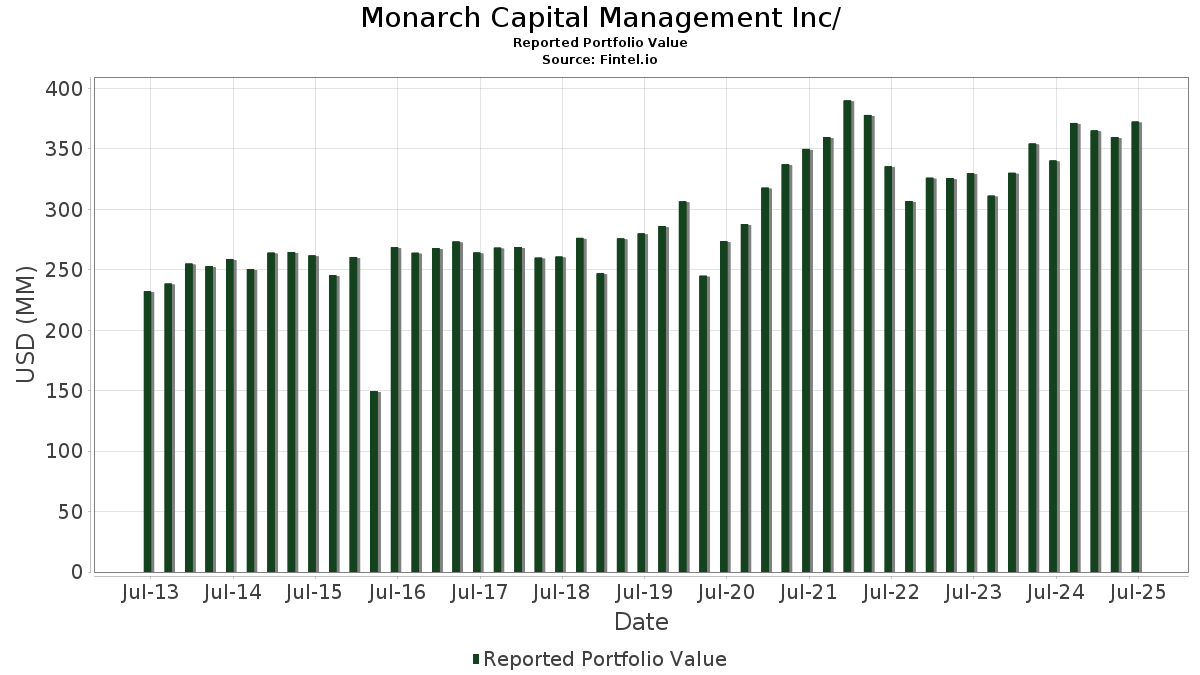
| Nilai Portofolio | $ 372,493,093 |
| Posisi Saat Ini | 117 |
Kepemilikan Terbaru, Kinerja, AUM (dari 13F, 13D)
Monarch Capital Management Inc/ telah mengungkapkan total kepemilikan 117 dalam pengajuan SEC terbaru mereka. Nilai portofolio terbaru dihitung sebesar $ 372,493,093 USD. Aset yang Dikelola (AUM) sebenarnya adalah nilai ini ditambah kas (yang tidak diungkapkan). Aset-aset utama Monarch Capital Management Inc/ adalah Microsoft Corporation (US:MSFT) , Apple Inc. (US:AAPL) , Walmart Inc. (US:WMT) , The Home Depot, Inc. (US:HD) , and McDonald's Corporation (US:MCD) . Posisi baru Monarch Capital Management Inc/ meliputi: NVIDIA Corporation (US:NVDA) , Hecla Mining Company (US:HL) , .
Peningkatan Tertinggi Kuartal Ini
Kami menggunakan perubahan dalam alokasi portofolio karena ini adalah metrik yang paling bermakna. Perubahan dapat disebabkan oleh perdagangan atau perubahan harga saham.
| Keamanan | Saham (MM) |
Nilai (Juta Dolar AS) |
Portfolio % | ΔPorsyento ng Portfolio |
|---|---|---|---|---|
| 0.05 | 24.46 | 6.5677 | 1.3339 | |
| 0.02 | 8.20 | 2.2021 | 0.5719 | |
| 0.10 | 2.94 | 0.7888 | 0.2789 | |
| 0.06 | 7.90 | 2.1201 | 0.2255 | |
| 0.04 | 7.03 | 1.8873 | 0.2133 | |
| 0.14 | 9.77 | 2.6238 | 0.2116 | |
| 0.02 | 6.38 | 1.7123 | 0.1749 | |
| 0.02 | 1.88 | 0.5055 | 0.1195 | |
| 0.02 | 2.55 | 0.6844 | 0.1029 | |
| 0.00 | 0.36 | 0.0969 | 0.0969 |
Penurunan Tertinggi Kuartal Ini
Kami menggunakan perubahan dalam alokasi portofolio karena ini adalah metrik yang paling bermakna. Perubahan dapat disebabkan oleh perdagangan atau perubahan harga saham.
| Keamanan | Saham (MM) |
Nilai (Juta Dolar AS) |
Portfolio % | ΔPorsyento ng Portfolio |
|---|---|---|---|---|
| 0.05 | 9.54 | 2.5600 | -0.4299 | |
| 0.04 | 11.15 | 2.9930 | -0.3852 | |
| 0.03 | 5.23 | 1.4034 | -0.3842 | |
| 0.12 | 9.72 | 2.6105 | -0.3839 | |
| 0.06 | 9.51 | 2.5540 | -0.2970 | |
| 0.07 | 13.74 | 3.6886 | -0.2655 | |
| 0.05 | 7.28 | 1.9542 | -0.2351 | |
| 0.04 | 3.20 | 0.8593 | -0.2230 | |
| 0.05 | 5.54 | 1.4886 | -0.1815 | |
| 0.10 | 6.93 | 1.8609 | -0.1814 |
Pengajuan 13F dan Dana
Formulir ini diajukan pada 2025-08-20 untuk periode pelaporan 2025-06-30. Klik ikon tautan untuk melihat riwayat transaksi selengkapnya.
Tingkatkan ke versi premium untuk membuka data premium dan ekspor ke Excel. ![]() .
.
| Keamanan | Ketik | Harga Saham Rata-rata | Saham (MM) |
ΔSaham (%) |
ΔSaham (%) |
Nilai ($MM) |
Portpolyo (%) |
ΔPortofolio (%) |
|
|---|---|---|---|---|---|---|---|---|---|
| MSFT / Microsoft Corporation | 0.05 | -1.96 | 24.46 | 29.91 | 6.5677 | 1.3339 | |||
| AAPL / Apple Inc. | 0.07 | 4.56 | 13.74 | -3.42 | 3.6886 | -0.2655 | |||
| WMT / Walmart Inc. | 0.13 | -4.32 | 13.01 | 6.32 | 3.4921 | 0.0918 | |||
| HD / The Home Depot, Inc. | 0.03 | 0.25 | 12.28 | 0.29 | 3.2975 | -0.1063 | |||
| MCD / McDonald's Corporation | 0.04 | -1.94 | 11.15 | -8.28 | 2.9930 | -0.3852 | |||
| ADP / Automatic Data Processing, Inc. | 0.04 | -1.38 | 10.94 | -0.45 | 2.9378 | -0.1175 | |||
| KR / The Kroger Co. | 0.14 | -0.20 | 10.25 | 5.76 | 2.7520 | 0.0581 | |||
| CSCO / Cisco Systems, Inc. | 0.14 | 0.16 | 9.77 | 12.61 | 2.6238 | 0.2116 | |||
| MRK / Merck & Co., Inc. | 0.12 | 2.24 | 9.72 | -9.75 | 2.6105 | -0.3839 | |||
| ABBV / AbbVie Inc. | 0.05 | 0.06 | 9.54 | -11.36 | 2.5600 | -0.4299 | |||
| JNJ / Johnson & Johnson | 0.06 | 0.69 | 9.51 | -7.26 | 2.5540 | -0.2970 | |||
| LKFN / Lakeland Financial Corporation | 0.15 | 1.13 | 9.49 | 4.55 | 2.5487 | 0.0248 | |||
| FELE / Franklin Electric Co., Inc. | 0.10 | 0.69 | 8.74 | -3.76 | 2.3466 | -0.1774 | |||
| PWR / Quanta Services, Inc. | 0.02 | -5.98 | 8.20 | 39.85 | 2.2021 | 0.5719 | |||
| EMR / Emerson Electric Co. | 0.06 | -4.73 | 7.90 | 15.86 | 2.1201 | 0.2255 | |||
| ABT / Abbott Laboratories | 0.05 | -1.93 | 7.30 | 0.56 | 1.9598 | -0.0579 | |||
| PG / The Procter & Gamble Company | 0.05 | -1.15 | 7.28 | -7.59 | 1.9542 | -0.2351 | |||
| GOOG / Alphabet Inc. | 0.04 | 2.79 | 7.03 | 16.72 | 1.8873 | 0.2133 | |||
| KO / The Coca-Cola Company | 0.10 | -4.53 | 6.93 | -5.68 | 1.8609 | -0.1814 | |||
| JPM / JPMorgan Chase & Co. | 0.02 | -2.44 | 6.38 | 15.31 | 1.7123 | 0.1749 | |||
| AFL / Aflac Incorporated | 0.06 | -0.41 | 6.21 | -5.55 | 1.6683 | -0.1603 | |||
| USB / U.S. Bancorp | 0.13 | 2.78 | 6.10 | 9.64 | 1.6369 | 0.0912 | |||
| SYK / Stryker Corporation | 0.01 | -3.26 | 5.71 | 2.75 | 1.5330 | -0.0116 | |||
| XOM / Exxon Mobil Corporation | 0.05 | 1.81 | 5.54 | -7.72 | 1.4886 | -0.1815 | |||
| MDT / Medtronic plc | 0.06 | 0.65 | 5.40 | -2.32 | 1.4497 | -0.0867 | |||
| ACN / Accenture plc | 0.02 | 2.65 | 5.32 | -1.68 | 1.4274 | -0.0755 | |||
| FI / Fiserv, Inc. | 0.03 | 4.10 | 5.23 | -18.72 | 1.4034 | -0.3842 | |||
| GILD / Gilead Sciences, Inc. | 0.04 | -0.09 | 4.95 | -1.14 | 1.3289 | -0.0628 | |||
| MMM / 3M Company | 0.03 | -0.89 | 4.70 | 2.73 | 1.2608 | -0.0097 | |||
| FFIV / F5, Inc. | 0.02 | 1.83 | 4.43 | 12.55 | 1.1896 | 0.0954 | |||
| SYY / Sysco Corporation | 0.06 | -1.01 | 4.40 | -0.07 | 1.1802 | -0.0426 | |||
| CINF / Cincinnati Financial Corporation | 0.03 | -0.35 | 4.21 | 0.41 | 1.1303 | -0.0354 | |||
| GPC / Genuine Parts Company | 0.03 | 4.69 | 4.11 | 6.59 | 1.1028 | 0.0316 | |||
| NEE / NextEra Energy, Inc. | 0.06 | 1.32 | 4.07 | -0.78 | 1.0933 | -0.0475 | |||
| STLD / Steel Dynamics, Inc. | 0.03 | 2.62 | 4.04 | 5.02 | 1.0847 | 0.0154 | |||
| APD / Air Products and Chemicals, Inc. | 0.01 | 5.87 | 3.55 | 1.26 | 0.9525 | -0.0214 | |||
| ZBH / Zimmer Biomet Holdings, Inc. | 0.04 | 2.02 | 3.20 | -17.82 | 0.8593 | -0.2230 | |||
| UPS / United Parcel Service, Inc. | 0.03 | 0.06 | 3.00 | -8.16 | 0.8065 | -0.1028 | |||
| CCRD / CoreCard Corporation | 0.10 | 3.44 | 2.94 | 60.20 | 0.7888 | 0.2789 | |||
| GOOGL / Alphabet Inc. | 0.02 | -1.86 | 2.92 | 11.82 | 0.7852 | 0.0583 | |||
| PFE / Pfizer Inc. | 0.12 | 3.75 | 2.91 | -0.75 | 0.7817 | -0.0337 | |||
| CARR / Carrier Global Corporation | 0.04 | 2.13 | 2.86 | 17.87 | 0.7686 | 0.0937 | |||
| BRK.B / Berkshire Hathaway Inc. | 0.01 | 0.57 | 2.81 | -8.26 | 0.7543 | -0.0970 | |||
| VWO / Vanguard International Equity Index Funds - Vanguard FTSE Emerging Markets ETF | 0.06 | -0.67 | 2.73 | 8.56 | 0.7326 | 0.0339 | |||
| FLS / Flowserve Corporation | 0.05 | 4.48 | 2.62 | 12.01 | 0.7036 | 0.0532 | |||
| VTIP / Vanguard Malvern Funds - Vanguard Short-Term Inflation-Protected Securities ETF | 0.05 | -3.61 | 2.56 | -2.89 | 0.6861 | -0.0454 | |||
| DIS / The Walt Disney Company | 0.02 | -3.02 | 2.55 | 21.85 | 0.6844 | 0.1029 | |||
| RTX / RTX Corporation | 0.02 | -0.30 | 2.44 | 9.92 | 0.6544 | 0.0380 | |||
| GE / General Electric Company | 0.01 | -8.85 | 2.19 | 17.01 | 0.5875 | 0.0677 | |||
| CB / Chubb Limited | 0.01 | 3.11 | 2.07 | -1.05 | 0.5567 | -0.0258 | |||
| INTC / Intel Corporation | 0.09 | -0.74 | 2.02 | -2.13 | 0.5430 | -0.0312 | |||
| CVX / Chevron Corporation | 0.01 | 1.92 | 2.02 | -12.77 | 0.5413 | -0.1011 | |||
| PM / Philip Morris International Inc. | 0.01 | -5.05 | 1.93 | 8.78 | 0.5189 | 0.0253 | |||
| DG / Dollar General Corporation | 0.02 | 4.23 | 1.88 | 35.59 | 0.5055 | 0.1195 | |||
| RCI / Rogers Communications Inc. | 0.06 | 13.27 | 1.84 | 24.88 | 0.4947 | 0.0847 | |||
| VZ / Verizon Communications Inc. | 0.04 | 4.66 | 1.84 | -0.16 | 0.4934 | -0.0183 | |||
| PPL / PPL Corporation | 0.05 | 1.05 | 1.57 | -5.14 | 0.4216 | -0.0385 | |||
| PEP / PepsiCo, Inc. | 0.01 | 20.51 | 1.46 | 6.10 | 0.3920 | 0.0096 | |||
| TGT / Target Corporation | 0.01 | 2.63 | 1.44 | -2.96 | 0.3869 | -0.0260 | |||
| SMG / The Scotts Miracle-Gro Company | 0.02 | 6.20 | 1.43 | 27.58 | 0.3852 | 0.0727 | |||
| OKE / ONEOK, Inc. | 0.02 | 14.86 | 1.36 | -5.48 | 0.3658 | -0.0349 | |||
| LMT / Lockheed Martin Corporation | 0.00 | 10.98 | 1.35 | 15.12 | 0.3619 | 0.0363 | |||
| AES / The AES Corporation | 0.13 | 12.00 | 1.34 | -5.12 | 0.3584 | -0.0327 | |||
| GWW / W.W. Grainger, Inc. | 0.00 | 1.59 | 1.33 | 7.02 | 0.3561 | 0.0115 | |||
| LLY / Eli Lilly and Company | 0.00 | 17.83 | 1.26 | 11.29 | 0.3388 | 0.0234 | |||
| REGN / Regeneron Pharmaceuticals, Inc. | 0.00 | 67.02 | 1.23 | 38.31 | 0.3305 | 0.0830 | |||
| BMY / Bristol-Myers Squibb Company | 0.02 | 0.19 | 1.13 | -23.92 | 0.3039 | -0.1098 | |||
| GEV / GE Vernova Inc. | 0.00 | -8.31 | 1.03 | 58.98 | 0.2759 | 0.0962 | |||
| ADM / Archer-Daniels-Midland Company | 0.02 | 19.92 | 0.98 | 31.85 | 0.2636 | 0.0566 | |||
| LIN / Linde plc | 0.00 | -3.08 | 0.93 | -2.42 | 0.2496 | -0.0150 | |||
| OTIS / Otis Worldwide Corporation | 0.01 | -1.09 | 0.90 | -5.05 | 0.2423 | -0.0220 | |||
| WBA / Walgreens Boots Alliance, Inc. | 0.08 | -1.67 | 0.90 | 1.01 | 0.2407 | -0.0059 | |||
| COST / Costco Wholesale Corporation | 0.00 | 0.12 | 0.85 | 4.84 | 0.2270 | 0.0027 | |||
| ORCL / Oracle Corporation | 0.00 | 0.00 | 0.84 | 56.40 | 0.2265 | 0.0765 | |||
| PLXS / Plexus Corp. | 0.01 | 0.00 | 0.83 | 5.58 | 0.2234 | 0.0044 | |||
| J / Jacobs Solutions Inc. | 0.01 | -2.32 | 0.83 | 6.15 | 0.2228 | 0.0056 | |||
| NTRS / Northern Trust Corporation | 0.01 | -8.91 | 0.82 | 16.93 | 0.2209 | 0.0253 | |||
| WFC / Wells Fargo & Company | 0.01 | 0.52 | 0.80 | 12.20 | 0.2150 | 0.0166 | |||
| SPY / SPDR S&P 500 ETF | 0.00 | -1.96 | 0.78 | 8.24 | 0.2081 | 0.0090 | |||
| ZIMV / ZimVie Inc. | 0.08 | 15.31 | 0.75 | -0.13 | 0.2017 | -0.0075 | |||
| BRK.A / Berkshire Hathaway Inc. | 0.00 | 0.00 | 0.73 | -8.77 | 0.1957 | -0.0263 | |||
| V / Visa Inc. | 0.00 | 5.43 | 0.72 | 6.79 | 0.1944 | 0.0060 | |||
| NSC / Norfolk Southern Corporation | 0.00 | -1.89 | 0.66 | 5.92 | 0.1780 | 0.0042 | |||
| CPRT / Copart, Inc. | 0.01 | -2.00 | 0.66 | -15.04 | 0.1777 | -0.0388 | |||
| CL / Colgate-Palmolive Company | 0.01 | 0.00 | 0.66 | -2.96 | 0.1759 | -0.0118 | |||
| CHKP / Check Point Software Technologies Ltd. | 0.00 | 6.19 | 0.62 | 3.19 | 0.1652 | -0.0007 | |||
| BP / BP p.l.c. - Depositary Receipt (Common Stock) | 0.02 | -2.40 | 0.61 | -13.53 | 0.1631 | -0.0322 | |||
| KMB / Kimberly-Clark Corporation | 0.00 | 1.89 | 0.57 | -7.49 | 0.1526 | -0.0183 | |||
| MO / Altria Group, Inc. | 0.01 | -7.66 | 0.56 | -9.82 | 0.1504 | -0.0224 | |||
| AMZN / Amazon.com, Inc. | 0.00 | 28.21 | 0.55 | 47.99 | 0.1483 | 0.0444 | |||
| CTAS / Cintas Corporation | 0.00 | 0.00 | 0.53 | 8.32 | 0.1436 | 0.0065 | |||
| CAT / Caterpillar Inc. | 0.00 | 0.00 | 0.48 | 17.94 | 0.1289 | 0.0155 | |||
| DE / Deere & Company | 0.00 | 0.00 | 0.46 | 8.43 | 0.1243 | 0.0055 | |||
| SHW / The Sherwin-Williams Company | 0.00 | 0.30 | 0.46 | -1.29 | 0.1231 | -0.0061 | |||
| TSM / Taiwan Semiconductor Manufacturing Company Limited - Depositary Receipt (Common Stock) | 0.00 | 0.25 | 0.45 | 36.78 | 0.1209 | 0.0293 | |||
| ELV / Elevance Health, Inc. | 0.00 | 0.00 | 0.45 | -10.58 | 0.1204 | -0.0190 | |||
| PNC / The PNC Financial Services Group, Inc. | 0.00 | 0.00 | 0.42 | 6.08 | 0.1127 | 0.0027 | |||
| T / AT&T Inc. | 0.01 | -3.91 | 0.41 | -1.67 | 0.1108 | -0.0059 | |||
| NUE / Nucor Corporation | 0.00 | -12.31 | 0.41 | -5.79 | 0.1095 | -0.0106 | |||
| VEA / Vanguard Tax-Managed Funds - Vanguard FTSE Developed Markets ETF | 0.01 | -4.49 | 0.39 | 7.18 | 0.1042 | 0.0035 | |||
| ITW / Illinois Tool Works Inc. | 0.00 | 0.00 | 0.38 | -0.27 | 0.1009 | -0.0038 | |||
| CNI / Canadian National Railway Company | 0.00 | 9.95 | 0.37 | 17.52 | 0.0992 | 0.0117 | |||
| NVDA / NVIDIA Corporation | 0.00 | 0.36 | 0.0969 | 0.0969 | |||||
| FRME / First Merchants Corporation | 0.01 | 0.00 | 0.34 | -5.28 | 0.0917 | -0.0085 | |||
| NKE / NIKE, Inc. | 0.00 | 3.86 | 0.33 | 16.01 | 0.0876 | 0.0095 | |||
| IWP / iShares Trust - iShares Russell Mid-Cap Growth ETF | 0.00 | 0.00 | 0.31 | 17.74 | 0.0840 | 0.0103 | |||
| VTWO / Vanguard Scottsdale Funds - Vanguard Russell 2000 ETF | 0.00 | 29.13 | 0.31 | 39.82 | 0.0830 | 0.0215 | |||
| BKH / Black Hills Corporation | 0.01 | 0.00 | 0.31 | -7.53 | 0.0826 | -0.0099 | |||
| COP / ConocoPhillips | 0.00 | 0.07 | 0.26 | -14.61 | 0.0708 | -0.0149 | |||
| IBM / International Business Machines Corporation | 0.00 | 0.00 | 0.25 | 18.48 | 0.0673 | 0.0085 | |||
| VTI / Vanguard Index Funds - Vanguard Total Stock Market ETF | 0.00 | 0.00 | 0.24 | 11.11 | 0.0645 | 0.0043 | |||
| MDLZ / Mondelez International, Inc. | 0.00 | 0.72 | 0.24 | 0.00 | 0.0638 | -0.0022 | |||
| NI / NiSource Inc. | 0.01 | 0.00 | 0.22 | 0.47 | 0.0582 | -0.0017 | |||
| AMGN / Amgen Inc. | 0.00 | 0.00 | 0.21 | -10.17 | 0.0570 | -0.0088 | |||
| TXN / Texas Instruments Incorporated | 0.00 | 0.21 | 0.0561 | 0.0561 | |||||
| IWM / iShares Trust - iShares Russell 2000 ETF | 0.00 | 0.21 | 0.0553 | 0.0553 | |||||
| HL / Hecla Mining Company | 0.01 | 0.07 | 0.0175 | 0.0175 | |||||
| VRA / Vera Bradley, Inc. | 0.00 | -100.00 | 0.00 | 0.0000 | |||||
| STZ / Constellation Brands, Inc. | 0.00 | -100.00 | 0.00 | 0.0000 |