Mga Batayang Estadistika
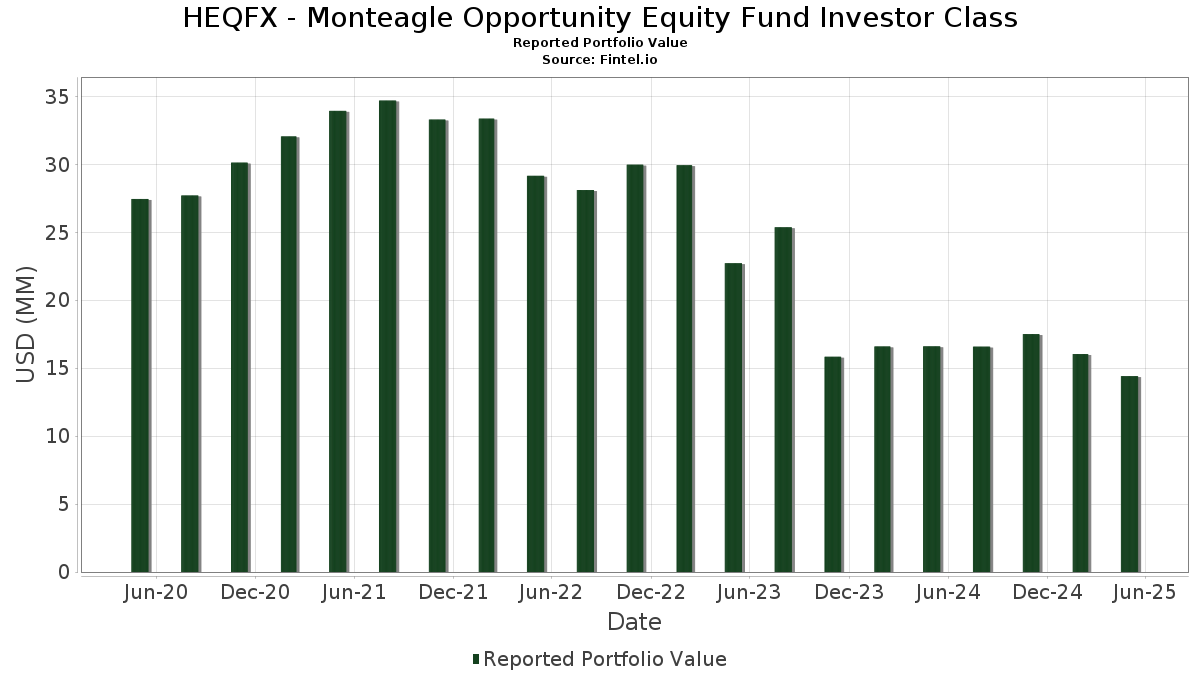
| Nilai Portofolio | $ 14,413,354 |
| Posisi Saat Ini | 145 |
Kepemilikan Terbaru, Kinerja, AUM (dari 13F, 13D)
HEQFX - Monteagle Opportunity Equity Fund Investor Class telah mengungkapkan total kepemilikan 145 dalam pengajuan SEC terbaru mereka. Nilai portofolio terbaru dihitung sebesar $ 14,413,354 USD. Aset yang Dikelola (AUM) sebenarnya adalah nilai ini ditambah kas (yang tidak diungkapkan). Aset-aset utama HEQFX - Monteagle Opportunity Equity Fund Investor Class adalah OGE Energy Corp. (US:OGE) , W. P. Carey Inc. (US:WPC) , American States Water Company (US:AWR) , Mid-America Apartment Communities, Inc. (US:MAA) , and CBRE Group, Inc. (US:CBRE) .
Peningkatan Tertinggi Kuartal Ini
Kami menggunakan perubahan dalam alokasi portofolio karena ini adalah metrik yang paling bermakna. Perubahan dapat disebabkan oleh perdagangan atau perubahan harga saham.
| Keamanan | Saham (MM) |
Nilai (Juta Dolar AS) |
Portfolio % | ΔPorsyento ng Portfolio |
|---|---|---|---|---|
| 0.00 | 0.12 | 0.8000 | 0.3100 | |
| 0.00 | 0.13 | 0.8900 | 0.2400 | |
| 0.00 | 0.12 | 0.8600 | 0.2200 | |
| 0.00 | 0.11 | 0.7400 | 0.2200 | |
| 0.00 | 0.09 | 0.6200 | 0.1800 | |
| 0.00 | 0.15 | 1.0200 | 0.1700 | |
| 0.00 | 0.12 | 0.8200 | 0.1700 | |
| 0.01 | 0.12 | 0.8000 | 0.1700 | |
| 0.02 | 0.08 | 0.5800 | 0.1700 | |
| 0.00 | 0.11 | 0.7400 | 0.1600 |
Penurunan Tertinggi Kuartal Ini
Kami menggunakan perubahan dalam alokasi portofolio karena ini adalah metrik yang paling bermakna. Perubahan dapat disebabkan oleh perdagangan atau perubahan harga saham.
| Keamanan | Saham (MM) |
Nilai (Juta Dolar AS) |
Portfolio % | ΔPorsyento ng Portfolio |
|---|---|---|---|---|
| 0.00 | 0.08 | 0.5300 | -0.6900 | |
| 0.00 | 0.08 | 0.5800 | -0.4100 | |
| 0.00 | 0.08 | 0.5600 | -0.3900 | |
| 0.00 | 0.09 | 0.5900 | -0.3100 | |
| 0.11 | 0.11 | 0.7600 | -0.3000 | |
| 0.00 | 0.08 | 0.5500 | -0.3000 | |
| 0.00 | 0.15 | 1.0300 | -0.2800 | |
| 0.00 | 0.08 | 0.5500 | -0.2600 | |
| 0.00 | 0.11 | 0.7600 | -0.2200 | |
| 0.00 | 0.08 | 0.5400 | -0.2200 |
Pengajuan 13F dan Dana
Formulir ini diajukan pada 2025-07-30 untuk periode pelaporan 2025-05-31. Klik ikon tautan untuk melihat riwayat transaksi selengkapnya.
Tingkatkan ke versi premium untuk membuka data premium dan ekspor ke Excel. ![]() .
.
| Keamanan | Ketik | Harga Saham Rata-rata | Saham (MM) |
ΔSaham (%) |
ΔSaham (%) |
Nilai ($MM) |
Portpolyo (%) |
ΔPortofolio (%) |
|
|---|---|---|---|---|---|---|---|---|---|
| OGE / OGE Energy Corp. | 0.00 | 0.00 | 0.19 | -4.12 | 1.3000 | 0.0900 | |||
| WPC / W. P. Carey Inc. | 0.00 | 0.00 | 0.18 | -2.13 | 1.2800 | 0.1000 | |||
| AWR / American States Water Company | 0.00 | 0.00 | 0.16 | 3.23 | 1.1100 | 0.1400 | |||
| MAA / Mid-America Apartment Communities, Inc. | 0.00 | 0.00 | 0.16 | -7.14 | 1.0900 | 0.0400 | |||
| CBRE / CBRE Group, Inc. | 0.00 | 0.00 | 0.15 | -11.76 | 1.0400 | -0.0200 | |||
| DNOW / DNOW Inc. | 0.01 | 0.00 | 0.15 | -9.70 | 1.0300 | 0.0000 | |||
| AYI / Acuity Inc. | 0.00 | 0.00 | 0.15 | -12.43 | 1.0300 | -0.0300 | |||
| NFG / National Fuel Gas Company | 0.00 | -36.00 | 0.15 | -30.00 | 1.0300 | -0.2800 | |||
| MLI / Mueller Industries, Inc. | 0.00 | 0.00 | 0.15 | -3.29 | 1.0200 | 0.0700 | |||
| CVLT / Commvault Systems, Inc. | 0.00 | 0.00 | 0.15 | 7.35 | 1.0200 | 0.1700 | |||
| BRC / Brady Corporation | 0.00 | 0.00 | 0.15 | -3.95 | 1.0200 | 0.0700 | |||
| BKH / Black Hills Corporation | 0.00 | 0.00 | 0.15 | -3.95 | 1.0100 | 0.0600 | |||
| IDCC / InterDigital, Inc. | 0.00 | -26.57 | 0.14 | -25.54 | 0.9500 | -0.2000 | |||
| IBKR / Interactive Brokers Group, Inc. | 0.00 | 0.00 | 0.14 | 3.01 | 0.9500 | 0.1200 | |||
| MSM / MSC Industrial Direct Co., Inc. | 0.00 | 0.00 | 0.13 | 1.54 | 0.9200 | 0.1000 | |||
| INCY / Incyte Corporation | 0.00 | 0.00 | 0.13 | -11.72 | 0.8900 | -0.0200 | |||
| ATEN / A10 Networks, Inc. | 0.01 | 0.00 | 0.13 | -16.88 | 0.8900 | -0.0800 | |||
| CPT / Camden Property Trust | 0.00 | 0.00 | 0.13 | -5.19 | 0.8900 | 0.0500 | |||
| UVV / Universal Corporation | 0.00 | 0.00 | 0.13 | 22.12 | 0.8900 | 0.2400 | |||
| PSA / Public Storage | 0.00 | 0.00 | 0.13 | 1.60 | 0.8800 | 0.1000 | |||
| RNR / RenaissanceRe Holdings Ltd. | 0.00 | 0.00 | 0.13 | 5.00 | 0.8800 | 0.1300 | |||
| G / Genpact Limited | 0.00 | 0.00 | 0.12 | -19.48 | 0.8700 | -0.0900 | |||
| FTDR / Frontdoor, Inc. | 0.00 | 0.00 | 0.12 | 21.57 | 0.8600 | 0.2200 | |||
| TSEM / Tower Semiconductor Ltd. | 0.00 | 0.00 | 0.12 | -7.52 | 0.8600 | 0.0300 | |||
| RF / Regions Financial Corporation | 0.01 | 0.00 | 0.12 | -9.56 | 0.8600 | 0.0100 | |||
| FR / First Industrial Realty Trust, Inc. | 0.00 | 0.00 | 0.12 | -13.57 | 0.8400 | -0.0400 | |||
| CHKP / Check Point Software Technologies Ltd. | 0.00 | 0.00 | 0.12 | 3.45 | 0.8400 | 0.1100 | |||
| STAG / STAG Industrial, Inc. | 0.00 | 0.00 | 0.12 | -1.67 | 0.8200 | 0.0700 | |||
| CALM / Cal-Maine Foods, Inc. | 0.00 | 0.00 | 0.12 | 6.31 | 0.8200 | 0.1200 | |||
| GSL / Global Ship Lease, Inc. | 0.00 | 0.00 | 0.12 | 13.46 | 0.8200 | 0.1700 | |||
| CCI / Crown Castle Inc. | 0.00 | 0.00 | 0.12 | 7.27 | 0.8200 | 0.1300 | |||
| GM / General Motors Company | 0.00 | 0.00 | 0.12 | 0.86 | 0.8200 | 0.0900 | |||
| WSM / Williams-Sonoma, Inc. | 0.00 | 0.00 | 0.12 | -16.43 | 0.8100 | -0.0700 | |||
| CUBE / CubeSmart | 0.00 | 0.00 | 0.12 | 3.57 | 0.8100 | 0.1100 | |||
| ZM / Zoom Communications Inc. | 0.00 | 0.00 | 0.12 | 10.48 | 0.8100 | 0.1500 | |||
| DRI / Darden Restaurants, Inc. | 0.00 | -30.24 | 0.12 | -25.16 | 0.8100 | -0.1600 | |||
| EME / EMCOR Group, Inc. | 0.00 | -32.23 | 0.12 | -21.62 | 0.8100 | -0.1200 | |||
| STRL / Sterling Infrastructure, Inc. | 0.00 | 0.00 | 0.12 | 47.44 | 0.8000 | 0.3100 | |||
| UTHR / United Therapeutics Corporation | 0.00 | 0.00 | 0.12 | -0.86 | 0.8000 | 0.0800 | |||
| HIG / The Hartford Insurance Group, Inc. | 0.00 | 0.00 | 0.12 | 9.52 | 0.8000 | 0.1400 | |||
| DLO / DLocal Limited | 0.01 | 0.00 | 0.12 | 13.86 | 0.8000 | 0.1700 | |||
| OZK / Bank OZK | 0.00 | 0.00 | 0.12 | -7.26 | 0.8000 | 0.0200 | |||
| EG / Everest Group, Ltd. | 0.00 | 0.00 | 0.11 | -1.72 | 0.8000 | 0.0700 | |||
| GIL / Gildan Activewear Inc. | 0.00 | 0.00 | 0.11 | -13.64 | 0.7900 | -0.0400 | |||
| PATH / UiPath Inc. | 0.01 | 0.00 | 0.11 | 8.57 | 0.7900 | 0.1300 | |||
| CXM / Sprinklr, Inc. | 0.01 | 0.00 | 0.11 | 0.00 | 0.7900 | 0.0800 | |||
| KVUE / Kenvue Inc. | 0.00 | 0.00 | 0.11 | 0.89 | 0.7900 | 0.0900 | |||
| AIT / Applied Industrial Technologies, Inc. | 0.00 | 0.00 | 0.11 | -9.60 | 0.7900 | 0.0100 | |||
| YOU / Clear Secure, Inc. | 0.00 | 0.00 | 0.11 | 4.63 | 0.7800 | 0.1000 | |||
| INMD / InMode Ltd. | 0.01 | 0.00 | 0.11 | -22.22 | 0.7800 | -0.1200 | |||
| VC / Visteon Corporation | 0.00 | 0.00 | 0.11 | -2.61 | 0.7800 | 0.0600 | |||
| BYD / Boyd Gaming Corporation | 0.00 | 0.00 | 0.11 | -1.75 | 0.7800 | 0.0700 | |||
| RMD / ResMed Inc. | 0.00 | 0.00 | 0.11 | 4.76 | 0.7700 | 0.1100 | |||
| CRH / CRH plc | 0.00 | 0.00 | 0.11 | -11.38 | 0.7600 | -0.0100 | |||
| AXS / AXIS Capital Holdings Limited | 0.00 | -34.85 | 0.11 | -30.57 | 0.7600 | -0.2200 | |||
| GOIXX / Federated Hermes Money Market Obligations Trust - Federated Hermes Gov Oblig Fd Inst Shs USD | 0.11 | -35.51 | 0.11 | -35.50 | 0.7600 | -0.3000 | |||
| QLYS / Qualys, Inc. | 0.00 | 0.00 | 0.11 | 5.88 | 0.7500 | 0.1100 | |||
| LKQ / LKQ Corporation | 0.00 | 0.00 | 0.11 | -3.60 | 0.7400 | 0.0400 | |||
| HNI / HNI Corporation | 0.00 | 0.00 | 0.11 | 0.00 | 0.7400 | 0.0700 | |||
| WNS / WNS (Holdings) Limited | 0.00 | 0.00 | 0.11 | 1.92 | 0.7400 | 0.0900 | |||
| SIG / Signet Jewelers Limited | 0.00 | 0.00 | 0.11 | 27.71 | 0.7400 | 0.2200 | |||
| LDOS / Leidos Holdings, Inc. | 0.00 | 0.00 | 0.11 | 13.98 | 0.7400 | 0.1600 | |||
| CPRX / Catalyst Pharmaceuticals, Inc. | 0.00 | -32.11 | 0.11 | -25.87 | 0.7400 | -0.1600 | |||
| BMO / Bank of Montreal | 0.00 | -32.05 | 0.11 | -28.86 | 0.7400 | -0.1900 | |||
| CTSH / Cognizant Technology Solutions Corporation | 0.00 | 0.00 | 0.11 | -2.78 | 0.7300 | 0.0500 | |||
| VCTR / Victory Capital Holdings, Inc. | 0.00 | 0.00 | 0.11 | -2.78 | 0.7300 | 0.0500 | |||
| FHI / Federated Hermes, Inc. | 0.00 | -32.20 | 0.10 | -26.24 | 0.7300 | -0.1500 | |||
| ABM / ABM Industries Incorporated | 0.00 | 0.00 | 0.10 | -3.74 | 0.7200 | 0.0500 | |||
| DCI / Donaldson Company, Inc. | 0.00 | 0.00 | 0.10 | 1.00 | 0.7000 | 0.0700 | |||
| JHG / Janus Henderson Group plc | 0.00 | 0.00 | 0.10 | -13.68 | 0.7000 | -0.0300 | |||
| USB / U.S. Bancorp | 0.00 | 0.00 | 0.10 | -7.41 | 0.7000 | 0.0300 | |||
| HSIC / Henry Schein, Inc. | 0.00 | 0.00 | 0.10 | -2.91 | 0.6900 | 0.0500 | |||
| PNC / The PNC Financial Services Group, Inc. | 0.00 | 0.00 | 0.10 | -9.17 | 0.6900 | 0.0100 | |||
| PLUS / ePlus inc. | 0.00 | 0.00 | 0.10 | 11.24 | 0.6900 | 0.1300 | |||
| AGCO / AGCO Corporation | 0.00 | 0.00 | 0.10 | 1.04 | 0.6800 | 0.0800 | |||
| ACIW / ACI Worldwide, Inc. | 0.00 | 0.00 | 0.10 | -20.00 | 0.6700 | -0.0800 | |||
| DLB / Dolby Laboratories, Inc. | 0.00 | 0.00 | 0.10 | -9.43 | 0.6700 | 0.0100 | |||
| BCC / Boise Cascade Company | 0.00 | 0.00 | 0.10 | -16.67 | 0.6600 | -0.0500 | |||
| EVR / Evercore Inc. | 0.00 | 0.00 | 0.09 | -4.08 | 0.6600 | 0.0400 | |||
| VLO / Valero Energy Corporation | 0.00 | 0.00 | 0.09 | -1.05 | 0.6500 | 0.0500 | |||
| NOMD / Nomad Foods Limited | 0.01 | 0.00 | 0.09 | -6.93 | 0.6500 | 0.0200 | |||
| ADM / Archer-Daniels-Midland Company | 0.00 | 0.00 | 0.09 | 2.20 | 0.6500 | 0.0800 | |||
| FITB / Fifth Third Bancorp | 0.00 | 0.00 | 0.09 | -12.26 | 0.6500 | -0.0200 | |||
| SRAD / Sportradar Group AG | 0.00 | -37.32 | 0.09 | -30.83 | 0.6400 | -0.1900 | |||
| CW / Curtiss-Wright Corporation | 0.00 | -39.60 | 0.09 | -18.02 | 0.6400 | -0.0500 | |||
| MOH / Molina Healthcare, Inc. | 0.00 | 0.00 | 0.09 | 1.11 | 0.6300 | 0.0700 | |||
| LOGI / Logitech International S.A. | 0.00 | 0.00 | 0.09 | -16.51 | 0.6300 | -0.0500 | |||
| NVMI / Nova Ltd. | 0.00 | 0.00 | 0.09 | -10.78 | 0.6300 | -0.0100 | |||
| TXT / Textron Inc. | 0.00 | 0.00 | 0.09 | -1.11 | 0.6200 | 0.0500 | |||
| OC / Owens Corning | 0.00 | 0.00 | 0.09 | -12.75 | 0.6200 | -0.0200 | |||
| HII / Huntington Ingalls Industries, Inc. | 0.00 | 0.00 | 0.09 | 27.14 | 0.6200 | 0.1800 | |||
| POWL / Powell Industries, Inc. | 0.00 | 0.00 | 0.09 | 0.00 | 0.6200 | 0.0600 | |||
| LSTR / Landstar System, Inc. | 0.00 | 0.00 | 0.09 | -13.59 | 0.6200 | -0.0200 | |||
| WOR / Worthington Enterprises, Inc. | 0.00 | -35.77 | 0.09 | -9.18 | 0.6200 | 0.0000 | |||
| COCO / The Vita Coco Company, Inc. | 0.00 | -36.33 | 0.09 | -30.40 | 0.6100 | -0.1800 | |||
| ICL / ICL Group Ltd | 0.01 | 0.00 | 0.09 | 10.13 | 0.6100 | 0.1100 | |||
| TNK / Teekay Tankers Ltd. | 0.00 | 0.00 | 0.09 | 16.22 | 0.6000 | 0.1400 | |||
| ODFL / Old Dominion Freight Line, Inc. | 0.00 | 0.00 | 0.09 | -9.47 | 0.6000 | 0.0000 | |||
| STLAP / Stellantis N.V. | 0.01 | 0.00 | 0.09 | -20.37 | 0.6000 | -0.0700 | |||
| ASO / Academy Sports and Outdoors, Inc. | 0.00 | 0.00 | 0.09 | -18.27 | 0.6000 | -0.0500 | |||
| COF / Capital One Financial Corporation | 0.00 | -37.59 | 0.09 | -40.97 | 0.5900 | -0.3100 | |||
| BTG / B2Gold Corp. | 0.02 | 0.00 | 0.08 | 25.76 | 0.5800 | 0.1700 | |||
| EXPE / Expedia Group, Inc. | 0.00 | -37.61 | 0.08 | -47.47 | 0.5800 | -0.4100 | |||
| COLM / Columbia Sportswear Company | 0.00 | 0.00 | 0.08 | -26.36 | 0.5600 | -0.1300 | |||
| FULT / Fulton Financial Corporation | 0.00 | 0.00 | 0.08 | -12.90 | 0.5600 | -0.0200 | |||
| FDX / FedEx Corporation | 0.00 | 0.00 | 0.08 | -17.53 | 0.5600 | -0.0500 | |||
| YUMC / Yum China Holdings, Inc. | 0.00 | -40.17 | 0.08 | -47.37 | 0.5600 | -0.3900 | |||
| BAX / Baxter International Inc. | 0.00 | 0.00 | 0.08 | -11.11 | 0.5600 | -0.0100 | |||
| KNF / Knife River Corporation | 0.00 | -37.46 | 0.08 | -38.76 | 0.5500 | -0.2600 | |||
| SNA / Snap-on Incorporated | 0.00 | -38.50 | 0.08 | -42.65 | 0.5500 | -0.3000 | |||
| ARCB / ArcBest Corporation | 0.00 | 0.00 | 0.08 | -20.41 | 0.5400 | -0.0800 | |||
| KR / The Kroger Co. | 0.00 | -39.17 | 0.08 | -36.07 | 0.5400 | -0.2200 | |||
| SLF / Sun Life Financial Inc. | 0.00 | -39.46 | 0.08 | -30.00 | 0.5400 | -0.1500 | |||
| SU / Suncor Energy Inc. | 0.00 | 0.00 | 0.08 | -6.10 | 0.5300 | 0.0100 | |||
| DOCS / Doximity, Inc. | 0.00 | -46.96 | 0.08 | -61.03 | 0.5300 | -0.6900 | |||
| MHO / M/I Homes, Inc. | 0.00 | 0.00 | 0.08 | -9.52 | 0.5300 | 0.0000 | |||
| CNA / CNA Financial Corporation | 0.00 | 0.00 | 0.08 | -2.56 | 0.5300 | 0.0400 | |||
| TEX / Terex Corporation | 0.00 | 0.00 | 0.08 | 10.14 | 0.5300 | 0.1000 | |||
| MEDP / Medpace Holdings, Inc. | 0.00 | 0.00 | 0.08 | -9.52 | 0.5300 | 0.0000 | |||
| ACGL / Arch Capital Group Ltd. | 0.00 | 0.00 | 0.08 | 2.70 | 0.5300 | 0.0700 | |||
| RJF / Raymond James Financial, Inc. | 0.00 | 0.00 | 0.07 | -5.19 | 0.5100 | 0.0300 | |||
| DVN / Devon Energy Corporation | 0.00 | 0.00 | 0.07 | -16.09 | 0.5100 | -0.0400 | |||
| BLDR / Builders FirstSource, Inc. | 0.00 | 0.00 | 0.07 | -22.58 | 0.5000 | -0.0900 | |||
| WEN / The Wendy's Company | 0.01 | 0.00 | 0.07 | -26.60 | 0.4800 | -0.1100 | |||
| CRL / Charles River Laboratories International, Inc. | 0.00 | 0.00 | 0.07 | -18.29 | 0.4700 | -0.0500 | |||
| MTH / Meritage Homes Corporation | 0.00 | 0.00 | 0.07 | -11.84 | 0.4700 | -0.0100 | |||
| GEF / Greif, Inc. | 0.00 | 0.00 | 0.07 | -2.94 | 0.4600 | 0.0300 | |||
| HUM / Humana Inc. | 0.00 | 0.00 | 0.07 | -13.33 | 0.4500 | -0.0200 | |||
| EMN / Eastman Chemical Company | 0.00 | 0.00 | 0.06 | -20.00 | 0.4500 | -0.0500 | |||
| ZBH / Zimmer Biomet Holdings, Inc. | 0.00 | 0.00 | 0.06 | -12.33 | 0.4500 | -0.0100 | |||
| SON / Sonoco Products Company | 0.00 | 0.00 | 0.06 | -4.55 | 0.4400 | 0.0200 | |||
| SIRI / Sirius XM Holdings Inc. | 0.00 | 0.00 | 0.06 | -10.29 | 0.4300 | 0.0000 | |||
| LBRT / Liberty Energy Inc. | 0.01 | 0.00 | 0.06 | -33.33 | 0.4200 | -0.1400 | |||
| TFX / Teleflex Incorporated | 0.00 | 0.00 | 0.06 | -7.81 | 0.4100 | 0.0100 | |||
| TU / TELUS Corporation | 0.00 | 0.00 | 0.06 | 7.27 | 0.4100 | 0.0600 | |||
| PAGS / PagSeguro Digital Ltd. | 0.01 | 0.00 | 0.06 | 21.28 | 0.4000 | 0.1000 | |||
| EA / Electronic Arts Inc. | 0.00 | 0.00 | 0.05 | 10.20 | 0.3800 | 0.0700 | |||
| PII / Polaris Inc. | 0.00 | 0.00 | 0.05 | -13.79 | 0.3500 | -0.0100 | |||
| LYB / LyondellBasell Industries N.V. | 0.00 | 0.00 | 0.05 | -27.54 | 0.3500 | -0.0800 | |||
| CAL / Caleres, Inc. | 0.00 | 0.00 | 0.05 | -16.07 | 0.3300 | -0.0200 | |||
| TRMD / TORM plc | 0.00 | 0.00 | 0.05 | -9.80 | 0.3200 | 0.0000 | |||
| SM / SM Energy Company | 0.00 | 0.00 | 0.05 | -28.12 | 0.3200 | -0.0800 | |||
| AMR / Alpha Metallurgical Resources, Inc. | 0.00 | 0.00 | 0.04 | -18.87 | 0.3000 | -0.0400 | |||
| RES / RPC, Inc. | 0.01 | 0.00 | 0.04 | -19.61 | 0.2900 | -0.0300 | |||
| HAL / Halliburton Company | 0.00 | 0.00 | 0.04 | -26.00 | 0.2600 | -0.0500 |