Mga Batayang Estadistika
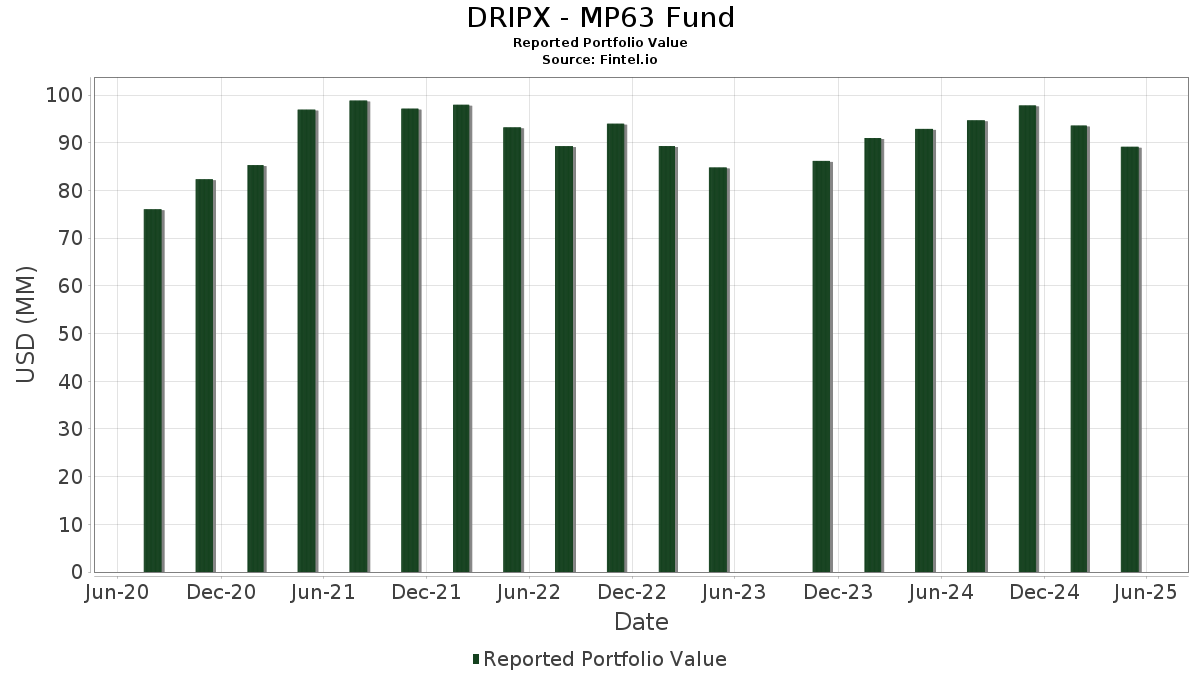
| Nilai Portofolio | $ 89,161,248 |
| Posisi Saat Ini | 66 |
Kepemilikan Terbaru, Kinerja, AUM (dari 13F, 13D)
DRIPX - MP63 Fund telah mengungkapkan total kepemilikan 66 dalam pengajuan SEC terbaru mereka. Nilai portofolio terbaru dihitung sebesar $ 89,161,248 USD. Aset yang Dikelola (AUM) sebenarnya adalah nilai ini ditambah kas (yang tidak diungkapkan). Aset-aset utama DRIPX - MP63 Fund adalah The Travelers Companies, Inc. (US:TRV) , Microsoft Corporation (US:MSFT) , RTX Corporation (US:RTX) , Waste Management, Inc. (US:WM) , and Alphabet Inc. (US:GOOGL) . Posisi baru DRIPX - MP63 Fund meliputi: Target Corporation (US:TGT) , Walmart Inc. (US:WMT) , .
Peningkatan Tertinggi Kuartal Ini
Kami menggunakan perubahan dalam alokasi portofolio karena ini adalah metrik yang paling bermakna. Perubahan dapat disebabkan oleh perdagangan atau perubahan harga saham.
| Keamanan | Saham (MM) |
Nilai (Juta Dolar AS) |
Portfolio % | ΔPorsyento ng Portfolio |
|---|---|---|---|---|
| 0.01 | 2.83 | 3.1700 | 0.3900 | |
| 0.00 | 0.28 | 0.3100 | 0.3100 | |
| 0.00 | 0.34 | 0.3800 | 0.2900 | |
| 0.00 | 0.23 | 0.2600 | 0.2600 | |
| 0.02 | 1.64 | 1.8400 | 0.2400 | |
| 0.01 | 2.33 | 2.6100 | 0.1700 | |
| 0.00 | 0.92 | 1.0300 | 0.1600 | |
| 0.01 | 2.53 | 2.8400 | 0.1400 | |
| 0.01 | 1.54 | 1.7300 | 0.1400 | |
| 0.03 | 2.03 | 2.2800 | 0.1300 |
Penurunan Tertinggi Kuartal Ini
Kami menggunakan perubahan dalam alokasi portofolio karena ini adalah metrik yang paling bermakna. Perubahan dapat disebabkan oleh perdagangan atau perubahan harga saham.
| Keamanan | Saham (MM) |
Nilai (Juta Dolar AS) |
Portfolio % | ΔPorsyento ng Portfolio |
|---|---|---|---|---|
| 0.51 | 0.51 | 0.5700 | -0.5400 | |
| 0.00 | 1.47 | 1.6400 | -0.3000 | |
| 0.00 | 1.63 | 1.8300 | -0.2800 | |
| 0.01 | 1.44 | 1.6200 | -0.2800 | |
| 0.00 | 0.21 | 0.2300 | -0.2600 | |
| 0.01 | 1.61 | 1.8000 | -0.2100 | |
| 0.01 | 0.78 | 0.8700 | -0.1700 | |
| 0.02 | 1.25 | 1.4000 | -0.1600 | |
| 0.01 | 0.93 | 1.0400 | -0.1400 | |
| 0.01 | 1.67 | 1.8700 | -0.1300 |
Pengajuan 13F dan Dana
Formulir ini diajukan pada 2025-07-30 untuk periode pelaporan 2025-05-31. Klik ikon tautan untuk melihat riwayat transaksi selengkapnya.
Tingkatkan ke versi premium untuk membuka data premium dan ekspor ke Excel. ![]() .
.
| Keamanan | Ketik | Harga Saham Rata-rata | Saham (MM) |
ΔSaham (%) |
ΔSaham (%) |
Nilai ($MM) |
Portpolyo (%) |
ΔPortofolio (%) |
|
|---|---|---|---|---|---|---|---|---|---|
| TRV / The Travelers Companies, Inc. | 0.01 | -6.86 | 2.88 | -0.66 | 3.2200 | 0.1200 | |||
| MSFT / Microsoft Corporation | 0.01 | -5.96 | 2.83 | 9.09 | 3.1700 | 0.3900 | |||
| RTX / RTX Corporation | 0.02 | -9.03 | 2.64 | -6.62 | 2.9500 | -0.0700 | |||
| WM / Waste Management, Inc. | 0.01 | -2.98 | 2.53 | 0.44 | 2.8400 | 0.1400 | |||
| GOOGL / Alphabet Inc. | 0.01 | -5.03 | 2.39 | -4.21 | 2.6800 | 0.0100 | |||
| CAT / Caterpillar Inc. | 0.01 | 0.97 | 2.33 | 2.15 | 2.6100 | 0.1700 | |||
| PAYX / Paychex, Inc. | 0.01 | -5.23 | 2.24 | -1.32 | 2.5000 | 0.0800 | |||
| QCOM / QUALCOMM Incorporated | 0.01 | 2.52 | 2.11 | -5.30 | 2.3600 | -0.0200 | |||
| GLW / Corning Incorporated | 0.04 | 1.42 | 2.05 | 0.29 | 2.3000 | 0.1100 | |||
| NEE / NextEra Energy, Inc. | 0.03 | 0.21 | 2.03 | 0.89 | 2.2800 | 0.1300 | |||
| UNP / Union Pacific Corporation | 0.01 | 1.52 | 2.02 | -8.81 | 2.2600 | -0.1100 | |||
| RPM / RPM International Inc. | 0.02 | -0.79 | 2.02 | -8.85 | 2.2600 | -0.1100 | |||
| EMR / Emerson Electric Co. | 0.02 | 0.33 | 2.00 | -1.53 | 2.2400 | 0.0700 | |||
| BAC / Bank of America Corporation | 0.04 | 0.20 | 1.82 | -4.07 | 2.0300 | 0.0100 | |||
| XOM / Exxon Mobil Corporation | 0.02 | 0.06 | 1.81 | -8.04 | 2.0200 | -0.0800 | |||
| ABT / Abbott Laboratories | 0.01 | -0.43 | 1.79 | -3.61 | 2.0000 | 0.0200 | |||
| ITW / Illinois Tool Works Inc. | 0.01 | 0.11 | 1.78 | -7.09 | 2.0000 | -0.0500 | |||
| DE / Deere & Company | 0.00 | -5.01 | 1.78 | 0.06 | 1.9900 | 0.0900 | |||
| DUK / Duke Energy Corporation | 0.02 | -2.93 | 1.78 | -2.74 | 1.9900 | 0.0400 | |||
| ECL / Ecolab Inc. | 0.01 | -2.76 | 1.75 | -4.01 | 1.9600 | 0.0100 | |||
| AFL / Aflac Incorporated | 0.02 | -3.10 | 1.73 | -8.36 | 1.9400 | -0.0800 | |||
| DOV / Dover Corporation | 0.01 | -0.33 | 1.67 | -10.90 | 1.8700 | -0.1300 | |||
| YUM / Yum! Brands, Inc. | 0.01 | -0.53 | 1.66 | -8.43 | 1.8600 | -0.0800 | |||
| NFG / National Fuel Gas Company | 0.02 | -0.29 | 1.64 | 9.42 | 1.8400 | 0.2400 | |||
| HD / The Home Depot, Inc. | 0.00 | -10.64 | 1.63 | -17.02 | 1.8300 | -0.2800 | |||
| WTRG / Essential Utilities, Inc. | 0.04 | 0.58 | 1.63 | 2.00 | 1.8300 | 0.1200 | |||
| ABBV / AbbVie Inc. | 0.01 | -3.83 | 1.61 | -14.35 | 1.8000 | -0.2100 | |||
| GPC / Genuine Parts Company | 0.01 | 2.28 | 1.54 | 3.63 | 1.7300 | 0.1400 | |||
| AMZN / Amazon.com, Inc. | 0.01 | 4.88 | 1.54 | 1.31 | 1.7300 | 0.1000 | |||
| KMB / Kimberly-Clark Corporation | 0.01 | -3.07 | 1.51 | -1.88 | 1.7000 | 0.0500 | |||
| USB / U.S. Bancorp | 0.03 | 0.92 | 1.48 | -6.19 | 1.6600 | -0.0300 | |||
| COST / Costco Wholesale Corporation | 0.00 | -18.64 | 1.47 | -19.32 | 1.6400 | -0.3000 | |||
| BDX / Becton, Dickinson and Company | 0.01 | 6.04 | 1.44 | -18.85 | 1.6200 | -0.2800 | |||
| CMCSA / Comcast Corporation | 0.04 | 3.46 | 1.42 | -0.35 | 1.6000 | 0.0700 | |||
| AXP / American Express Company | 0.00 | 7.01 | 1.39 | 4.60 | 1.5500 | 0.1300 | |||
| PG / The Procter & Gamble Company | 0.01 | 1.09 | 1.38 | -1.22 | 1.5400 | 0.0500 | |||
| JPM / JPMorgan Chase & Co. | 0.01 | 0.41 | 1.37 | 0.22 | 1.5300 | 0.0700 | |||
| CL / Colgate-Palmolive Company | 0.01 | 0.41 | 1.33 | 2.32 | 1.4900 | 0.1000 | |||
| TNC / Tennant Company | 0.02 | -0.34 | 1.25 | -14.31 | 1.4000 | -0.1600 | |||
| KO / The Coca-Cola Company | 0.02 | -5.97 | 1.15 | -4.79 | 1.2900 | -0.0100 | |||
| JNJ / Johnson & Johnson | 0.01 | 1.93 | 1.13 | -4.15 | 1.2700 | 0.0100 | |||
| EPD / Enterprise Products Partners L.P. - Limited Partnership | 0.04 | 2.30 | 1.10 | -5.60 | 1.2300 | -0.0100 | |||
| MDT / Medtronic plc | 0.01 | 8.08 | 1.02 | -2.49 | 1.1400 | 0.0200 | |||
| AMCR / Amcor plc | 0.11 | 1.48 | 0.98 | -8.61 | 1.0900 | -0.0500 | |||
| HRL / Hormel Foods Corporation | 0.03 | 1.67 | 0.95 | 8.98 | 1.0600 | 0.1300 | |||
| MRK / Merck & Co., Inc. | 0.01 | 0.70 | 0.93 | -16.18 | 1.0400 | -0.1400 | |||
| LMT / Lockheed Martin Corporation | 0.00 | 5.90 | 0.92 | 13.35 | 1.0300 | 0.1600 | |||
| CSCO / Cisco Systems, Inc. | 0.01 | 9.16 | 0.88 | 7.33 | 0.9800 | 0.1000 | |||
| CARR / Carrier Global Corporation | 0.01 | 0.23 | 0.87 | 10.10 | 0.9800 | 0.1300 | |||
| GIS / General Mills, Inc. | 0.01 | 1.45 | 0.81 | -9.12 | 0.9000 | -0.0500 | |||
| SPG / Simon Property Group, Inc. | 0.00 | 1.97 | 0.78 | -10.70 | 0.8700 | -0.0600 | |||
| NUE / Nucor Corporation | 0.01 | 0.24 | 0.78 | -20.27 | 0.8700 | -0.1700 | |||
| TFC / Truist Financial Corporation | 0.02 | -2.30 | 0.74 | -16.80 | 0.8300 | -0.1300 | |||
| PEP / PepsiCo, Inc. | 0.01 | 17.68 | 0.68 | 0.74 | 0.7600 | 0.0400 | |||
| TXN / Texas Instruments Incorporated | 0.00 | -2.60 | 0.66 | -9.05 | 0.7400 | -0.0400 | |||
| NVDA / NVIDIA Corporation | 0.00 | 7.11 | 0.51 | 15.91 | 0.5700 | 0.1000 | |||
| Fidelity Investments Treasury Portfolio / STIV (US3161758848) | 0.51 | -51.12 | 0.51 | -51.20 | 0.5700 | -0.5400 | |||
| AAPL / Apple Inc. | 0.00 | 27.98 | 0.49 | 6.36 | 0.5400 | 0.0500 | |||
| TSM / Taiwan Semiconductor Manufacturing Company Limited - Depositary Receipt (Common Stock) | 0.00 | 5.71 | 0.45 | 13.45 | 0.5000 | 0.0800 | |||
| NKE / NIKE, Inc. | 0.01 | 3.44 | 0.36 | -21.04 | 0.4100 | -0.0800 | |||
| PNC / The PNC Financial Services Group, Inc. | 0.00 | 324.78 | 0.34 | 286.21 | 0.3800 | 0.2900 | |||
| TGT / Target Corporation | 0.00 | 0.28 | 0.3100 | 0.3100 | |||||
| WMT / Walmart Inc. | 0.00 | 0.23 | 0.2600 | 0.2600 | |||||
| BA / The Boeing Company | 0.00 | -61.83 | 0.21 | -54.70 | 0.2300 | -0.2600 | |||
| TSLA / Tesla, Inc. | 0.00 | 17.32 | 0.09 | 38.81 | 0.1100 | 0.0400 | |||
| META / Meta Platforms, Inc. | 0.00 | -53.92 | 0.06 | -55.56 | 0.0700 | -0.0900 |