Mga Batayang Estadistika
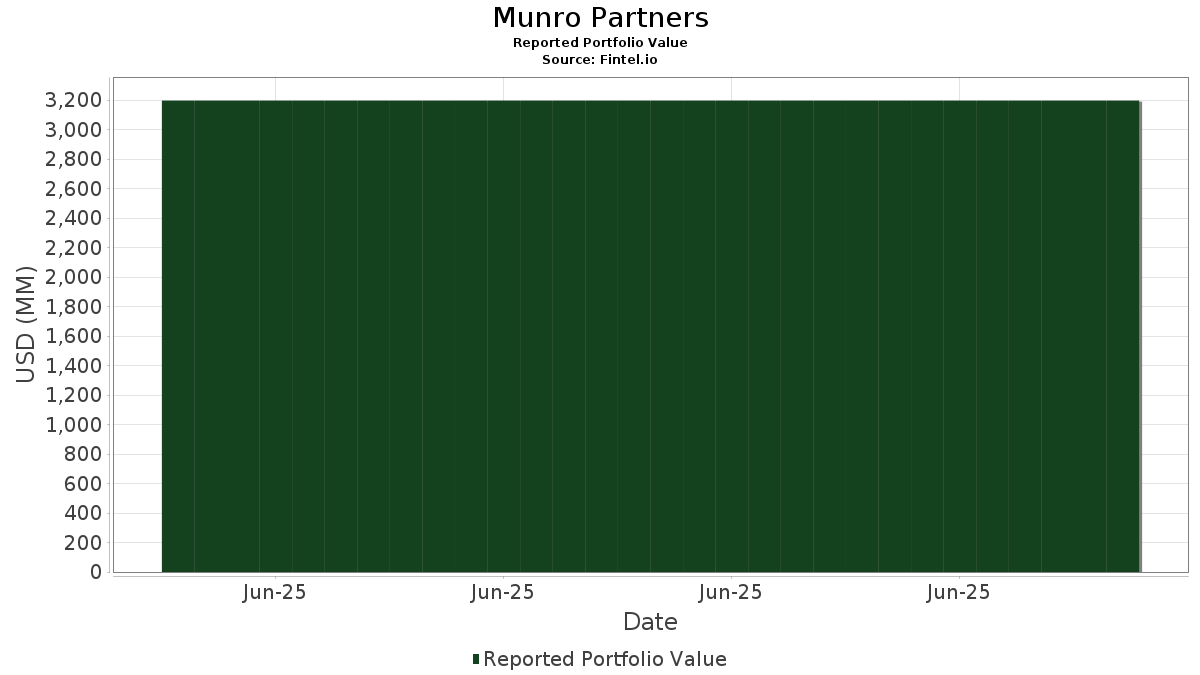
| Nilai Portofolio | $ 3,196,565,579 |
| Posisi Saat Ini | 67 |
Kepemilikan Terbaru, Kinerja, AUM (dari 13F, 13D)
Munro Partners telah mengungkapkan total kepemilikan 67 dalam pengajuan SEC terbaru mereka. Nilai portofolio terbaru dihitung sebesar $ 3,196,565,579 USD. Aset yang Dikelola (AUM) sebenarnya adalah nilai ini ditambah kas (yang tidak diungkapkan). Aset-aset utama Munro Partners adalah NVIDIA Corporation (US:NVDA) , Microsoft Corporation (US:MSFT) , Amazon.com, Inc. (US:AMZN) , Meta Platforms, Inc. (US:META) , and Constellation Energy Corporation (US:CEG) . Posisi baru Munro Partners meliputi: NVIDIA Corporation (US:NVDA) , Microsoft Corporation (US:MSFT) , Amazon.com, Inc. (US:AMZN) , Meta Platforms, Inc. (US:META) , and Constellation Energy Corporation (US:CEG) .
Peningkatan Tertinggi Kuartal Ini
Kami menggunakan perubahan dalam alokasi portofolio karena ini adalah metrik yang paling bermakna. Perubahan dapat disebabkan oleh perdagangan atau perubahan harga saham.
| Keamanan | Saham (MM) |
Nilai (Juta Dolar AS) |
Portfolio % | ΔPorsyento ng Portfolio |
|---|---|---|---|---|
| 2.01 | 318.09 | 9.9509 | 9.9509 | |
| 0.43 | 215.99 | 6.7568 | 6.7568 | |
| 0.81 | 177.60 | 5.5559 | 5.5559 | |
| 0.22 | 161.94 | 5.0661 | 5.0661 | |
| 0.44 | 141.70 | 4.4327 | 4.4327 | |
| 0.20 | 112.58 | 3.5219 | 3.5219 | |
| 0.51 | 112.27 | 3.5123 | 3.5123 | |
| 1.07 | 111.34 | 3.4831 | 3.4831 | |
| 0.96 | 102.96 | 3.2211 | 3.2211 | |
| 0.13 | 98.87 | 3.0931 | 3.0931 |
Penurunan Tertinggi Kuartal Ini
Kami menggunakan perubahan dalam alokasi portofolio karena ini adalah metrik yang paling bermakna. Perubahan dapat disebabkan oleh perdagangan atau perubahan harga saham.
| Keamanan | Saham (MM) |
Nilai (Juta Dolar AS) |
Portfolio % | ΔPorsyento ng Portfolio |
|---|
Pengajuan 13F dan Dana
Formulir ini diajukan pada 2025-08-27 untuk periode pelaporan 2025-06-30. Klik ikon tautan untuk melihat riwayat transaksi selengkapnya.
Tingkatkan ke versi premium untuk membuka data premium dan ekspor ke Excel. ![]() .
.
| Keamanan | Ketik | Harga Saham Rata-rata | Saham (MM) |
ΔSaham (%) |
ΔSaham (%) |
Nilai ($MM) |
Portpolyo (%) |
ΔPortofolio (%) |
|
|---|---|---|---|---|---|---|---|---|---|
| NVDA / NVIDIA Corporation | 2.01 | 318.09 | 9.9509 | 9.9509 | |||||
| MSFT / Microsoft Corporation | 0.43 | 215.99 | 6.7568 | 6.7568 | |||||
| AMZN / Amazon.com, Inc. | 0.81 | 177.60 | 5.5559 | 5.5559 | |||||
| META / Meta Platforms, Inc. | 0.22 | 161.94 | 5.0661 | 5.0661 | |||||
| CEG / Constellation Energy Corporation | 0.44 | 141.70 | 4.4327 | 4.4327 | |||||
| MA / Mastercard Incorporated | 0.20 | 112.58 | 3.5219 | 3.5219 | |||||
| ORCL / Oracle Corporation | 0.51 | 112.27 | 3.5123 | 3.5123 | |||||
| FWONK / Formula One Group | 1.07 | 111.34 | 3.4831 | 3.4831 | |||||
| BSX / Boston Scientific Corporation | 0.96 | 102.96 | 3.2211 | 3.2211 | |||||
| LLY / Eli Lilly and Company | 0.13 | 98.87 | 3.0931 | 3.0931 | |||||
| GEV / GE Vernova Inc. | 0.18 | 96.78 | 3.0275 | 3.0275 | |||||
| UBER / Uber Technologies, Inc. | 1.03 | 96.29 | 3.0124 | 3.0124 | |||||
| NFLX / Netflix, Inc. | 0.07 | 95.61 | 2.9909 | 2.9909 | |||||
| VRT / Vertiv Holdings Co | 0.72 | 92.26 | 2.8862 | 2.8862 | |||||
| AMD / Advanced Micro Devices, Inc. | 0.63 | 89.89 | 2.8120 | 2.8120 | |||||
| GOOGL / Alphabet Inc. | 0.48 | 83.80 | 2.6217 | 2.6217 | |||||
| JCI / Johnson Controls International plc | 0.79 | 83.24 | 2.6040 | 2.6040 | |||||
| CW / Curtiss-Wright Corporation | 0.16 | 78.00 | 2.4401 | 2.4401 | |||||
| V / Visa Inc. | 0.20 | 71.61 | 2.2401 | 2.2401 | |||||
| LNG / Cheniere Energy, Inc. | 0.28 | 67.28 | 2.1049 | 2.1049 | |||||
| ISRG / Intuitive Surgical, Inc. | 0.12 | 65.70 | 2.0554 | 2.0554 | |||||
| TKO / TKO Group Holdings, Inc. | 0.36 | 65.67 | 2.0544 | 2.0544 | |||||
| MSI / Motorola Solutions, Inc. | 0.16 | 65.37 | 2.0450 | 2.0450 | |||||
| AXON / Axon Enterprise, Inc. | 0.08 | 62.61 | 1.9587 | 1.9587 | |||||
| NOW / ServiceNow, Inc. | 0.06 | 61.78 | 1.9328 | 1.9328 | |||||
| HEI / HEICO Corporation | 0.18 | 59.72 | 1.8683 | 1.8683 | |||||
| SPOT / Spotify Technology S.A. | 0.08 | 59.51 | 1.8618 | 1.8618 | |||||
| AVGO / Broadcom Inc. | 0.21 | 56.57 | 1.7696 | 1.7696 | |||||
| ICE / Intercontinental Exchange, Inc. | 0.29 | 52.80 | 1.6517 | 1.6517 | |||||
| HWM / Howmet Aerospace Inc. | 0.14 | 26.22 | 0.8204 | 0.8204 | |||||
| PWR / Quanta Services, Inc. | 0.05 | 19.65 | 0.6147 | 0.6147 | |||||
| LIN / Linde plc | 0.04 | 19.15 | 0.5991 | 0.5991 | |||||
| NEE / NextEra Energy, Inc. | 0.27 | 18.53 | 0.5797 | 0.5797 | |||||
| GFL / GFL Environmental Inc. | 0.26 | 12.93 | 0.4044 | 0.4044 | |||||
| ETN / Eaton Corporation plc | 0.03 | 11.05 | 0.3458 | 0.3458 | |||||
| FIX / Comfort Systems USA, Inc. | 0.02 | 9.69 | 0.3031 | 0.3031 | |||||
| TW / Tradeweb Markets Inc. | 0.06 | 8.09 | 0.2530 | 0.2530 | |||||
| TT / Trane Technologies plc | 0.02 | 7.96 | 0.2490 | 0.2490 | |||||
| CLH / Clean Harbors, Inc. | 0.03 | 7.95 | 0.2488 | 0.2488 | |||||
| TLN / Talen Energy Corporation | 0.03 | 7.93 | 0.2481 | 0.2481 | |||||
| CPRT / Copart, Inc. | 0.14 | 6.78 | 0.2120 | 0.2120 | |||||
| MELI / MercadoLibre, Inc. | 0.00 | 5.84 | 0.1827 | 0.1827 | |||||
| BIP / Brookfield Infrastructure Partners L.P. - Limited Partnership | 0.17 | 5.63 | 0.1763 | 0.1763 | |||||
| IBKR / Interactive Brokers Group, Inc. | 0.09 | 4.81 | 0.1504 | 0.1504 | |||||
| DRS / Leonardo DRS, Inc. | 0.10 | 4.59 | 0.1436 | 0.1436 | |||||
| SHOP / Shopify Inc. | 0.04 | 4.53 | 0.1418 | 0.1418 | |||||
| PODD / Insulet Corporation | 0.01 | 4.51 | 0.1411 | 0.1411 | |||||
| CRH / CRH plc | 0.04 | 4.10 | 0.1282 | 0.1282 | |||||
| NVMI / Nova Ltd. | 0.01 | 3.99 | 0.1247 | 0.1247 | |||||
| CLS / Celestica Inc. | 0.02 | 3.88 | 0.1214 | 0.1214 | |||||
| WAY / Waystar Holding Corp. | 0.09 | 3.52 | 0.1102 | 0.1102 | |||||
| ZS / Zscaler, Inc. | 0.01 | 3.22 | 0.1008 | 0.1008 | |||||
| GDDY / GoDaddy Inc. | 0.02 | 3.17 | 0.0991 | 0.0991 | |||||
| DT / Dynatrace, Inc. | 0.06 | 3.16 | 0.0988 | 0.0988 | |||||
| RDDT / Reddit, Inc. | 0.02 | 2.80 | 0.0877 | 0.0877 | |||||
| MIR / Mirion Technologies, Inc. | 0.12 | 2.62 | 0.0821 | 0.0821 | |||||
| WIX / Wix.com Ltd. | 0.02 | 2.57 | 0.0803 | 0.0803 | |||||
| ALAB / Astera Labs, Inc. | 0.03 | 2.36 | 0.0737 | 0.0737 | |||||
| KNSL / Kinsale Capital Group, Inc. | 0.00 | 2.35 | 0.0736 | 0.0736 | |||||
| OWL / Blue Owl Capital Inc. | 0.12 | 2.30 | 0.0720 | 0.0720 | |||||
| SBAC / SBA Communications Corporation | 0.01 | 2.19 | 0.0684 | 0.0684 | |||||
| ULS / UL Solutions Inc. | 0.03 | 2.15 | 0.0673 | 0.0673 | |||||
| TRGP / Targa Resources Corp. | 0.01 | 1.89 | 0.0592 | 0.0592 | |||||
| CRWV / CoreWeave, Inc. | 0.01 | 1.87 | 0.0585 | 0.0585 | |||||
| AMRZ / Amrize AG | 0.04 | 1.85 | 0.0579 | 0.0579 | |||||
| NXT / Nextracker Inc. | 0.03 | 1.56 | 0.0488 | 0.0488 | |||||
| RYAN / Ryan Specialty Holdings, Inc. | 0.02 | 1.34 | 0.0420 | 0.0420 |