Mga Batayang Estadistika
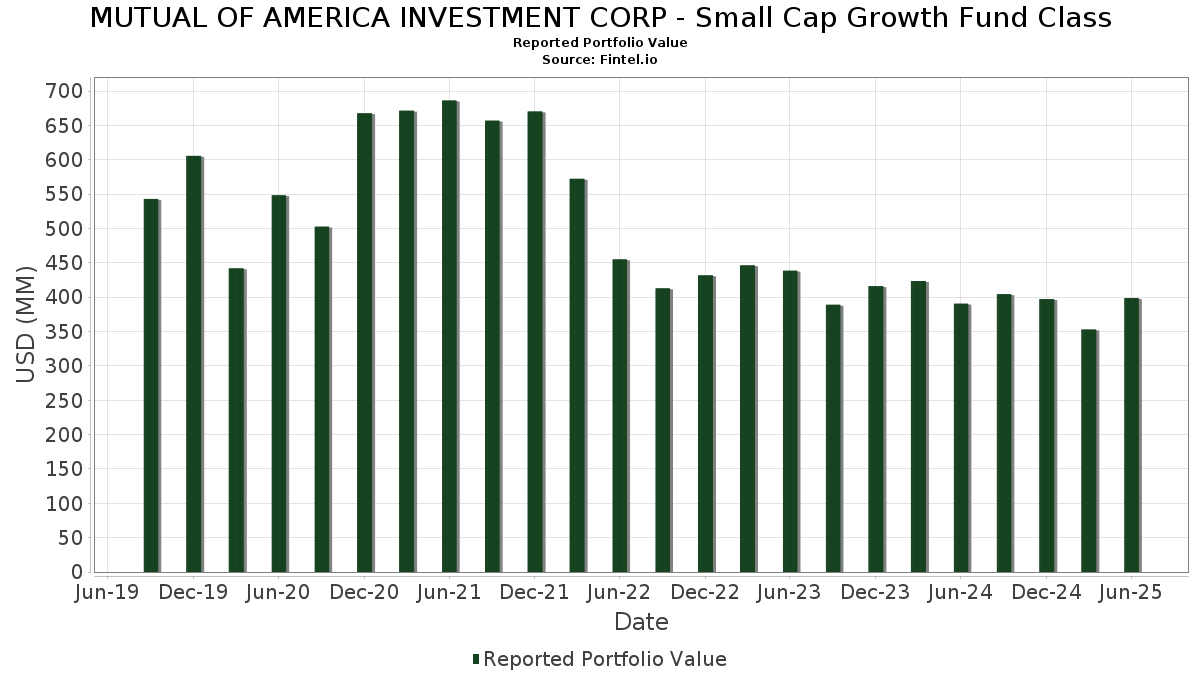
| Nilai Portofolio | $ 398,663,836 |
| Posisi Saat Ini | 94 |
Kepemilikan Terbaru, Kinerja, AUM (dari 13F, 13D)
MUTUAL OF AMERICA INVESTMENT CORP - Small Cap Growth Fund Class telah mengungkapkan total kepemilikan 94 dalam pengajuan SEC terbaru mereka. Nilai portofolio terbaru dihitung sebesar $ 398,663,836 USD. Aset yang Dikelola (AUM) sebenarnya adalah nilai ini ditambah kas (yang tidak diungkapkan). Aset-aset utama MUTUAL OF AMERICA INVESTMENT CORP - Small Cap Growth Fund Class adalah ESCO Technologies Inc. (US:ESE) , Federal Signal Corporation (US:FSS) , Sterling Infrastructure, Inc. (US:STRL) , Insmed Incorporated (US:INSM) , and Credo Technology Group Holding Ltd (US:CRDO) . Posisi baru MUTUAL OF AMERICA INVESTMENT CORP - Small Cap Growth Fund Class meliputi: RBC Bearings Incorporated (US:RBC) , Installed Building Products, Inc. (US:IBP) , Curbline Properties Corp. (US:CURB) , Dreyfus Treasury Securities Cash Management - Dreyfus Treasury Securities Cash Management Institutional Shares (US:DIRXX) , and .
Peningkatan Tertinggi Kuartal Ini
Kami menggunakan perubahan dalam alokasi portofolio karena ini adalah metrik yang paling bermakna. Perubahan dapat disebabkan oleh perdagangan atau perubahan harga saham.
| Keamanan | Saham (MM) |
Nilai (Juta Dolar AS) |
Portfolio % | ΔPorsyento ng Portfolio |
|---|---|---|---|---|
| 0.02 | 6.26 | 1.5700 | 1.5700 | |
| 0.02 | 4.29 | 1.0756 | 1.0756 | |
| 0.09 | 8.12 | 2.0355 | 1.0166 | |
| 3.90 | 0.9782 | 0.9782 | ||
| 0.06 | 6.60 | 1.6553 | 0.8891 | |
| 0.31 | 5.26 | 1.3197 | 0.8193 | |
| 0.04 | 8.70 | 2.1833 | 0.6696 | |
| 0.09 | 9.94 | 2.4931 | 0.6524 | |
| 0.37 | 6.30 | 1.5796 | 0.6360 | |
| 0.02 | 7.09 | 1.7795 | 0.4986 |
Penurunan Tertinggi Kuartal Ini
Kami menggunakan perubahan dalam alokasi portofolio karena ini adalah metrik yang paling bermakna. Perubahan dapat disebabkan oleh perdagangan atau perubahan harga saham.
| Keamanan | Saham (MM) |
Nilai (Juta Dolar AS) |
Portfolio % | ΔPorsyento ng Portfolio |
|---|---|---|---|---|
| 0.08 | 6.24 | 1.5645 | -2.3400 | |
| 0.03 | 1.39 | 0.3477 | -0.4780 | |
| 0.40 | 1.94 | 0.4854 | -0.4184 | |
| 0.36 | 4.11 | 1.0302 | -0.4027 | |
| 0.03 | 4.63 | 1.1615 | -0.3742 | |
| 0.08 | 2.12 | 0.5322 | -0.2936 | |
| 0.02 | 6.16 | 1.5449 | -0.2866 | |
| 0.03 | 1.53 | 0.3845 | -0.2534 | |
| 0.21 | 2.42 | 0.6060 | -0.2518 | |
| 0.04 | 3.30 | 0.8266 | -0.2443 |
Pengajuan 13F dan Dana
Formulir ini diajukan pada 2025-08-25 untuk periode pelaporan 2025-06-30. Klik ikon tautan untuk melihat riwayat transaksi selengkapnya.
Tingkatkan ke versi premium untuk membuka data premium dan ekspor ke Excel. ![]() .
.
| Keamanan | Ketik | Harga Saham Rata-rata | Saham (MM) |
ΔSaham (%) |
ΔSaham (%) |
Nilai ($MM) |
Portpolyo (%) |
ΔPortofolio (%) |
|
|---|---|---|---|---|---|---|---|---|---|
| ESE / ESCO Technologies Inc. | 0.06 | 5.97 | 11.89 | 27.79 | 2.9832 | 0.3465 | |||
| FSS / Federal Signal Corporation | 0.09 | 5.73 | 9.94 | 52.98 | 2.4931 | 0.6524 | |||
| STRL / Sterling Infrastructure, Inc. | 0.04 | -20.07 | 8.70 | 62.90 | 2.1833 | 0.6696 | |||
| INSM / Insmed Incorporated | 0.08 | 10.02 | 8.12 | 45.16 | 2.0367 | 0.4518 | |||
| CRDO / Credo Technology Group Holding Ltd | 0.09 | -2.13 | 8.12 | 125.67 | 2.0355 | 1.0166 | |||
| 87N / Stevanato Group S.p.A. | 0.31 | 10.02 | 7.51 | 31.63 | 1.8833 | 0.2673 | |||
| PJT / PJT Partners Inc. | 0.04 | 5.62 | 7.22 | 26.41 | 1.8118 | 0.1928 | |||
| FN / Fabrinet | 0.02 | 5.17 | 7.09 | 56.91 | 1.7795 | 0.4986 | |||
| FFIN / First Financial Bankshares, Inc. | 0.20 | 5.94 | 7.07 | 6.11 | 1.7727 | -0.1141 | |||
| AGYS / Agilysys, Inc. | 0.06 | 54.40 | 6.60 | 144.05 | 1.6553 | 0.8891 | |||
| NOG / Northern Oil and Gas, Inc. | 0.22 | 10.02 | 6.37 | 3.18 | 1.5972 | -0.1511 | |||
| CYBR / CyberArk Software Ltd. | 0.02 | 10.02 | 6.35 | 32.45 | 1.5931 | 0.2345 | |||
| BL / BlackLine, Inc. | 0.11 | 10.02 | 6.33 | 28.66 | 1.5866 | 0.1938 | |||
| ARLO / Arlo Technologies, Inc. | 0.37 | 10.02 | 6.30 | 89.04 | 1.5796 | 0.6360 | |||
| RBC / RBC Bearings Incorporated | 0.02 | 6.26 | 1.5700 | 1.5700 | |||||
| ADUS / Addus HomeCare Corporation | 0.05 | 6.01 | 6.26 | 23.47 | 1.5691 | 0.1340 | |||
| CORT / Corcept Therapeutics Incorporated | 0.08 | -29.58 | 6.24 | -54.75 | 1.5645 | -2.3400 | |||
| MOD / Modine Manufacturing Company | 0.06 | 25.59 | 6.22 | 61.19 | 1.5594 | 0.4667 | |||
| MUSA / Murphy USA Inc. | 0.02 | 10.03 | 6.16 | -4.73 | 1.5449 | -0.2866 | |||
| BLFS / BioLife Solutions, Inc. | 0.28 | 23.86 | 6.10 | 16.80 | 1.5312 | 0.0507 | |||
| AIT / Applied Industrial Technologies, Inc. | 0.03 | 10.02 | 6.07 | 13.50 | 1.5224 | 0.0074 | |||
| WK / Workiva Inc. | 0.09 | 20.93 | 5.93 | 9.03 | 1.4868 | -0.0532 | |||
| FA / First Advantage Corporation | 0.35 | 5.55 | 5.89 | 24.44 | 1.4777 | 0.1364 | |||
| RMBS / Rambus Inc. | 0.09 | 10.02 | 5.88 | 36.03 | 1.4745 | 0.2504 | |||
| MTN / Vail Resorts, Inc. | 0.04 | 5.55 | 5.72 | 3.64 | 1.4358 | -0.1288 | |||
| UFPI / UFP Industries, Inc. | 0.06 | 10.02 | 5.71 | 2.13 | 1.4328 | -0.1517 | |||
| CPK / Chesapeake Utilities Corporation | 0.05 | 5.43 | 5.62 | -1.30 | 1.4096 | -0.2036 | |||
| EXLS / ExlService Holdings, Inc. | 0.12 | 10.02 | 5.42 | 2.05 | 1.3594 | -0.1451 | |||
| HLI / Houlihan Lokey, Inc. | 0.03 | 6.11 | 5.30 | 18.21 | 1.3288 | 0.0594 | |||
| CORZ / Core Scientific, Inc. | 0.31 | 26.35 | 5.26 | 197.90 | 1.3197 | 0.8193 | |||
| KWR / Quaker Chemical Corporation | 0.05 | 10.02 | 5.20 | -0.36 | 1.3051 | -0.1743 | |||
| OLLI / Ollie's Bargain Outlet Holdings, Inc. | 0.04 | 5.20 | 5.09 | 19.13 | 1.2777 | 0.0665 | |||
| GTLS / Chart Industries, Inc. | 0.03 | 5.55 | 5.06 | 20.39 | 1.2697 | 0.0785 | |||
| QTWO / Q2 Holdings, Inc. | 0.05 | 35.12 | 5.02 | 58.07 | 1.2585 | 0.3592 | |||
| CWST / Casella Waste Systems, Inc. | 0.04 | 10.03 | 4.96 | 13.83 | 1.2447 | 0.0098 | |||
| SFBS / ServisFirst Bancshares, Inc. | 0.06 | 10.02 | 4.83 | 3.25 | 1.2112 | -0.1138 | |||
| HQY / HealthEquity, Inc. | 0.04 | 10.02 | 4.64 | 30.43 | 1.1636 | 0.1560 | |||
| HURN / Huron Consulting Group Inc. | 0.03 | -10.90 | 4.63 | -14.58 | 1.1615 | -0.3742 | |||
| VRNS / Varonis Systems, Inc. | 0.09 | 10.02 | 4.41 | 38.06 | 1.1064 | 0.2011 | |||
| EME / EMCOR Group, Inc. | 0.01 | 5.63 | 4.40 | 52.87 | 1.1032 | 0.2880 | |||
| SLNO / Soleno Therapeutics, Inc. | 0.05 | 10.02 | 4.39 | 29.02 | 1.1018 | 0.1372 | |||
| PRI / Primerica, Inc. | 0.02 | 10.02 | 4.37 | 5.83 | 1.0972 | -0.0738 | |||
| BPMC / Blueprint Medicines Corporation | 0.03 | 5.30 | 4.32 | 52.49 | 1.0829 | 0.2809 | |||
| IBP / Installed Building Products, Inc. | 0.02 | 4.29 | 1.0756 | 1.0756 | |||||
| AEIS / Advanced Energy Industries, Inc. | 0.03 | 10.02 | 4.25 | 52.95 | 1.0666 | 0.2790 | |||
| NOVT / Novanta Inc. | 0.03 | 30.43 | 4.24 | 31.49 | 1.0642 | 0.1502 | |||
| AXSM / Axsome Therapeutics, Inc. | 0.04 | 10.02 | 4.22 | -1.54 | 1.0577 | -0.1554 | |||
| THC / Tenet Healthcare Corporation | 0.02 | -15.53 | 4.15 | 10.52 | 1.0413 | -0.0228 | |||
| GDYN / Grid Dynamics Holdings, Inc. | 0.36 | 10.02 | 4.11 | -18.80 | 1.0302 | -0.4027 | |||
| AUTOMATIC DATA PROCESSI 0.0 01JUL25 / DBT (000000000) | 3.90 | 0.9782 | 0.9782 | ||||||
| SIGI / Selective Insurance Group, Inc. | 0.04 | 10.02 | 3.88 | 4.16 | 0.9741 | -0.0823 | |||
| EXPO / Exponent, Inc. | 0.05 | 89.22 | 3.79 | 21.10 | 0.9504 | 0.4852 | |||
| GDEN / Golden Entertainment, Inc. | 0.13 | 0.00 | 3.75 | 11.54 | 0.9404 | -0.0120 | |||
| KIDS / OrthoPediatrics Corp. | 0.17 | 10.02 | 3.71 | -4.06 | 0.9300 | -0.1647 | |||
| OSW / OneSpaWorld Holdings Limited | 0.18 | -12.27 | 3.66 | 6.53 | 0.9168 | -0.0552 | |||
| MRCY / Mercury Systems, Inc. | 0.07 | 22.36 | 3.62 | 52.93 | 0.9088 | 0.2376 | |||
| FWRG / First Watch Restaurant Group, Inc. | 0.22 | 10.02 | 3.55 | 6.00 | 0.8908 | -0.0584 | |||
| MDGL / Madrigal Pharmaceuticals, Inc. | 0.01 | 10.02 | 3.47 | 0.52 | 0.8716 | -0.1077 | |||
| LNTH / Lantheus Holdings, Inc. | 0.04 | 3.94 | 3.30 | -12.83 | 0.8266 | -0.2443 | |||
| IRTC / iRhythm Technologies, Inc. | 0.02 | 10.02 | 3.25 | 61.84 | 0.8160 | 0.2465 | |||
| VCEL / Vericel Corporation | 0.08 | 10.02 | 3.22 | 4.91 | 0.8088 | -0.0619 | |||
| COKE / Coca-Cola Consolidated, Inc. | 0.03 | 1,000.39 | 3.15 | -9.00 | 0.7889 | -0.1902 | |||
| FRPT / Freshpet, Inc. | 0.04 | 5.55 | 2.95 | -13.77 | 0.7401 | -0.2291 | |||
| SPXC / SPX Technologies, Inc. | 0.02 | 10.02 | 2.88 | 43.31 | 0.7221 | 0.1528 | |||
| PECO / Phillips Edison & Company, Inc. | 0.08 | 10.02 | 2.84 | 5.65 | 0.7124 | -0.0494 | |||
| EXE / Expand Energy Corporation | 0.02 | 10.02 | 2.79 | 15.60 | 0.7009 | 0.0160 | |||
| LMAT / LeMaitre Vascular, Inc. | 0.03 | 10.02 | 2.74 | 8.91 | 0.6870 | -0.0255 | |||
| TARS / Tarsus Pharmaceuticals, Inc. | 0.07 | 10.02 | 2.65 | -13.22 | 0.6652 | -0.2007 | |||
| KRYS / Krystal Biotech, Inc. | 0.02 | 10.02 | 2.65 | -16.13 | 0.6651 | -0.2305 | |||
| TMHC / Taylor Morrison Home Corporation | 0.04 | -1.93 | 2.49 | 0.32 | 0.6247 | -0.0786 | |||
| IOSP / Innospec Inc. | 0.03 | 6.93 | 2.45 | -12.03 | 0.6144 | -0.1015 | |||
| OPCH / Option Care Health, Inc. | 0.08 | 10.02 | 2.44 | 2.27 | 0.6113 | -0.0639 | |||
| LBRT / Liberty Energy Inc. | 0.21 | 10.02 | 2.42 | -20.19 | 0.6060 | -0.2518 | |||
| RHP / Ryman Hospitality Properties, Inc. | 0.02 | 10.02 | 2.39 | 18.73 | 0.5995 | 0.0292 | |||
| ONTO / Onto Innovation Inc. | 0.02 | 10.03 | 2.22 | -8.47 | 0.5558 | -0.1301 | |||
| RNA / Avidity Biosciences, Inc. | 0.08 | 10.02 | 2.19 | 5.86 | 0.5484 | -0.0368 | |||
| SUPN / Supernus Pharmaceuticals, Inc. | 0.07 | 10.02 | 2.13 | 5.88 | 0.5332 | -0.0355 | |||
| IMAX / IMAX Corporation | 0.08 | -31.40 | 2.12 | -27.24 | 0.5322 | -0.2936 | |||
| VAL / Valaris Limited | 0.05 | 10.02 | 2.11 | 18.05 | 0.5283 | 0.0227 | |||
| SMPL / The Simply Good Foods Company | 0.07 | 0.00 | 2.08 | -8.43 | 0.5210 | -0.1214 | |||
| PDFS / PDF Solutions, Inc. | 0.10 | 10.02 | 2.04 | 23.10 | 0.5120 | 0.0422 | |||
| SAIA / Saia, Inc. | 0.01 | 45.98 | 2.03 | 14.48 | 0.5097 | 0.0067 | |||
| CURB / Curbline Properties Corp. | 0.09 | 1.96 | 0.4906 | 0.4906 | |||||
| NEOG / Neogen Corporation | 0.40 | 10.02 | 1.94 | -39.34 | 0.4854 | -0.4184 | |||
| MTRN / Materion Corporation | 0.02 | 10.02 | 1.66 | 7.05 | 0.4152 | -0.0230 | |||
| XENE / Xenon Pharmaceuticals Inc. | 0.05 | 10.02 | 1.56 | 2.71 | 0.3903 | -0.0392 | |||
| HALO / Halozyme Therapeutics, Inc. | 0.03 | -16.50 | 1.53 | -31.94 | 0.3845 | -0.2534 | |||
| SLP / Simulations Plus, Inc. | 0.08 | 10.02 | 1.48 | -21.73 | 0.3707 | -0.1640 | |||
| FOLD / Amicus Therapeutics, Inc. | 0.25 | 10.02 | 1.45 | -22.72 | 0.3643 | -0.1683 | |||
| SWTX / SpringWorks Therapeutics, Inc. | 0.03 | -55.34 | 1.39 | -52.44 | 0.3477 | -0.4780 | |||
| ANNX / Annexon, Inc. | 0.49 | 5.55 | 1.18 | 31.26 | 0.2961 | 0.0413 | |||
| OMCL / Omnicell, Inc. | 0.03 | 10.02 | 0.89 | -7.45 | 0.2243 | -0.0495 | |||
| DYN / Dyne Therapeutics, Inc. | 0.05 | 5.55 | 0.45 | -4.04 | 0.1133 | -0.0199 | |||
| DIRXX / Dreyfus Treasury Securities Cash Management - Dreyfus Treasury Securities Cash Management Institutional Shares | 0.10 | 0.10 | 0.0243 | 0.0243 |