Mga Batayang Estadistika
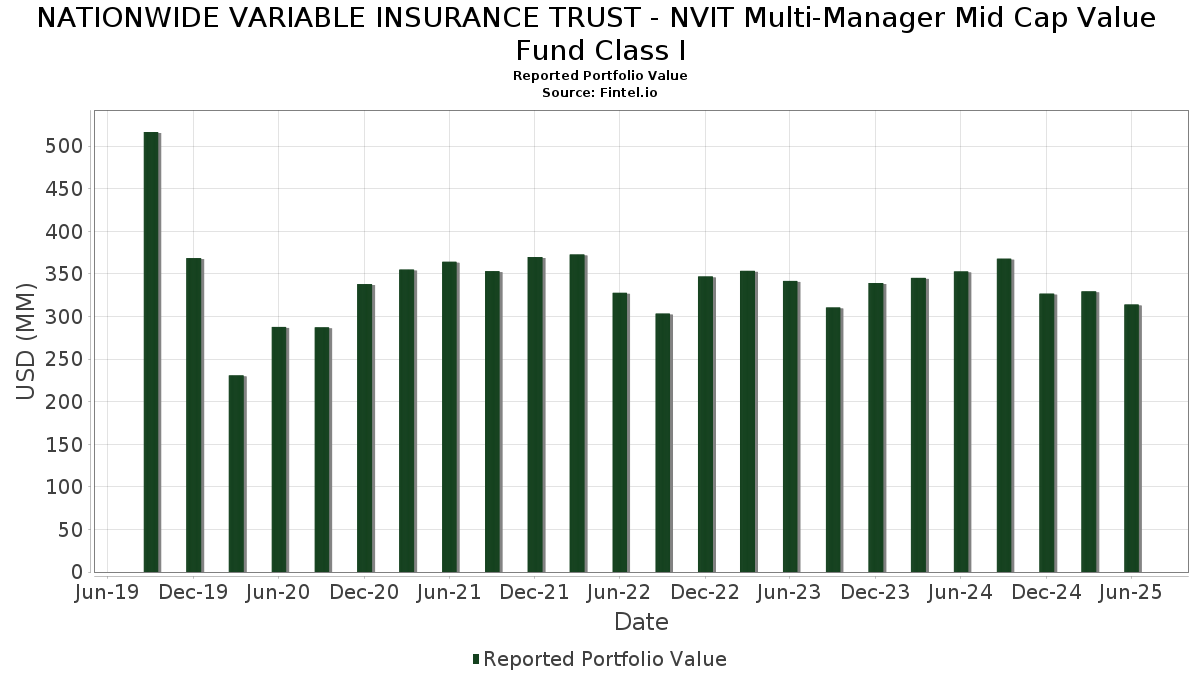
| Nilai Portofolio | $ 314,035,373 |
| Posisi Saat Ini | 77 |
Kepemilikan Terbaru, Kinerja, AUM (dari 13F, 13D)
NATIONWIDE VARIABLE INSURANCE TRUST - NVIT Multi-Manager Mid Cap Value Fund Class I telah mengungkapkan total kepemilikan 77 dalam pengajuan SEC terbaru mereka. Nilai portofolio terbaru dihitung sebesar $ 314,035,373 USD. Aset yang Dikelola (AUM) sebenarnya adalah nilai ini ditambah kas (yang tidak diungkapkan). Aset-aset utama NATIONWIDE VARIABLE INSURANCE TRUST - NVIT Multi-Manager Mid Cap Value Fund Class I adalah US Foods Holding Corp. (US:USFD) , Alliant Energy Corporation (US:LNT) , Quest Diagnostics Incorporated (US:DGX) , Crown Holdings, Inc. (US:CCK) , and Performance Food Group Company (US:PFGC) . Posisi baru NATIONWIDE VARIABLE INSURANCE TRUST - NVIT Multi-Manager Mid Cap Value Fund Class I meliputi: Labcorp Holdings Inc. (US:LH) , Casey's General Stores, Inc. (US:CASY) , Penske Automotive Group, Inc. (DE:UA9) , .
Peningkatan Tertinggi Kuartal Ini
Kami menggunakan perubahan dalam alokasi portofolio karena ini adalah metrik yang paling bermakna. Perubahan dapat disebabkan oleh perdagangan atau perubahan harga saham.
| Keamanan | Saham (MM) |
Nilai (Juta Dolar AS) |
Portfolio % | ΔPorsyento ng Portfolio |
|---|---|---|---|---|
| 10.00 | 3.2558 | 3.2558 | ||
| 0.02 | 4.57 | 1.4871 | 1.4871 | |
| 4.25 | 1.3852 | 1.3852 | ||
| 0.05 | 3.53 | 1.1478 | 1.1478 | |
| 0.01 | 3.15 | 1.0259 | 1.0259 | |
| 0.01 | 3.83 | 1.2466 | 0.7674 | |
| 0.04 | 3.04 | 0.9885 | 0.7303 | |
| 0.15 | 4.59 | 1.4934 | 0.7178 | |
| 0.01 | 2.08 | 0.6782 | 0.6782 | |
| 2.00 | 0.6512 | 0.6512 |
Penurunan Tertinggi Kuartal Ini
Kami menggunakan perubahan dalam alokasi portofolio karena ini adalah metrik yang paling bermakna. Perubahan dapat disebabkan oleh perdagangan atau perubahan harga saham.
| Keamanan | Saham (MM) |
Nilai (Juta Dolar AS) |
Portfolio % | ΔPorsyento ng Portfolio |
|---|---|---|---|---|
| 0.00 | 0.22 | 0.0709 | -1.1931 | |
| 0.00 | 0.00 | -0.9635 | ||
| 0.00 | 0.00 | -0.9085 | ||
| 0.04 | 3.03 | 0.9858 | -0.6020 | |
| 0.04 | 5.33 | 1.7359 | -0.5056 | |
| 0.01 | 1.85 | 0.6023 | -0.4843 | |
| 0.11 | 4.17 | 1.3572 | -0.4657 | |
| 0.05 | 3.61 | 1.1742 | -0.4512 | |
| 0.02 | 1.53 | 0.4985 | -0.4344 | |
| 0.02 | 4.02 | 1.3102 | -0.3882 |
Pengajuan 13F dan Dana
Formulir ini diajukan pada 2025-08-20 untuk periode pelaporan 2025-06-30. Klik ikon tautan untuk melihat riwayat transaksi selengkapnya.
Tingkatkan ke versi premium untuk membuka data premium dan ekspor ke Excel. ![]() .
.
| Keamanan | Ketik | Harga Saham Rata-rata | Saham (MM) |
ΔSaham (%) |
ΔSaham (%) |
Nilai ($MM) |
Portpolyo (%) |
ΔPortofolio (%) |
|
|---|---|---|---|---|---|---|---|---|---|
| BNP / BNP Paribas SA | 10.00 | 3.2558 | 3.2558 | ||||||
| USFD / US Foods Holding Corp. | 0.10 | -11.24 | 7.60 | 4.41 | 2.4747 | 0.1325 | |||
| LNT / Alliant Energy Corporation | 0.12 | -6.87 | 7.38 | -12.48 | 2.4019 | -0.3106 | |||
| DGX / Quest Diagnostics Incorporated | 0.03 | -13.24 | 6.06 | -7.89 | 1.9738 | -0.1440 | |||
| CCK / Crown Holdings, Inc. | 0.06 | -14.70 | 6.03 | -1.60 | 1.9647 | -0.0084 | |||
| PFGC / Performance Food Group Company | 0.07 | 5.25 | 5.78 | 17.10 | 1.8824 | 0.2935 | |||
| FNF / Fidelity National Financial, Inc. | 0.10 | 8.18 | 5.78 | -6.82 | 1.8818 | -0.1139 | |||
| WTY / Willis Towers Watson Public Limited Company | 0.02 | -1.08 | 5.64 | -10.28 | 1.8361 | -0.1865 | |||
| G / Genpact Limited | 0.13 | 0.56 | 5.55 | -12.15 | 1.8083 | -0.2262 | |||
| EXPE / Expedia Group, Inc. | 0.03 | -6.52 | 5.50 | -6.21 | 1.7903 | -0.0960 | |||
| AWK / American Water Works Company, Inc. | 0.04 | -4.43 | 5.40 | -9.88 | 1.7573 | -0.1699 | |||
| HIG / The Hartford Insurance Group, Inc. | 0.04 | -25.36 | 5.33 | -23.46 | 1.7359 | -0.5056 | |||
| CPT / Camden Property Trust | 0.05 | -1.28 | 5.23 | -9.05 | 1.7015 | -0.1471 | |||
| NNN / NNN REIT, Inc. | 0.12 | -8.21 | 5.20 | -7.06 | 1.6940 | -0.1075 | |||
| TRMB / Trimble Inc. | 0.07 | 2.10 | 5.18 | 18.15 | 1.6871 | 0.2760 | |||
| LAMR / Lamar Advertising Company | 0.04 | -2.10 | 5.08 | 4.42 | 1.6555 | 0.0886 | |||
| CART / Maplebear Inc. | 0.11 | 18.87 | 5.08 | 34.83 | 1.6537 | 0.4414 | |||
| HBAN / Huntington Bancshares Incorporated | 0.29 | 2.14 | 4.89 | 14.06 | 1.5906 | 0.2122 | |||
| SBAC / SBA Communications Corporation | 0.02 | -19.09 | 4.83 | -13.65 | 1.5712 | -0.2269 | |||
| CTRA / Coterra Energy Inc. | 0.19 | -2.43 | 4.80 | -14.30 | 1.5626 | -0.2396 | |||
| ORI / Old Republic International Corporation | 0.12 | -2.22 | 4.75 | -4.16 | 1.5466 | -0.0483 | |||
| XYL / Xylem Inc. | 0.04 | 22.22 | 4.70 | 32.37 | 1.5288 | 0.3872 | |||
| TFC / Truist Financial Corporation | 0.11 | 41.83 | 4.66 | 48.20 | 1.5186 | 0.5057 | |||
| LECO / Lincoln Electric Holdings, Inc. | 0.02 | 29.80 | 4.63 | 42.27 | 1.5069 | 0.4600 | |||
| BBWI / Bath & Body Works, Inc. | 0.15 | 92.58 | 4.59 | 90.29 | 1.4934 | 0.7178 | |||
| LH / Labcorp Holdings Inc. | 0.02 | 4.57 | 1.4871 | 1.4871 | |||||
| HOLX / Hologic, Inc. | 0.07 | -17.04 | 4.56 | -12.47 | 1.4850 | -0.1920 | |||
| MKSI / MKS Inc. | 0.05 | 12.50 | 4.56 | 39.45 | 1.4848 | 0.4326 | |||
| CF / CF Industries Holdings, Inc. | 0.05 | -1.10 | 4.55 | 16.43 | 1.4812 | 0.2239 | |||
| RJF / Raymond James Financial, Inc. | 0.03 | 38.32 | 4.54 | 52.73 | 1.4780 | 0.5215 | |||
| ATR / AptarGroup, Inc. | 0.03 | -1.29 | 4.51 | 4.09 | 1.4668 | 0.0738 | |||
| KNX / Knight-Swift Transportation Holdings Inc. | 0.10 | -1.18 | 4.46 | 0.50 | 1.4526 | 0.0242 | |||
| CHKP / Check Point Software Technologies Ltd. | 0.02 | 21.82 | 4.45 | 18.27 | 1.4479 | 0.2378 | |||
| TXT / Textron Inc. | 0.05 | -2.17 | 4.34 | 8.70 | 1.4116 | 0.1283 | |||
| Government Agency Repurchase Agreement / RA (N/A) | 4.25 | 1.3852 | 1.3852 | ||||||
| PFG / Principal Financial Group, Inc. | 0.05 | 15.68 | 4.19 | 8.89 | 1.3641 | 0.1262 | |||
| KEYS / Keysight Technologies, Inc. | 0.03 | 3.34 | 4.19 | 13.04 | 1.3631 | 0.1715 | |||
| BKR / Baker Hughes Company | 0.11 | -15.65 | 4.17 | -26.43 | 1.3572 | -0.4657 | |||
| FNV / Franco-Nevada Corporation | 0.02 | -26.72 | 4.02 | -23.76 | 1.3102 | -0.3882 | |||
| AFG / American Financial Group, Inc. | 0.03 | 14.02 | 3.90 | 9.55 | 1.2697 | 0.1244 | |||
| AGCO / AGCO Corporation | 0.04 | -11.62 | 3.88 | -1.52 | 1.2645 | -0.0044 | |||
| AXTA / Axalta Coating Systems Ltd. | 0.13 | -2.18 | 3.87 | -12.44 | 1.2605 | -0.1622 | |||
| ELS / Equity LifeStyle Properties, Inc. | 0.06 | 3.48 | 3.85 | -4.33 | 1.2529 | -0.0413 | |||
| RPM / RPM International Inc. | 0.04 | -2.23 | 3.84 | -7.17 | 1.2516 | -0.0809 | |||
| HUBB / Hubbell Incorporated | 0.01 | 108.33 | 3.83 | 157.09 | 1.2466 | 0.7674 | |||
| WLK / Westlake Corporation | 0.05 | -5.94 | 3.61 | -28.61 | 1.1742 | -0.4512 | |||
| CHRD / Chord Energy Corporation | 0.04 | -2.37 | 3.59 | -16.11 | 1.1698 | -0.2084 | |||
| MIDD / The Middleby Corporation | 0.02 | -14.60 | 3.58 | -19.09 | 1.1650 | -0.2580 | |||
| AKAM / Akamai Technologies, Inc. | 0.04 | -3.86 | 3.57 | -4.75 | 1.1634 | -0.0437 | |||
| MCHP / Microchip Technology Incorporated | 0.05 | 3.53 | 1.1478 | 1.1478 | |||||
| TRU / TransUnion | 0.04 | -0.74 | 3.52 | 5.26 | 1.1460 | 0.0699 | |||
| ZBRA / Zebra Technologies Corporation | 0.01 | -20.65 | 3.38 | -13.41 | 1.0993 | -0.1554 | |||
| BWA / BorgWarner Inc. | 0.10 | -19.31 | 3.35 | -5.69 | 1.0900 | -0.0524 | |||
| PRMB / Primo Brands Corporation | 0.11 | 63.24 | 3.29 | 36.22 | 1.0704 | 0.2939 | |||
| JBHT / J.B. Hunt Transport Services, Inc. | 0.02 | -14.02 | 3.26 | -16.54 | 1.0613 | -0.1955 | |||
| PKG / Packaging Corporation of America | 0.02 | 3.53 | 3.18 | -1.46 | 1.0354 | -0.0032 | |||
| STLD / Steel Dynamics, Inc. | 0.02 | 20.81 | 3.16 | 23.65 | 1.0284 | 0.2063 | |||
| CASY / Casey's General Stores, Inc. | 0.01 | 3.15 | 1.0259 | 1.0259 | |||||
| CARR / Carrier Global Corporation | 0.04 | -23.70 | 3.11 | -11.92 | 1.0127 | -0.1236 | |||
| FCN / FTI Consulting, Inc. | 0.02 | -6.37 | 3.08 | -7.86 | 1.0043 | -0.0728 | |||
| US7587501039 / Regal-Beloit Corp. | 0.02 | -26.13 | 3.07 | -5.94 | 1.0005 | -0.0508 | |||
| CMS / CMS Energy Corporation | 0.04 | 192.42 | 3.04 | 248.97 | 0.9885 | 0.7303 | |||
| COO / The Cooper Companies, Inc. | 0.04 | -27.26 | 3.03 | -38.65 | 0.9858 | -0.6020 | |||
| GPK / Graphic Packaging Holding Company | 0.14 | 37.85 | 3.02 | 11.88 | 0.9844 | 0.1148 | |||
| DVN / Devon Energy Corporation | 0.09 | -1.73 | 2.90 | -16.42 | 0.9435 | -0.1721 | |||
| LSTR / Landstar System, Inc. | 0.02 | -1.89 | 2.89 | -9.20 | 0.9414 | -0.0832 | |||
| AVY / Avery Dennison Corporation | 0.02 | -17.89 | 2.74 | -19.05 | 0.8912 | -0.1968 | |||
| RSG / Republic Services, Inc. | 0.01 | 1.72 | 2.56 | 3.56 | 0.8330 | 0.0382 | |||
| HLT / Hilton Worldwide Holdings Inc. | 0.01 | 0.00 | 2.56 | 17.03 | 0.8325 | 0.1296 | |||
| RL / Ralph Lauren Corporation | 0.01 | -29.35 | 2.23 | -12.21 | 0.7256 | -0.0913 | |||
| UA9 / Penske Automotive Group, Inc. | 0.01 | 2.08 | 0.6782 | 0.6782 | |||||
| Aptiv plc / EC (JE00BTDN8H13) | 0.03 | -20.54 | 2.01 | -8.91 | 0.6530 | -0.0554 | |||
| Government Agency Repurchase Agreement / RA (N/A) | 2.00 | 0.6512 | 0.6512 | ||||||
| ROST / Ross Stores, Inc. | 0.01 | -45.13 | 1.85 | -45.23 | 0.6023 | -0.4843 | |||
| GLOB / Globant S.A. | 0.02 | -13.78 | 1.76 | -33.46 | 0.5738 | -0.2785 | |||
| PB / Prosperity Bancshares, Inc. | 0.02 | -46.34 | 1.53 | -47.19 | 0.4985 | -0.4344 | |||
| EBAY / eBay Inc. | 0.00 | -94.96 | 0.22 | -94.48 | 0.0709 | -1.1931 | |||
| XEL / Xcel Energy Inc. | 0.00 | -100.00 | 0.00 | -100.00 | -0.9635 | ||||
| US361ESC0496 / ESC GCI LIBERTY INC SR | 0.03 | 0.00 | 0.00 | 0.0000 | 0.0000 | ||||
| SKX / Skechers U.S.A., Inc. | 0.00 | -100.00 | 0.00 | -100.00 | -0.9085 |