Mga Batayang Estadistika
| Nilai Portofolio | $ 214,609,014 |
| Posisi Saat Ini | 60 |
Kepemilikan Terbaru, Kinerja, AUM (dari 13F, 13D)
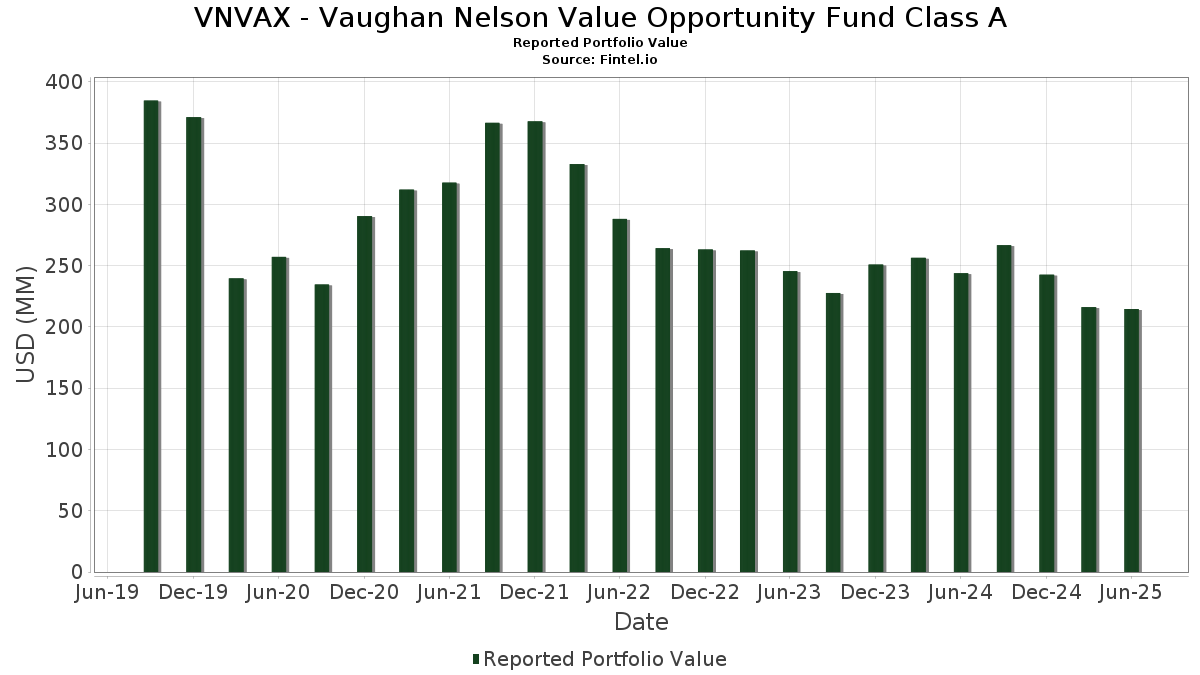
VNVAX - Vaughan Nelson Value Opportunity Fund Class A telah mengungkapkan total kepemilikan 60 dalam pengajuan SEC terbaru mereka. Nilai portofolio terbaru dihitung sebesar $ 214,609,014 USD. Aset yang Dikelola (AUM) sebenarnya adalah nilai ini ditambah kas (yang tidak diungkapkan). Aset-aset utama VNVAX - Vaughan Nelson Value Opportunity Fund Class A adalah Coherent Corp. (US:COHR) , Hubbell Incorporated (US:HUBB) , Tradeweb Markets Inc. (US:TW) , Burlington Stores, Inc. (US:BURL) , and Vulcan Materials Company (US:VMC) . Posisi baru VNVAX - Vaughan Nelson Value Opportunity Fund Class A meliputi: Coherent Corp. (US:COHR) , Burlington Stores, Inc. (US:BURL) , Ciena Corporation (US:CIEN) , Trex Company, Inc. (US:TREX) , and .
Peningkatan Tertinggi Kuartal Ini
Kami menggunakan perubahan dalam alokasi portofolio karena ini adalah metrik yang paling bermakna. Perubahan dapat disebabkan oleh perdagangan atau perubahan harga saham.
| Keamanan | Saham (MM) |
Nilai (Juta Dolar AS) |
Portfolio % | ΔPorsyento ng Portfolio |
|---|---|---|---|---|
| 0.08 | 6.82 | 3.1802 | 3.1802 | |
| 0.03 | 6.22 | 2.9013 | 2.9013 | |
| 0.02 | 6.78 | 3.1632 | 1.9889 | |
| 0.01 | 5.53 | 2.5824 | 1.8271 | |
| 0.04 | 3.45 | 1.6080 | 1.6080 | |
| 0.01 | 4.41 | 2.0565 | 1.5347 | |
| 0.06 | 4.12 | 1.9241 | 1.4586 | |
| 0.01 | 4.13 | 1.9255 | 1.4392 | |
| 0.03 | 3.64 | 1.7000 | 1.2901 | |
| 0.02 | 4.33 | 2.0206 | 1.2499 |
Penurunan Tertinggi Kuartal Ini
Kami menggunakan perubahan dalam alokasi portofolio karena ini adalah metrik yang paling bermakna. Perubahan dapat disebabkan oleh perdagangan atau perubahan harga saham.
| Keamanan | Saham (MM) |
Nilai (Juta Dolar AS) |
Portfolio % | ΔPorsyento ng Portfolio |
|---|---|---|---|---|
| 0.02 | 3.47 | 1.6172 | -2.8843 | |
| 0.06 | 3.89 | 1.8167 | -2.3497 | |
| 0.01 | 2.65 | 1.2386 | -1.9955 | |
| 0.00 | 3.91 | 1.8238 | -1.9701 | |
| 0.26 | 2.91 | 1.3554 | -1.6906 | |
| 0.05 | 2.08 | 0.9693 | -1.2148 | |
| 0.01 | 1.04 | 0.4858 | -0.8991 | |
| 0.03 | 5.20 | 2.4262 | -0.8187 | |
| 0.04 | 6.51 | 3.0369 | -0.7718 | |
| 0.01 | 1.98 | 0.9221 | -0.5640 |
Pengajuan 13F dan Dana
Formulir ini diajukan pada 2025-08-29 untuk periode pelaporan 2025-06-30. Klik ikon tautan untuk melihat riwayat transaksi selengkapnya.
Tingkatkan ke versi premium untuk membuka data premium dan ekspor ke Excel. ![]() .
.
| Keamanan | Ketik | Harga Saham Rata-rata | Saham (MM) |
ΔSaham (%) |
ΔSaham (%) |
Nilai ($MM) |
Portpolyo (%) |
ΔPortofolio (%) |
|
|---|---|---|---|---|---|---|---|---|---|
| COHR / Coherent Corp. | 0.08 | 6.82 | 3.1802 | 3.1802 | |||||
| HUBB / Hubbell Incorporated | 0.02 | 116.71 | 6.78 | 167.52 | 3.1632 | 1.9889 | |||
| TW / Tradeweb Markets Inc. | 0.04 | -19.72 | 6.51 | -20.84 | 3.0369 | -0.7718 | |||
| BURL / Burlington Stores, Inc. | 0.03 | 6.22 | 2.9013 | 2.9013 | |||||
| VMC / Vulcan Materials Company | 0.02 | -8.59 | 5.85 | 2.20 | 2.7313 | 0.0776 | |||
| AXON / Axon Enterprise, Inc. | 0.01 | 115.65 | 5.53 | 239.51 | 2.5824 | 1.8271 | |||
| PFGC / Performance Food Group Company | 0.06 | 5.53 | 5.26 | 17.40 | 2.4554 | 0.3788 | |||
| RGA / Reinsurance Group of America, Incorporated | 0.03 | -26.31 | 5.20 | -25.76 | 2.4262 | -0.8187 | |||
| ERJ / Embraer S.A. - Depositary Receipt (Common Stock) | 0.09 | 8.66 | 4.98 | 33.84 | 2.3252 | 0.6004 | |||
| GEV / GE Vernova Inc. | 0.01 | 125.75 | 4.41 | 291.39 | 2.0565 | 1.5347 | |||
| TYL / Tyler Technologies, Inc. | 0.01 | 14.08 | 4.37 | 16.34 | 2.0399 | 0.2988 | |||
| ZION / Zions Bancorporation, National Association | 0.08 | 55.00 | 4.35 | 61.48 | 2.0307 | 0.7820 | |||
| WAL / Western Alliance Bancorporation | 0.06 | 63.03 | 4.34 | 65.51 | 2.0242 | 0.8096 | |||
| HRI / Herc Holdings Inc. | 0.03 | 100.03 | 4.34 | 96.24 | 2.0236 | 0.9995 | |||
| BJ / BJ's Wholesale Club Holdings, Inc. | 0.04 | 39.52 | 4.33 | 31.87 | 2.0212 | 0.4992 | |||
| VST / Vistra Corp. | 0.02 | 57.75 | 4.33 | 160.37 | 2.0206 | 1.2499 | |||
| WAB / Westinghouse Air Brake Technologies Corporation | 0.02 | 68.32 | 4.29 | 94.29 | 2.0009 | 0.9785 | |||
| MRVL / Marvell Technology, Inc. | 0.06 | -26.92 | 4.27 | -8.13 | 1.9929 | -0.1608 | |||
| LECO / Lincoln Electric Holdings, Inc. | 0.02 | 12.85 | 4.24 | 23.67 | 1.9796 | 0.3905 | |||
| FN / Fabrinet | 0.01 | 163.50 | 4.13 | 293.33 | 1.9255 | 1.4392 | |||
| SYF / Synchrony Financial | 0.06 | 38.40 | 4.12 | 165.32 | 1.9241 | 1.4586 | |||
| EVRG / Evergy, Inc. | 0.06 | -8.58 | 4.11 | -8.60 | 1.9184 | -0.1657 | |||
| WEC / WEC Energy Group, Inc. | 0.04 | -8.59 | 4.05 | -12.62 | 1.8905 | -0.2571 | |||
| SSNC / SS&C Technologies Holdings, Inc. | 0.05 | -8.59 | 3.93 | -9.39 | 1.8325 | -0.1754 | |||
| CMS / CMS Energy Corporation | 0.06 | -8.59 | 3.92 | -15.69 | 1.8281 | -0.3246 | |||
| AZO / AutoZone, Inc. | 0.00 | -50.98 | 3.91 | -52.28 | 1.8238 | -1.9701 | |||
| LNT / Alliant Energy Corporation | 0.06 | -53.93 | 3.89 | -56.71 | 1.8167 | -2.3497 | |||
| MPWR / Monolithic Power Systems, Inc. | 0.01 | 19.48 | 3.86 | 47.70 | 1.8000 | 0.7271 | |||
| VRT / Vertiv Holdings Co | 0.03 | 131.54 | 3.64 | 312.10 | 1.7000 | 1.2901 | |||
| NDAQ / Nasdaq, Inc. | 0.04 | -8.59 | 3.61 | 7.74 | 1.6828 | 0.1322 | |||
| CACI / CACI International Inc | 0.01 | -21.60 | 3.48 | 1.85 | 1.6225 | 0.0409 | |||
| EGP / EastGroup Properties, Inc. | 0.02 | -62.40 | 3.47 | -64.33 | 1.6172 | -2.8843 | |||
| CIEN / Ciena Corporation | 0.04 | 3.45 | 1.6080 | 1.6080 | |||||
| FND / Floor & Decor Holdings, Inc. | 0.04 | 185.80 | 3.34 | 118.51 | 1.5589 | 0.9311 | |||
| ROK / Rockwell Automation, Inc. | 0.01 | -25.28 | 3.33 | -3.95 | 1.5552 | -0.0522 | |||
| DPZ / Domino's Pizza, Inc. | 0.01 | -20.87 | 3.28 | -22.39 | 1.5305 | -0.4276 | |||
| PH / Parker-Hannifin Corporation | 0.00 | 105.82 | 3.21 | 136.52 | 1.4991 | 0.8697 | |||
| TOL / Toll Brothers, Inc. | 0.03 | 171.59 | 3.13 | 193.80 | 1.4585 | 0.9652 | |||
| OWL / Blue Owl Capital Inc. | 0.16 | 478.42 | 3.10 | 455.28 | 1.4485 | 1.1891 | |||
| CR / Crane Company | 0.02 | 2.89 | 3.01 | 27.60 | 1.4020 | 0.3107 | |||
| CMA / Comerica Incorporated | 0.05 | 9.31 | 2.96 | 10.40 | 1.3819 | 0.1392 | |||
| 2IY / Cushman & Wakefield plc | 0.26 | -53.72 | 2.91 | -60.83 | 1.3554 | -1.6906 | |||
| DHI / D.R. Horton, Inc. | 0.02 | 133.52 | 2.70 | 136.90 | 1.2613 | 0.7325 | |||
| AME / AMETEK, Inc. | 0.01 | -8.60 | 2.69 | -3.93 | 1.2555 | -0.0419 | |||
| FLS / Flowserve Corporation | 0.05 | 26.07 | 2.68 | 35.15 | 1.2525 | 0.3322 | |||
| RSG / Republic Services, Inc. | 0.01 | -62.66 | 2.65 | -61.98 | 1.2386 | -1.9955 | |||
| FIXED INC CLEARING CORP.REPO / RA (000000000) | 2.48 | 1.1583 | 1.1583 | ||||||
| XPO / XPO, Inc. | 0.02 | -37.12 | 2.37 | -26.19 | 1.1060 | -0.3816 | |||
| AEO / American Eagle Outfitters, Inc. | 0.24 | 32.46 | 2.27 | 9.65 | 1.0604 | 0.1003 | |||
| RRC / Range Resources Corporation | 0.05 | -56.74 | 2.08 | -55.94 | 0.9693 | -1.2148 | |||
| HLIO / Helios Technologies, Inc. | 0.06 | -33.94 | 2.06 | -31.30 | 0.9608 | -0.4279 | |||
| FTI / TechnipFMC plc | 0.06 | -41.46 | 2.05 | -36.37 | 0.9566 | -0.5363 | |||
| EXR / Extra Space Storage Inc. | 0.01 | -37.95 | 1.98 | -38.40 | 0.9221 | -0.5640 | |||
| ALLE / Allegion plc | 0.01 | -8.57 | 1.95 | 1.04 | 0.9108 | 0.0155 | |||
| A / Agilent Technologies, Inc. | 0.01 | -8.60 | 1.75 | -7.83 | 0.8187 | -0.0629 | |||
| ARES / Ares Management Corporation | 0.01 | 175.11 | 1.67 | 225.20 | 0.7770 | 0.5396 | |||
| TREX / Trex Company, Inc. | 0.03 | 1.54 | 0.7189 | 0.7189 | |||||
| CCL / Carnival Corporation & plc | 0.04 | -8.59 | 1.21 | 31.70 | 0.5661 | 0.1391 | |||
| RCL / Royal Caribbean Cruises Ltd. | 0.00 | -21.24 | 1.16 | 20.06 | 0.5391 | 0.0933 | |||
| CDW / CDW Corporation | 0.01 | -68.75 | 1.04 | -65.17 | 0.4858 | -0.8991 |