Mga Batayang Estadistika
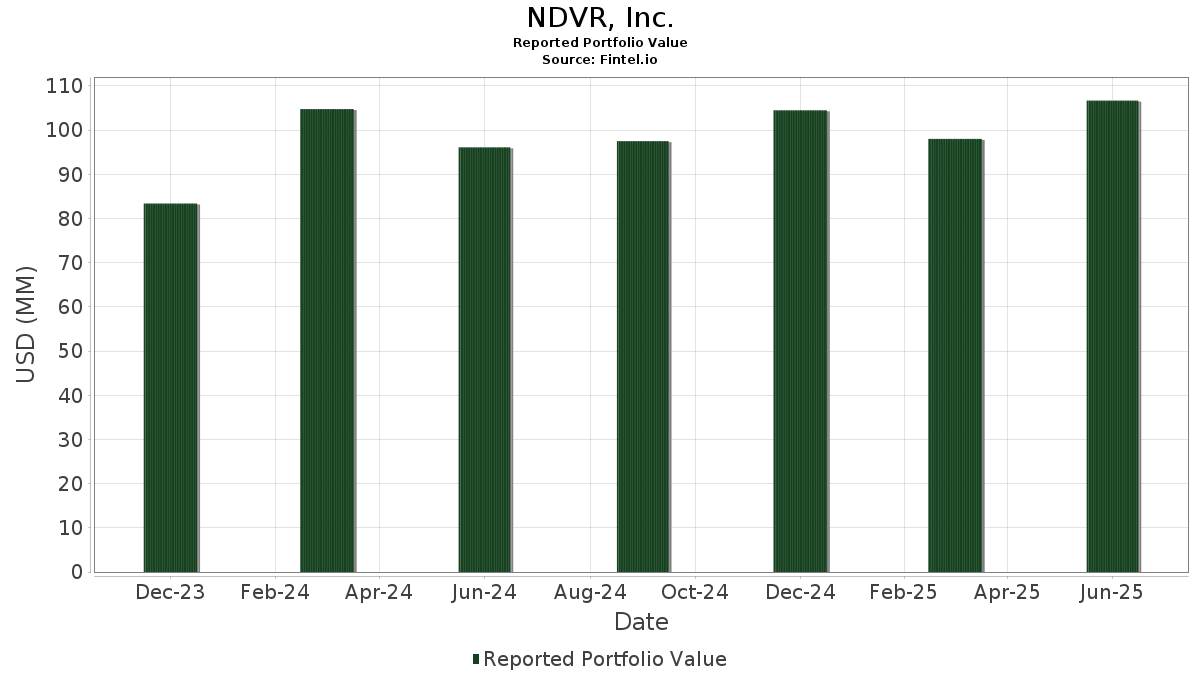
| Nilai Portofolio | $ 106,681,862 |
| Posisi Saat Ini | 103 |
Kepemilikan Terbaru, Kinerja, AUM (dari 13F, 13D)
NDVR, Inc. telah mengungkapkan total kepemilikan 103 dalam pengajuan SEC terbaru mereka. Nilai portofolio terbaru dihitung sebesar $ 106,681,862 USD. Aset yang Dikelola (AUM) sebenarnya adalah nilai ini ditambah kas (yang tidak diungkapkan). Aset-aset utama NDVR, Inc. adalah Vanguard Tax-Managed Funds - Vanguard FTSE Developed Markets ETF (US:VEA) , HubSpot, Inc. (US:HUBS) , Vanguard International Equity Index Funds - Vanguard FTSE Emerging Markets ETF (US:VWO) , Amazon.com, Inc. (US:AMZN) , and Microsoft Corporation (US:MSFT) . Posisi baru NDVR, Inc. meliputi: iShares Trust - iShares 0-3 Month Treasury Bond ETF (US:SGOV) , Exelixis, Inc. (US:EXEL) , Perdoceo Education Corporation (US:PRDO) , .
Peningkatan Tertinggi Kuartal Ini
Kami menggunakan perubahan dalam alokasi portofolio karena ini adalah metrik yang paling bermakna. Perubahan dapat disebabkan oleh perdagangan atau perubahan harga saham.
| Keamanan | Saham (MM) |
Nilai (Juta Dolar AS) |
Portfolio % | ΔPorsyento ng Portfolio |
|---|---|---|---|---|
| 0.45 | 25.74 | 24.1279 | 0.8372 | |
| 0.01 | 4.60 | 4.3073 | 0.5839 | |
| 0.02 | 2.51 | 2.3503 | 0.5621 | |
| 0.00 | 0.38 | 0.3588 | 0.3588 | |
| 0.02 | 5.35 | 5.0135 | 0.3182 | |
| 0.00 | 0.28 | 0.2610 | 0.2610 | |
| 0.00 | 0.28 | 0.2588 | 0.2588 | |
| 0.00 | 0.50 | 0.4653 | 0.2551 | |
| 0.01 | 0.27 | 0.2536 | 0.2536 | |
| 0.00 | 0.26 | 0.2468 | 0.2468 |
Penurunan Tertinggi Kuartal Ini
Kami menggunakan perubahan dalam alokasi portofolio karena ini adalah metrik yang paling bermakna. Perubahan dapat disebabkan oleh perdagangan atau perubahan harga saham.
| Keamanan | Saham (MM) |
Nilai (Juta Dolar AS) |
Portfolio % | ΔPorsyento ng Portfolio |
|---|---|---|---|---|
| 0.03 | 16.95 | 15.8873 | -1.8599 | |
| 0.00 | 0.72 | 0.6739 | -0.1428 | |
| 0.02 | 1.63 | 1.5256 | -0.1230 | |
| 0.00 | 0.23 | 0.2148 | -0.1227 | |
| 0.06 | 4.11 | 3.8530 | -0.1083 | |
| 0.00 | 0.31 | 0.2912 | -0.0972 | |
| 0.00 | 0.49 | 0.4589 | -0.0945 | |
| 0.00 | 0.45 | 0.4237 | -0.0791 | |
| 0.00 | 0.27 | 0.2532 | -0.0670 | |
| 0.00 | 0.43 | 0.4066 | -0.0661 |
Pengajuan 13F dan Dana
Formulir ini diajukan pada 2025-08-12 untuk periode pelaporan 2025-06-30. Klik ikon tautan untuk melihat riwayat transaksi selengkapnya.
Tingkatkan ke versi premium untuk membuka data premium dan ekspor ke Excel. ![]() .
.
| Keamanan | Ketik | Harga Saham Rata-rata | Saham (MM) |
ΔSaham (%) |
ΔSaham (%) |
Nilai ($MM) |
Portpolyo (%) |
ΔPortofolio (%) |
|
|---|---|---|---|---|---|---|---|---|---|
| VEA / Vanguard Tax-Managed Funds - Vanguard FTSE Developed Markets ETF | 0.45 | 0.53 | 25.74 | 12.76 | 24.1279 | 0.8372 | |||
| HUBS / HubSpot, Inc. | 0.03 | 0.00 | 16.95 | -2.57 | 15.8873 | -1.8599 | |||
| VWO / Vanguard International Equity Index Funds - Vanguard FTSE Emerging Markets ETF | 0.18 | 2.13 | 8.77 | 11.60 | 8.2166 | 0.2035 | |||
| AMZN / Amazon.com, Inc. | 0.02 | 0.79 | 5.35 | 16.21 | 5.0135 | 0.3182 | |||
| MSFT / Microsoft Corporation | 0.01 | -4.98 | 4.60 | 25.92 | 4.3073 | 0.5839 | |||
| GLDM / World Gold Trust - SPDR Gold MiniShares Trust | 0.06 | 0.00 | 4.11 | 5.87 | 3.8530 | -0.1083 | |||
| NVDA / NVIDIA Corporation | 0.02 | -1.87 | 2.51 | 43.09 | 2.3503 | 0.5621 | |||
| AAPL / Apple Inc. | 0.01 | 21.80 | 2.34 | 12.51 | 2.1932 | 0.0713 | |||
| VOO / Vanguard Index Funds - Vanguard S&P 500 ETF | 0.00 | -1.57 | 1.67 | 8.77 | 1.5697 | -0.0006 | |||
| IEFA / iShares Trust - iShares Core MSCI EAFE ETF | 0.02 | -8.73 | 1.63 | 0.74 | 1.5256 | -0.1230 | |||
| VTI / Vanguard Index Funds - Vanguard Total Stock Market ETF | 0.00 | -2.41 | 1.45 | 7.88 | 1.3609 | -0.0116 | |||
| META / Meta Platforms, Inc. | 0.00 | -0.61 | 0.97 | 27.24 | 0.9070 | 0.1314 | |||
| WMT / Walmart Inc. | 0.01 | 0.20 | 0.86 | 11.54 | 0.8067 | 0.0200 | |||
| SCHF / Schwab Strategic Trust - Schwab International Equity ETF | 0.03 | -4.42 | 0.75 | 6.73 | 0.6989 | -0.0134 | |||
| GOOG / Alphabet Inc. | 0.00 | -20.90 | 0.72 | -10.25 | 0.6739 | -0.1428 | |||
| EPAM / EPAM Systems, Inc. | 0.00 | 0.00 | 0.71 | 4.74 | 0.6630 | -0.0260 | |||
| GOOGL / Alphabet Inc. | 0.00 | 0.36 | 0.64 | 14.39 | 0.5970 | 0.0289 | |||
| JPM / JPMorgan Chase & Co. | 0.00 | -1.37 | 0.56 | 16.39 | 0.5267 | 0.0349 | |||
| AVGO / Broadcom Inc. | 0.00 | 6.31 | 0.51 | 75.60 | 0.4790 | 0.1811 | |||
| IEMG / iShares, Inc. - iShares Core MSCI Emerging Markets ETF | 0.01 | -4.31 | 0.51 | 6.30 | 0.4752 | -0.0107 | |||
| COF / Capital One Financial Corporation | 0.00 | 103.05 | 0.50 | 140.78 | 0.4653 | 0.2551 | |||
| XOM / Exxon Mobil Corporation | 0.00 | -0.44 | 0.49 | -9.78 | 0.4589 | -0.0945 | |||
| LRN / Stride, Inc. | 0.00 | -3.88 | 0.49 | 10.38 | 0.4586 | 0.0062 | |||
| PGR / The Progressive Corporation | 0.00 | 3.12 | 0.48 | -2.86 | 0.4468 | -0.0533 | |||
| IBM / International Business Machines Corporation | 0.00 | 1.64 | 0.46 | 20.63 | 0.4280 | 0.0414 | |||
| ABBV / AbbVie Inc. | 0.00 | 3.53 | 0.45 | -8.33 | 0.4237 | -0.0791 | |||
| BRK.B / Berkshire Hathaway Inc. | 0.00 | 2.64 | 0.43 | -6.48 | 0.4066 | -0.0661 | |||
| MCK / McKesson Corporation | 0.00 | -0.51 | 0.43 | 8.33 | 0.4025 | -0.0019 | |||
| MLI / Mueller Industries, Inc. | 0.01 | 0.64 | 0.40 | 5.24 | 0.3770 | -0.0136 | |||
| V / Visa Inc. | 0.00 | 18.70 | 0.40 | 20.42 | 0.3761 | 0.0357 | |||
| ALSN / Allison Transmission Holdings, Inc. | 0.00 | 1.50 | 0.39 | 0.79 | 0.3612 | -0.0289 | |||
| CAH / Cardinal Health, Inc. | 0.00 | 0.13 | 0.38 | 21.97 | 0.3597 | 0.0391 | |||
| SGOV / iShares Trust - iShares 0-3 Month Treasury Bond ETF | 0.00 | 0.38 | 0.3588 | 0.3588 | |||||
| HIG / The Hartford Insurance Group, Inc. | 0.00 | 3.76 | 0.37 | 6.25 | 0.3511 | -0.0081 | |||
| WRB / W. R. Berkley Corporation | 0.00 | 1.96 | 0.37 | 5.48 | 0.3431 | -0.0116 | |||
| UNM / Unum Group | 0.00 | 3.31 | 0.37 | 2.53 | 0.3426 | -0.0215 | |||
| EME / EMCOR Group, Inc. | 0.00 | -30.02 | 0.36 | 1.13 | 0.3354 | -0.0251 | |||
| COR / Cencora, Inc. | 0.00 | -0.59 | 0.36 | 7.25 | 0.3331 | -0.0051 | |||
| MTG / MGIC Investment Corporation | 0.01 | 3.63 | 0.35 | 16.50 | 0.3316 | 0.0216 | |||
| GILD / Gilead Sciences, Inc. | 0.00 | 8.79 | 0.35 | 7.67 | 0.3292 | -0.0037 | |||
| TRV / The Travelers Companies, Inc. | 0.00 | 5.14 | 0.35 | 6.40 | 0.3280 | -0.0076 | |||
| LOPE / Grand Canyon Education, Inc. | 0.00 | 2.91 | 0.35 | 12.66 | 0.3254 | 0.0104 | |||
| TSLA / Tesla, Inc. | 0.00 | -4.65 | 0.35 | 16.95 | 0.3237 | 0.0222 | |||
| KR / The Kroger Co. | 0.00 | 6.31 | 0.34 | 12.75 | 0.3151 | 0.0107 | |||
| IDCC / InterDigital, Inc. | 0.00 | -1.33 | 0.33 | 7.10 | 0.3113 | -0.0053 | |||
| CALM / Cal-Maine Foods, Inc. | 0.00 | 5.47 | 0.33 | 15.49 | 0.3078 | 0.0180 | |||
| AMP / Ameriprise Financial, Inc. | 0.00 | -0.16 | 0.33 | 10.07 | 0.3077 | 0.0034 | |||
| AXP / American Express Company | 0.00 | -4.47 | 0.33 | 13.19 | 0.3065 | 0.0119 | |||
| SFM / Sprouts Farmers Market, Inc. | 0.00 | -6.74 | 0.33 | 0.31 | 0.3056 | -0.0250 | |||
| LDOS / Leidos Holdings, Inc. | 0.00 | 1.66 | 0.32 | 19.03 | 0.2993 | 0.0252 | |||
| TJX / The TJX Companies, Inc. | 0.00 | 4.91 | 0.32 | 6.40 | 0.2966 | -0.0069 | |||
| COKE / Coca-Cola Consolidated, Inc. | 0.00 | 886.52 | 0.31 | -18.42 | 0.2912 | -0.0972 | |||
| L / Loews Corporation | 0.00 | 4.84 | 0.31 | 4.39 | 0.2905 | -0.0119 | |||
| LNG / Cheniere Energy, Inc. | 0.00 | 1.04 | 0.31 | 6.57 | 0.2890 | -0.0068 | |||
| PJT / PJT Partners Inc. | 0.00 | 0.99 | 0.30 | 20.80 | 0.2840 | 0.0282 | |||
| ORI / Old Republic International Corporation | 0.01 | 5.64 | 0.30 | 3.42 | 0.2835 | -0.0145 | |||
| PRI / Primerica, Inc. | 0.00 | 1.29 | 0.30 | -2.60 | 0.2817 | -0.0330 | |||
| FOXA / Fox Corporation | 0.01 | 6.60 | 0.30 | 5.65 | 0.2808 | -0.0088 | |||
| T / AT&T Inc. | 0.01 | 15.39 | 0.30 | 18.33 | 0.2788 | 0.0218 | |||
| FHI / Federated Hermes, Inc. | 0.01 | 10.89 | 0.29 | 20.58 | 0.2753 | 0.0267 | |||
| CSCO / Cisco Systems, Inc. | 0.00 | 1.84 | 0.29 | 14.57 | 0.2732 | 0.0135 | |||
| ATGE / Adtalem Global Education Inc. | 0.00 | 0.22 | 0.29 | 27.07 | 0.2730 | 0.0385 | |||
| AFL / Aflac Incorporated | 0.00 | -2.04 | 0.28 | -6.89 | 0.2662 | -0.0456 | |||
| MET / MetLife, Inc. | 0.00 | -0.56 | 0.28 | -0.35 | 0.2656 | -0.0247 | |||
| GE / General Electric Company | 0.00 | -0.99 | 0.28 | 27.60 | 0.2644 | 0.0384 | |||
| NMIH / NMI Holdings, Inc. | 0.01 | 2.29 | 0.28 | 19.66 | 0.2628 | 0.0239 | |||
| ORLY / O'Reilly Automotive, Inc. | 0.00 | 1,462.63 | 0.28 | -1.77 | 0.2614 | -0.0280 | |||
| NEU / NewMarket Corporation | 0.00 | 0.28 | 0.2610 | 0.2610 | |||||
| HURN / Huron Consulting Group Inc. | 0.00 | 26.49 | 0.28 | 20.96 | 0.2604 | 0.0267 | |||
| FTDR / Frontdoor, Inc. | 0.00 | 0.28 | 0.2588 | 0.2588 | |||||
| IAU / iShares Gold Trust | 0.00 | 0.00 | 0.27 | 5.79 | 0.2577 | -0.0075 | |||
| FNF / Fidelity National Financial, Inc. | 0.00 | 2.76 | 0.27 | -11.65 | 0.2565 | -0.0589 | |||
| VIRT / Virtu Financial, Inc. | 0.01 | 13.81 | 0.27 | 33.66 | 0.2539 | 0.0473 | |||
| EXEL / Exelixis, Inc. | 0.01 | 0.27 | 0.2536 | 0.2536 | |||||
| MUSA / Murphy USA Inc. | 0.00 | -0.60 | 0.27 | -13.74 | 0.2532 | -0.0670 | |||
| HRB / H&R Block, Inc. | 0.00 | 3.23 | 0.26 | 3.13 | 0.2482 | -0.0136 | |||
| FOX / Fox Corporation | 0.01 | 1.43 | 0.26 | -0.38 | 0.2468 | -0.0236 | |||
| JBL / Jabil Inc. | 0.00 | 0.26 | 0.2468 | 0.2468 | |||||
| INGR / Ingredion Incorporated | 0.00 | 8.22 | 0.26 | 8.71 | 0.2460 | -0.0007 | |||
| GWW / W.W. Grainger, Inc. | 0.00 | 3.70 | 0.26 | 9.17 | 0.2457 | 0.0008 | |||
| GPOR / Gulfport Energy Corporation | 0.00 | -4.74 | 0.26 | 4.03 | 0.2427 | -0.0111 | |||
| CI / The Cigna Group | 0.00 | 4.99 | 0.26 | 5.33 | 0.2414 | -0.0077 | |||
| BRC / Brady Corporation | 0.00 | 0.73 | 0.25 | -3.07 | 0.2379 | -0.0293 | |||
| CNA / CNA Financial Corporation | 0.01 | 2.95 | 0.25 | -5.62 | 0.2363 | -0.0364 | |||
| RS / Reliance, Inc. | 0.00 | -1.12 | 0.25 | 7.79 | 0.2336 | -0.0029 | |||
| DVA / DaVita Inc. | 0.00 | -3.41 | 0.25 | -9.89 | 0.2306 | -0.0484 | |||
| MKL / Markel Group Inc. | 0.00 | -0.81 | 0.25 | 6.06 | 0.2303 | -0.0062 | |||
| RGA / Reinsurance Group of America, Incorporated | 0.00 | -8.02 | 0.25 | -7.55 | 0.2302 | -0.0402 | |||
| PPC / Pilgrim's Pride Corporation | 0.01 | 12.23 | 0.24 | -7.28 | 0.2270 | -0.0398 | |||
| MCY / Mercury General Corporation | 0.00 | 0.24 | 0.2262 | 0.2262 | |||||
| AIZ / Assurant, Inc. | 0.00 | 5.91 | 0.24 | -0.41 | 0.2257 | -0.0206 | |||
| LLY / Eli Lilly and Company | 0.00 | -7.62 | 0.24 | -12.59 | 0.2214 | -0.0550 | |||
| ALL / The Allstate Corporation | 0.00 | 10.99 | 0.23 | 7.87 | 0.2191 | -0.0019 | |||
| CASY / Casey's General Stores, Inc. | 0.00 | -41.08 | 0.23 | -30.61 | 0.2148 | -0.1227 | |||
| CNX / CNX Resources Corporation | 0.01 | -4.85 | 0.23 | 1.79 | 0.2131 | -0.0147 | |||
| TYA / Simplify Exchange Traded Funds - Simplify Intermediate Term Treasury Futures Strategy ETF | 0.02 | 1.02 | 0.22 | 2.80 | 0.2068 | -0.0117 | |||
| MO / Altria Group, Inc. | 0.00 | 11.22 | 0.22 | 8.46 | 0.2049 | -0.0004 | |||
| IVV / iShares Trust - iShares Core S&P 500 ETF | 0.00 | 0.22 | 0.2049 | 0.2049 | |||||
| MPC / Marathon Petroleum Corporation | 0.00 | -22.14 | 0.22 | -11.11 | 0.2026 | -0.0458 | |||
| PRDO / Perdoceo Education Corporation | 0.01 | 0.21 | 0.1967 | 0.1967 | |||||
| CNM / Core & Main, Inc. | 0.00 | 0.20 | 0.1920 | 0.1920 | |||||
| GNW / Genworth Financial, Inc. | 0.02 | 0.16 | 0.17 | 10.00 | 0.1549 | 0.0015 | |||
| ADT / ADT Inc. | 0.02 | 77.67 | 0.16 | 85.88 | 0.1481 | 0.0609 | |||
| UNH / UnitedHealth Group Incorporated | 0.00 | -100.00 | 0.00 | 0.0000 | |||||
| EXPD / Expeditors International of Washington, Inc. | 0.00 | -100.00 | 0.00 | 0.0000 | |||||
| ITOT / iShares Trust - iShares Core S&P Total U.S. Stock Market ETF | 0.00 | -100.00 | 0.00 | 0.0000 | |||||
| VLO / Valero Energy Corporation | 0.00 | -100.00 | 0.00 | 0.0000 | |||||
| DFS / Discover Financial Services | 0.00 | -100.00 | 0.00 | 0.0000 | |||||
| CVX / Chevron Corporation | 0.00 | -100.00 | 0.00 | 0.0000 | |||||
| UTHR / United Therapeutics Corporation | 0.00 | -100.00 | 0.00 | 0.0000 | |||||
| COP / ConocoPhillips | 0.00 | -100.00 | 0.00 | 0.0000 |