Mga Batayang Estadistika
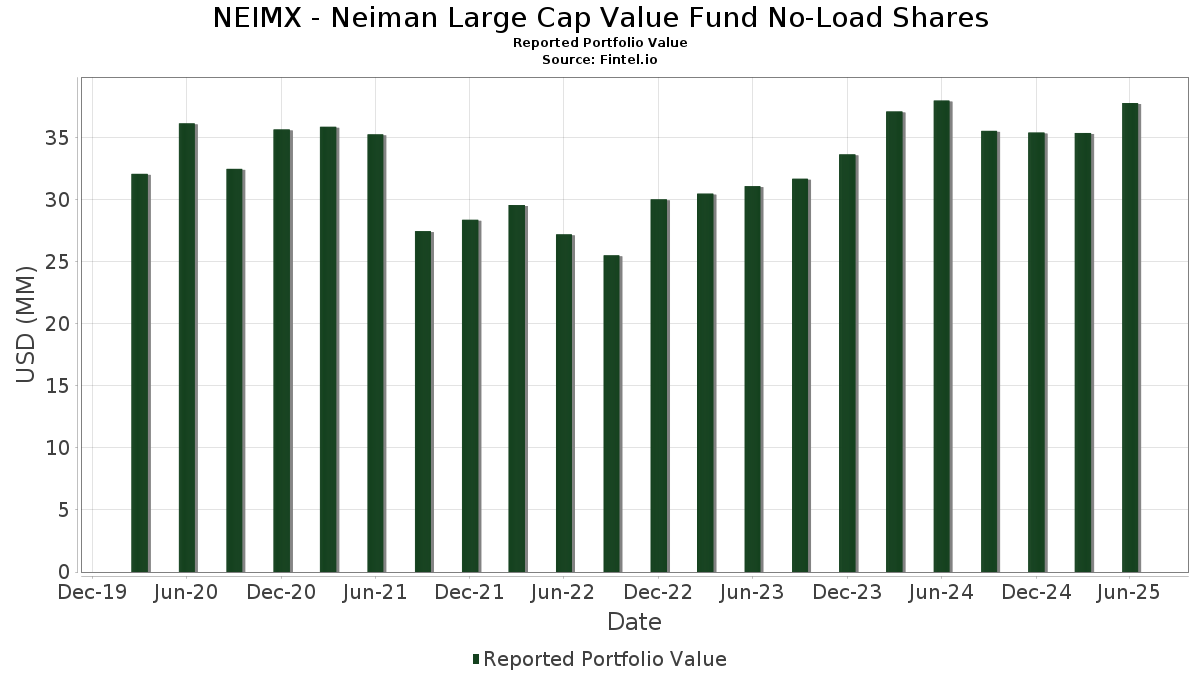
| Nilai Portofolio | $ 37,812,940 |
| Posisi Saat Ini | 37 |
Kepemilikan Terbaru, Kinerja, AUM (dari 13F, 13D)
NEIMX - Neiman Large Cap Value Fund No-Load Shares telah mengungkapkan total kepemilikan 37 dalam pengajuan SEC terbaru mereka. Nilai portofolio terbaru dihitung sebesar $ 37,812,940 USD. Aset yang Dikelola (AUM) sebenarnya adalah nilai ini ditambah kas (yang tidak diungkapkan). Aset-aset utama NEIMX - Neiman Large Cap Value Fund No-Load Shares adalah Goldman Sachs Trust - Goldman Sachs Financial Square Government Fund (US:GSAXX) , Costco Wholesale Corporation (US:COST) , RTX Corporation (US:RTX) , Broadcom Inc. (US:AVGO) , and Microsoft Corporation (US:MSFT) .
Peningkatan Tertinggi Kuartal Ini
Kami menggunakan perubahan dalam alokasi portofolio karena ini adalah metrik yang paling bermakna. Perubahan dapat disebabkan oleh perdagangan atau perubahan harga saham.
| Keamanan | Saham (MM) |
Nilai (Juta Dolar AS) |
Portfolio % | ΔPorsyento ng Portfolio |
|---|---|---|---|---|
| 0.01 | 1.57 | 4.1500 | 1.4500 | |
| 0.01 | 1.11 | 2.9200 | 0.7800 | |
| 0.00 | 1.49 | 3.9400 | 0.7600 | |
| 0.01 | 1.31 | 3.4700 | 0.7000 | |
| 0.00 | 1.32 | 3.4900 | 0.6500 | |
| 0.00 | 1.03 | 2.7300 | 0.4500 | |
| 0.01 | 1.33 | 3.5200 | 0.2900 | |
| 0.00 | 1.01 | 2.6800 | 0.2500 | |
| 0.01 | 1.22 | 3.2300 | 0.2200 | |
| 0.00 | 0.76 | 2.0100 | 0.1900 |
Penurunan Tertinggi Kuartal Ini
Kami menggunakan perubahan dalam alokasi portofolio karena ini adalah metrik yang paling bermakna. Perubahan dapat disebabkan oleh perdagangan atau perubahan harga saham.
| Keamanan | Saham (MM) |
Nilai (Juta Dolar AS) |
Portfolio % | ΔPorsyento ng Portfolio |
|---|---|---|---|---|
| 0.00 | 0.50 | 1.3200 | -1.0500 | |
| 0.01 | 0.87 | 2.3100 | -0.5700 | |
| 0.01 | 1.33 | 3.5300 | -0.5500 | |
| 1.96 | 1.96 | 5.1800 | -0.4800 | |
| 0.01 | 1.00 | 2.6500 | -0.4800 | |
| 0.01 | 0.90 | 2.3800 | -0.3900 | |
| 0.01 | 0.68 | 1.8000 | -0.3800 | |
| 0.01 | 0.81 | 2.1500 | -0.3100 | |
| 0.00 | 0.63 | 1.6700 | -0.2900 | |
| 0.00 | 0.81 | 2.1300 | -0.2500 |
Pengajuan 13F dan Dana
Formulir ini diajukan pada 2025-08-27 untuk periode pelaporan 2025-06-30. Klik ikon tautan untuk melihat riwayat transaksi selengkapnya.
Tingkatkan ke versi premium untuk membuka data premium dan ekspor ke Excel. ![]() .
.
| Keamanan | Ketik | Harga Saham Rata-rata | Saham (MM) |
ΔSaham (%) |
ΔSaham (%) |
Nilai ($MM) |
Portpolyo (%) |
ΔPortofolio (%) |
|
|---|---|---|---|---|---|---|---|---|---|
| GSAXX / Goldman Sachs Trust - Goldman Sachs Financial Square Government Fund | 1.96 | -2.10 | 1.96 | -2.10 | 5.1800 | -0.4800 | |||
| COST / Costco Wholesale Corporation | 0.00 | 0.00 | 1.88 | 4.68 | 4.9700 | -0.1100 | |||
| RTX / RTX Corporation | 0.01 | 0.00 | 1.66 | 10.20 | 4.4000 | 0.1300 | |||
| AVGO / Broadcom Inc. | 0.01 | 0.00 | 1.57 | 64.68 | 4.1500 | 1.4500 | |||
| MSFT / Microsoft Corporation | 0.00 | 0.00 | 1.49 | 32.50 | 3.9400 | 0.7600 | |||
| AAPL / Apple Inc. | 0.01 | 0.00 | 1.33 | -7.62 | 3.5300 | -0.5500 | |||
| SCHW / The Charles Schwab Corporation | 0.01 | 0.00 | 1.33 | 16.64 | 3.5200 | 0.2900 | |||
| ETN / Eaton Corporation plc | 0.00 | 0.00 | 1.32 | 31.34 | 3.4900 | 0.6500 | |||
| LRCX / Lam Research Corporation | 0.01 | 0.00 | 1.31 | 33.94 | 3.4700 | 0.7000 | |||
| PM / Philip Morris International Inc. | 0.01 | 0.00 | 1.22 | 14.77 | 3.2300 | 0.2200 | |||
| SRE / Sempra | 0.02 | 0.00 | 1.19 | 6.16 | 3.1400 | -0.0300 | |||
| NVDA / NVIDIA Corporation | 0.01 | 0.00 | 1.11 | 45.78 | 2.9200 | 0.7800 | |||
| CME / CME Group Inc. | 0.00 | 0.00 | 1.10 | 3.86 | 2.9100 | -0.0900 | |||
| LAMR / Lamar Advertising Company | 0.01 | 0.00 | 1.07 | 6.59 | 2.8200 | -0.0100 | |||
| META / Meta Platforms, Inc. | 0.00 | 0.00 | 1.03 | 28.16 | 2.7300 | 0.4500 | |||
| ADP / Automatic Data Processing, Inc. | 0.00 | 0.00 | 1.02 | 0.89 | 2.6900 | -0.1600 | |||
| JPM / JPMorgan Chase & Co. | 0.00 | 0.00 | 1.01 | 18.18 | 2.6800 | 0.2500 | |||
| XOM / Exxon Mobil Corporation | 0.01 | 0.00 | 1.00 | -9.40 | 2.6500 | -0.4800 | |||
| KO / The Coca-Cola Company | 0.01 | 0.00 | 0.97 | -1.22 | 2.5600 | -0.2100 | |||
| PNC / The PNC Financial Services Group, Inc. | 0.01 | 0.00 | 0.93 | 6.15 | 2.4600 | -0.0200 | |||
| JNJ / Johnson & Johnson | 0.01 | 0.00 | 0.90 | -7.87 | 2.3800 | -0.3900 | |||
| CVX / Chevron Corporation | 0.01 | 0.00 | 0.87 | -14.41 | 2.3100 | -0.5700 | |||
| SCCO / Southern Copper Corporation | 0.01 | 0.98 | 0.86 | 9.38 | 2.2800 | 0.0500 | |||
| QCOM / QUALCOMM Incorporated | 0.01 | 0.00 | 0.84 | 3.69 | 2.2300 | -0.0700 | |||
| PSX / Phillips 66 | 0.01 | 0.00 | 0.82 | -3.40 | 2.1800 | -0.2300 | |||
| PG / The Procter & Gamble Company | 0.01 | 0.00 | 0.81 | -6.56 | 2.1500 | -0.3100 | |||
| ACN / Accenture plc | 0.00 | 0.00 | 0.81 | -4.16 | 2.1300 | -0.2500 | |||
| TXN / Texas Instruments Incorporated | 0.00 | 0.00 | 0.79 | 15.54 | 2.0900 | 0.1600 | |||
| UNP / Union Pacific Corporation | 0.00 | 0.00 | 0.78 | -2.62 | 2.0700 | -0.2000 | |||
| ADI / Analog Devices, Inc. | 0.00 | 0.00 | 0.76 | 17.98 | 2.0100 | 0.1900 | |||
| MRK / Merck & Co., Inc. | 0.01 | 0.00 | 0.68 | -11.80 | 1.8000 | -0.3800 | |||
| VLO / Valero Energy Corporation | 0.00 | 0.00 | 0.66 | 1.70 | 1.7400 | -0.0900 | |||
| BRK.B / Berkshire Hathaway Inc. | 0.00 | 0.00 | 0.63 | -8.82 | 1.6700 | -0.2900 | |||
| GOOGL / Alphabet Inc. | 0.00 | 0.00 | 0.62 | 13.86 | 1.6300 | 0.1000 | |||
| MO / Altria Group, Inc. | 0.01 | 0.00 | 0.61 | -2.40 | 1.6100 | -0.1500 | |||
| UNH / UnitedHealth Group Incorporated | 0.00 | 0.00 | 0.50 | -40.45 | 1.3200 | -1.0500 | |||
| ABBV / AbbVie Inc. | 0.00 | 0.00 | 0.33 | -11.41 | 0.8800 | -0.1900 |