Mga Batayang Estadistika
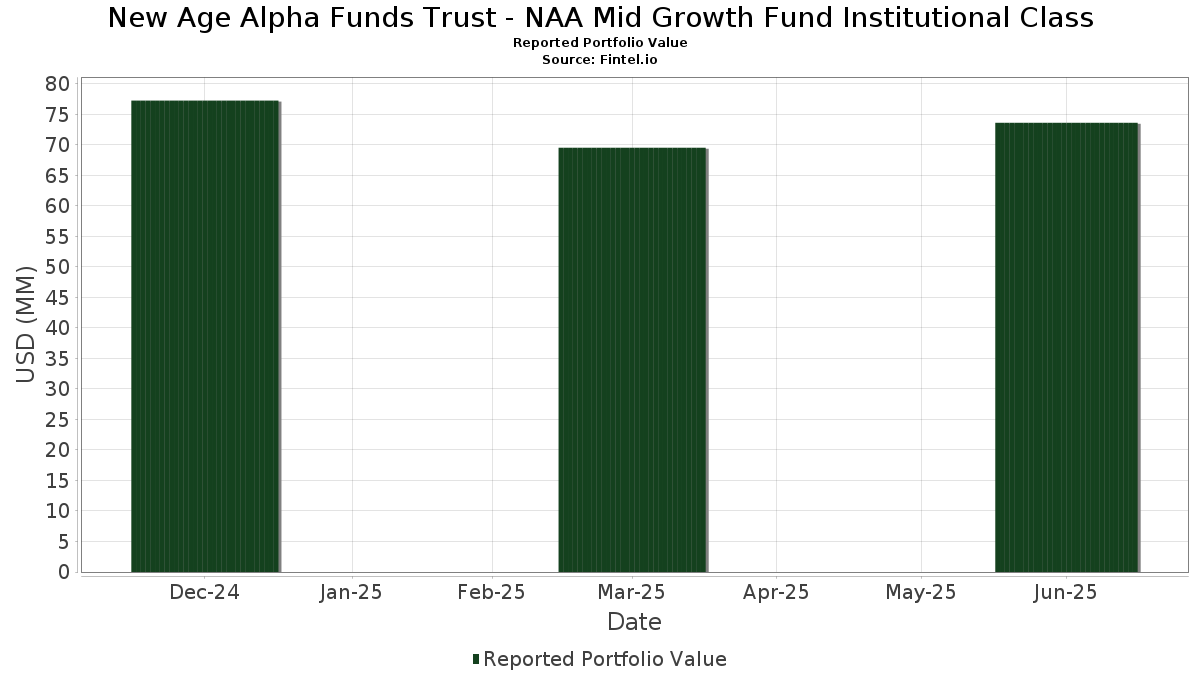
| Nilai Portofolio | $ 73,625,938 |
| Posisi Saat Ini | 128 |
Kepemilikan Terbaru, Kinerja, AUM (dari 13F, 13D)
New Age Alpha Funds Trust - NAA Mid Growth Fund Institutional Class telah mengungkapkan total kepemilikan 128 dalam pengajuan SEC terbaru mereka. Nilai portofolio terbaru dihitung sebesar $ 73,625,938 USD. Aset yang Dikelola (AUM) sebenarnya adalah nilai ini ditambah kas (yang tidak diungkapkan). Aset-aset utama New Age Alpha Funds Trust - NAA Mid Growth Fund Institutional Class adalah EMCOR Group, Inc. (US:EME) , Comfort Systems USA, Inc. (US:FIX) , Equitable Holdings, Inc. (US:EQH) , Curtiss-Wright Corporation (US:CW) , and Interactive Brokers Group, Inc. (US:IBKR) . Posisi baru New Age Alpha Funds Trust - NAA Mid Growth Fund Institutional Class meliputi: Colgate-Palmolive Company (US:CL) , Okta, Inc. (US:OKTA) , Dynatrace, Inc. (US:DT) , Guidewire Software, Inc. (US:GWRE) , and ONEOK, Inc. (US:OKE) .
Peningkatan Tertinggi Kuartal Ini
Kami menggunakan perubahan dalam alokasi portofolio karena ini adalah metrik yang paling bermakna. Perubahan dapat disebabkan oleh perdagangan atau perubahan harga saham.
| Keamanan | Saham (MM) |
Nilai (Juta Dolar AS) |
Portfolio % | ΔPorsyento ng Portfolio |
|---|---|---|---|---|
| 0.02 | 1.11 | 1.5129 | 1.5129 | |
| 0.01 | 1.08 | 1.4700 | 1.4700 | |
| 0.01 | 1.06 | 1.4394 | 1.4394 | |
| 0.02 | 1.04 | 1.4142 | 1.4142 | |
| 0.00 | 1.00 | 1.3595 | 1.3595 | |
| 0.01 | 0.99 | 1.3413 | 1.3413 | |
| 0.01 | 0.82 | 1.1204 | 1.1204 | |
| 0.01 | 0.81 | 1.0967 | 1.0967 | |
| 0.60 | 0.8179 | 0.8179 | ||
| 0.01 | 0.58 | 0.7913 | 0.7913 |
Penurunan Tertinggi Kuartal Ini
Kami menggunakan perubahan dalam alokasi portofolio karena ini adalah metrik yang paling bermakna. Perubahan dapat disebabkan oleh perdagangan atau perubahan harga saham.
| Keamanan | Saham (MM) |
Nilai (Juta Dolar AS) |
Portfolio % | ΔPorsyento ng Portfolio |
|---|---|---|---|---|
| 0.00 | 0.64 | 0.8653 | -0.8295 | |
| 0.01 | 0.88 | 1.1992 | -0.5219 | |
| 0.01 | 1.06 | 1.4471 | -0.2947 | |
| 0.01 | 0.78 | 1.0569 | -0.2938 | |
| 0.01 | 0.21 | 0.2828 | -0.2891 | |
| 0.01 | 0.66 | 0.8917 | -0.2323 | |
| 0.00 | 1.09 | 1.4762 | -0.2237 | |
| 0.00 | 0.91 | 1.2310 | -0.2127 | |
| 0.00 | 0.48 | 0.6584 | -0.2109 | |
| 0.02 | 1.10 | 1.5020 | -0.1898 |
Pengajuan 13F dan Dana
Formulir ini diajukan pada 2025-08-28 untuk periode pelaporan 2025-06-30. Klik ikon tautan untuk melihat riwayat transaksi selengkapnya.
Tingkatkan ke versi premium untuk membuka data premium dan ekspor ke Excel. ![]() .
.
| Keamanan | Ketik | Harga Saham Rata-rata | Saham (MM) |
ΔSaham (%) |
ΔSaham (%) |
Nilai ($MM) |
Portpolyo (%) |
ΔPortofolio (%) |
|
|---|---|---|---|---|---|---|---|---|---|
| EME / EMCOR Group, Inc. | 0.00 | -27.93 | 1.16 | 4.34 | 1.5711 | -0.0245 | |||
| FIX / Comfort Systems USA, Inc. | 0.00 | -8.74 | 1.13 | 51.96 | 1.5312 | 0.4629 | |||
| EQH / Equitable Holdings, Inc. | 0.02 | 1.11 | 1.5129 | 1.5129 | |||||
| CW / Curtiss-Wright Corporation | 0.00 | -8.63 | 1.11 | 40.84 | 1.5054 | 0.3721 | |||
| IBKR / Interactive Brokers Group, Inc. | 0.02 | 181.04 | 1.10 | -5.96 | 1.5020 | -0.1898 | |||
| ECL / Ecolab Inc. | 0.00 | -13.45 | 1.09 | -8.05 | 1.4762 | -0.2237 | |||
| CL / Colgate-Palmolive Company | 0.01 | 1.08 | 1.4700 | 1.4700 | |||||
| SPG / Simon Property Group, Inc. | 0.01 | 2.03 | 1.07 | -1.29 | 1.4588 | -0.1057 | |||
| RBA / RB Global, Inc. | 0.01 | -16.88 | 1.06 | -11.99 | 1.4471 | -0.2947 | |||
| DOCU / DocuSign, Inc. | 0.01 | 2.98 | 1.06 | -1.48 | 1.4448 | -0.1082 | |||
| SFM / Sprouts Farmers Market, Inc. | 0.01 | -0.95 | 1.06 | 6.86 | 1.4407 | 0.0123 | |||
| OKTA / Okta, Inc. | 0.01 | 1.06 | 1.4394 | 1.4394 | |||||
| DT / Dynatrace, Inc. | 0.02 | 1.04 | 1.4142 | 1.4142 | |||||
| BURL / Burlington Stores, Inc. | 0.00 | 7.31 | 1.02 | 4.70 | 1.3932 | -0.0156 | |||
| GWRE / Guidewire Software, Inc. | 0.00 | 1.00 | 1.3595 | 1.3595 | |||||
| OKE / ONEOK, Inc. | 0.01 | 0.99 | 1.3413 | 1.3413 | |||||
| WWD / Woodward, Inc. | 0.00 | -3.34 | 0.92 | 29.86 | 1.2542 | 0.2308 | |||
| TYL / Tyler Technologies, Inc. | 0.00 | -11.43 | 0.91 | -9.68 | 1.2310 | -0.2127 | |||
| DUOL / Duolingo, Inc. | 0.00 | -11.30 | 0.90 | 17.08 | 1.2216 | 0.1168 | |||
| BRO / Brown & Brown, Inc. | 0.01 | -17.19 | 0.88 | -26.21 | 1.1992 | -0.5219 | |||
| SMCI / Super Micro Computer, Inc. | 0.02 | -16.28 | 0.83 | 19.86 | 1.1331 | 0.1316 | |||
| OC / Owens Corning | 0.01 | 0.82 | 1.1204 | 1.1204 | |||||
| UTHR / United Therapeutics Corporation | 0.00 | -1.82 | 0.82 | -8.46 | 1.1187 | -0.1761 | |||
| BWXT / BWX Technologies, Inc. | 0.01 | -5.56 | 0.81 | 38.10 | 1.1043 | 0.2561 | |||
| MANH / Manhattan Associates, Inc. | 0.00 | 3.25 | 0.81 | 17.93 | 1.1004 | 0.1112 | |||
| ATI / ATI Inc. | 0.01 | 0.81 | 1.0967 | 1.0967 | |||||
| RBC / RBC Bearings Incorporated | 0.00 | 3.32 | 0.80 | 23.54 | 1.0926 | 0.1559 | |||
| NBIX / Neurocrine Biosciences, Inc. | 0.01 | -3.58 | 0.80 | 9.56 | 1.0910 | 0.0364 | |||
| TXRH / Texas Roadhouse, Inc. | 0.00 | -1.88 | 0.80 | 10.34 | 1.0890 | 0.0437 | |||
| PAYX / Paychex, Inc. | 0.01 | -12.09 | 0.78 | -17.08 | 1.0569 | -0.2938 | |||
| RNR / RenaissanceRe Holdings Ltd. | 0.00 | -6.15 | 0.77 | -5.05 | 1.0491 | -0.1208 | |||
| NVT / nVent Electric plc | 0.01 | -3.12 | 0.77 | 35.40 | 1.0412 | 0.2265 | |||
| CLH / Clean Harbors, Inc. | 0.00 | -0.76 | 0.76 | 16.44 | 1.0314 | 0.0929 | |||
| EXPE / Expedia Group, Inc. | 0.00 | -9.86 | 0.75 | -9.48 | 1.0258 | -0.1754 | |||
| IWP / iShares Trust - iShares Russell Mid-Cap Growth ETF | 0.01 | -9.84 | 0.74 | 6.47 | 1.0085 | 0.0047 | |||
| IJK / iShares Trust - iShares S&P Mid-Cap 400 Growth ETF | 0.01 | -0.94 | 0.74 | 8.18 | 1.0082 | 0.0214 | |||
| DTM / DT Midstream, Inc. | 0.01 | 4.36 | 0.73 | 18.92 | 0.9917 | 0.1081 | |||
| KNSL / Kinsale Capital Group, Inc. | 0.00 | 1.25 | 0.70 | 0.72 | 0.9581 | -0.0500 | |||
| WING / Wingstop Inc. | 0.00 | 5.04 | 0.67 | 56.88 | 0.9154 | 0.2970 | |||
| PEG / Public Service Enterprise Group Incorporated | 0.01 | -17.84 | 0.66 | -16.03 | 0.8917 | -0.2323 | |||
| HLI / Houlihan Lokey, Inc. | 0.00 | 1.63 | 0.64 | 13.27 | 0.8707 | 0.0562 | |||
| LII / Lennox International Inc. | 0.00 | -47.09 | 0.64 | -45.92 | 0.8653 | -0.8295 | |||
| EVR / Evercore Inc. | 0.00 | 0.82 | 0.63 | 36.29 | 0.8592 | 0.1915 | |||
| BLD / TopBuild Corp. | 0.00 | 1.46 | 0.63 | 7.71 | 0.8567 | 0.0142 | |||
| HQY / HealthEquity, Inc. | 0.01 | 4.87 | 0.63 | 24.40 | 0.8529 | 0.1262 | |||
| TTEK / Tetra Tech, Inc. | 0.02 | -1.04 | 0.62 | 21.68 | 0.8472 | 0.1096 | |||
| THC / Tenet Healthcare Corporation | 0.00 | -7.73 | 0.61 | 20.67 | 0.8343 | 0.1024 | |||
| BBH Overnight Sweep / STIV (N/A) | 0.60 | 0.8179 | 0.8179 | ||||||
| PRI / Primerica, Inc. | 0.00 | -0.87 | 0.59 | -4.53 | 0.8024 | -0.0890 | |||
| DECK / Deckers Outdoor Corporation | 0.01 | -0.14 | 0.58 | -8.03 | 0.7951 | -0.1198 | |||
| HIMS / Hims & Hers Health, Inc. | 0.01 | 0.58 | 0.7913 | 0.7913 | |||||
| ITT / ITT Inc. | 0.00 | -1.67 | 0.58 | 19.34 | 0.7897 | 0.0891 | |||
| WAL / Western Alliance Bancorporation | 0.01 | 4.67 | 0.58 | 6.23 | 0.7889 | 0.0023 | |||
| EHC / Encompass Health Corporation | 0.00 | -0.04 | 0.58 | 21.05 | 0.7821 | 0.0976 | |||
| RPM / RPM International Inc. | 0.01 | 9.01 | 0.57 | 3.44 | 0.7789 | -0.0182 | |||
| PLNT / Planet Fitness, Inc. | 0.01 | 0.57 | 0.7773 | 0.7773 | |||||
| LNW / Light & Wonder, Inc. | 0.01 | 1.59 | 0.56 | 13.03 | 0.7675 | 0.0475 | |||
| CHWY / Chewy, Inc. | 0.01 | 0.56 | 0.7584 | 0.7584 | |||||
| SGI / Somnigroup International Inc. | 0.01 | 22.04 | 0.56 | 38.75 | 0.7548 | 0.1783 | |||
| DOCS / Doximity, Inc. | 0.01 | 0.55 | 0.7520 | 0.7520 | |||||
| ENSG / The Ensign Group, Inc. | 0.00 | -3.38 | 0.55 | 15.27 | 0.7497 | 0.0603 | |||
| MORN / Morningstar, Inc. | 0.00 | 0.00 | 0.55 | 4.76 | 0.7488 | -0.0088 | |||
| PR / Permian Resources Corporation | 0.04 | -3.55 | 0.55 | -5.04 | 0.7429 | -0.0867 | |||
| AAL / American Airlines Group Inc. | 0.05 | 13.56 | 0.55 | 20.84 | 0.7415 | 0.0911 | |||
| PCTY / Paylocity Holding Corporation | 0.00 | 5.99 | 0.54 | 2.45 | 0.7407 | -0.0246 | |||
| DXCM / DexCom, Inc. | 0.01 | -10.72 | 0.53 | 14.25 | 0.7194 | 0.0516 | |||
| CVLT / Commvault Systems, Inc. | 0.00 | 6.54 | 0.53 | 17.71 | 0.7147 | 0.0717 | |||
| ACM / AECOM | 0.00 | 0.24 | 0.52 | 22.14 | 0.7127 | 0.0939 | |||
| GTLS / Chart Industries, Inc. | 0.00 | 10.85 | 0.50 | 26.72 | 0.6773 | 0.1098 | |||
| SF / Stifel Financial Corp. | 0.00 | 0.49 | 0.6727 | 0.6727 | |||||
| CHDN / Churchill Downs Incorporated | 0.00 | 1.94 | 0.49 | -7.32 | 0.6723 | -0.0959 | |||
| MEDP / Medpace Holdings, Inc. | 0.00 | -5.71 | 0.49 | -2.96 | 0.6701 | -0.0606 | |||
| SAIA / Saia, Inc. | 0.00 | 2.32 | 0.48 | -19.73 | 0.6584 | -0.2109 | |||
| ESAB / ESAB Corporation | 0.00 | 8.77 | 0.48 | 12.35 | 0.6567 | 0.0387 | |||
| CNM / Core & Main, Inc. | 0.01 | 2.39 | 0.48 | 27.85 | 0.6564 | 0.1128 | |||
| HRB / H&R Block, Inc. | 0.01 | -1.61 | 0.48 | -1.63 | 0.6561 | -0.0505 | |||
| ANSS / ANSYS, Inc. | 0.00 | -12.21 | 0.48 | -2.64 | 0.6524 | -0.0571 | |||
| RYAN / Ryan Specialty Holdings, Inc. | 0.01 | -0.20 | 0.47 | -8.19 | 0.6415 | -0.0982 | |||
| GMED / Globus Medical, Inc. | 0.01 | 7.25 | 0.47 | -13.63 | 0.6390 | -0.1437 | |||
| EXP / Eagle Materials Inc. | 0.00 | 4.02 | 0.46 | -5.36 | 0.6253 | -0.0739 | |||
| FOUR / Shift4 Payments, Inc. | 0.00 | 0.46 | 0.6190 | 0.6190 | |||||
| SLM / SLM Corporation | 0.01 | 0.45 | 0.6139 | 0.6139 | |||||
| LAMR / Lamar Advertising Company | 0.00 | 2.29 | 0.45 | 9.25 | 0.6109 | 0.0178 | |||
| HLNE / Hamilton Lane Incorporated | 0.00 | 15.85 | 0.45 | 10.62 | 0.6101 | 0.0266 | |||
| ELF / e.l.f. Beauty, Inc. | 0.00 | -2.40 | 0.45 | 93.48 | 0.6065 | 0.2744 | |||
| BJ / BJ's Wholesale Club Holdings, Inc. | 0.00 | 1.33 | 0.44 | -4.31 | 0.6043 | -0.0641 | |||
| LECO / Lincoln Electric Holdings, Inc. | 0.00 | 1.67 | 0.44 | 11.39 | 0.5997 | 0.0297 | |||
| BR / Broadridge Financial Solutions, Inc. | 0.00 | -12.67 | 0.44 | -12.52 | 0.5992 | -0.1259 | |||
| HALO / Halozyme Therapeutics, Inc. | 0.01 | -1.05 | 0.43 | -19.28 | 0.5810 | -0.1819 | |||
| PEN / Penumbra, Inc. | 0.00 | 1.29 | 0.42 | -2.99 | 0.5751 | -0.0516 | |||
| PAYC / Paycom Software, Inc. | 0.00 | -6.55 | 0.42 | -0.94 | 0.5746 | -0.0403 | |||
| RLI / RLI Corp. | 0.01 | 0.41 | 0.5531 | 0.5531 | |||||
| CFR / Cullen/Frost Bankers, Inc. | 0.00 | 5.56 | 0.40 | 8.17 | 0.5410 | 0.0122 | |||
| CROX / Crocs, Inc. | 0.00 | 2.03 | 0.39 | -2.73 | 0.5337 | -0.0473 | |||
| TKO / TKO Group Holdings, Inc. | 0.00 | 0.39 | 0.5322 | 0.5322 | |||||
| ELS / Equity LifeStyle Properties, Inc. | 0.01 | 0.99 | 0.39 | -6.73 | 0.5282 | -0.0710 | |||
| LNTH / Lantheus Holdings, Inc. | 0.00 | 1.94 | 0.38 | -14.45 | 0.5156 | -0.1232 | |||
| RL / Ralph Lauren Corporation | 0.00 | -15.58 | 0.38 | 5.03 | 0.5114 | -0.0050 | |||
| PNFP / Pinnacle Financial Partners, Inc. | 0.00 | 0.37 | 0.5088 | 0.5088 | |||||
| GLPI / Gaming and Leisure Properties, Inc. | 0.01 | 3.85 | 0.37 | -4.85 | 0.5085 | -0.0570 | |||
| LPX / Louisiana-Pacific Corporation | 0.00 | 4.75 | 0.37 | -2.13 | 0.4999 | -0.0408 | |||
| ATR / AptarGroup, Inc. | 0.00 | 2.31 | 0.37 | 7.94 | 0.4993 | 0.0090 | |||
| AAON / AAON, Inc. | 0.00 | 10.85 | 0.36 | 4.68 | 0.4877 | -0.0060 | |||
| APPF / AppFolio, Inc. | 0.00 | 2.93 | 0.36 | 7.88 | 0.4848 | 0.0084 | |||
| SEIC / SEI Investments Company | 0.00 | 0.35 | 0.4697 | 0.4697 | |||||
| LOPE / Grand Canyon Education, Inc. | 0.00 | -4.17 | 0.34 | 4.64 | 0.4603 | -0.0055 | |||
| NYT / The New York Times Company | 0.01 | 2.52 | 0.33 | 15.79 | 0.4495 | 0.0380 | |||
| DCI / Donaldson Company, Inc. | 0.00 | 3.68 | 0.32 | 7.02 | 0.4360 | 0.0053 | |||
| SSD / Simpson Manufacturing Co., Inc. | 0.00 | 5.57 | 0.30 | 4.58 | 0.4042 | -0.0060 | |||
| AMH / American Homes 4 Rent | 0.01 | 1.97 | 0.29 | -3.02 | 0.3943 | -0.0351 | |||
| ANF / Abercrombie & Fitch Co. | 0.00 | 0.45 | 0.28 | 9.06 | 0.3772 | 0.0106 | |||
| AXTA / Axalta Coating Systems Ltd. | 0.01 | 6.83 | 0.24 | -4.33 | 0.3314 | -0.0357 | |||
| WEX / WEX Inc. | 0.00 | -11.39 | 0.24 | -17.19 | 0.3218 | -0.0894 | |||
| TNL / Travel + Leisure Co. | 0.00 | 1.68 | 0.23 | 13.11 | 0.3182 | 0.0209 | |||
| DBX / Dropbox, Inc. | 0.01 | -9.12 | 0.23 | -2.54 | 0.3132 | -0.0277 | |||
| ALLE / Allegion plc | 0.00 | -14.32 | 0.23 | -5.35 | 0.3132 | -0.0373 | |||
| WTS / Watts Water Technologies, Inc. | 0.00 | 2.97 | 0.23 | 23.78 | 0.3126 | 0.0459 | |||
| CRUS / Cirrus Logic, Inc. | 0.00 | 1.75 | 0.22 | 6.67 | 0.3048 | 0.0015 | |||
| MTDR / Matador Resources Company | 0.00 | -4.90 | 0.22 | -11.34 | 0.2986 | -0.0575 | |||
| OLED / Universal Display Corporation | 0.00 | 6.13 | 0.22 | 17.39 | 0.2945 | 0.0291 | |||
| DVA / DaVita Inc. | 0.00 | -19.87 | 0.21 | -25.54 | 0.2828 | -0.1186 | |||
| SRPT / Sarepta Therapeutics, Inc. | 0.01 | 95.48 | 0.21 | -47.86 | 0.2828 | -0.2891 | |||
| QLYS / Qualys, Inc. | 0.00 | 3.40 | 0.20 | 17.24 | 0.2780 | 0.0270 | |||
| MTG / MGIC Investment Corporation | 0.01 | -8.09 | 0.20 | 3.57 | 0.2765 | -0.0071 | |||
| NOVT / Novanta Inc. | 0.00 | 7.08 | 0.20 | 7.69 | 0.2677 | 0.0051 | |||
| BYD / Boyd Gaming Corporation | 0.00 | -8.26 | 0.19 | 9.25 | 0.2574 | 0.0073 | |||
| GNTX / Gentex Corporation | 0.01 | 3.71 | 0.14 | -2.13 | 0.1889 | -0.0155 | |||
| WFRD / Weatherford International plc | 0.00 | 2.11 | 0.12 | -4.13 | 0.1588 | -0.0165 |