Mga Batayang Estadistika
| Profil Orang Dalam | NEW VERNON INVESTMENT MANAGEMENT LLC |
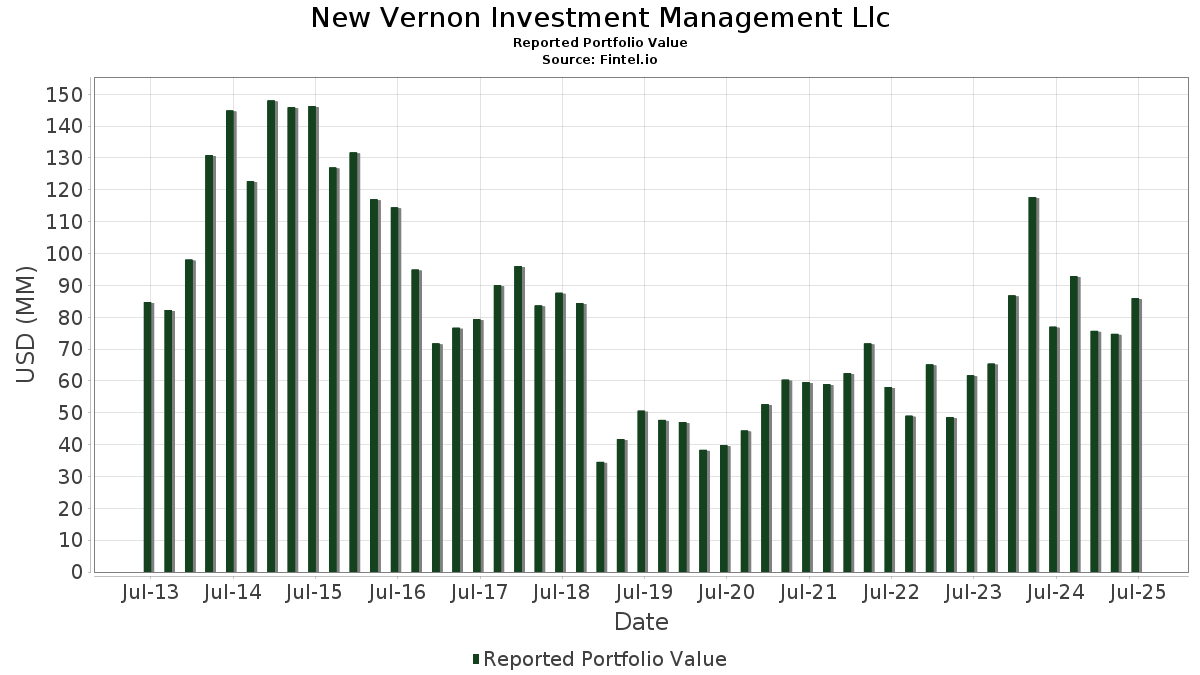
| Nilai Portofolio | $ 85,956,701 |
| Posisi Saat Ini | 35 |
Kepemilikan Terbaru, Kinerja, AUM (dari 13F, 13D)
New Vernon Investment Management Llc telah mengungkapkan total kepemilikan 35 dalam pengajuan SEC terbaru mereka. Nilai portofolio terbaru dihitung sebesar $ 85,956,701 USD. Aset yang Dikelola (AUM) sebenarnya adalah nilai ini ditambah kas (yang tidak diungkapkan). Aset-aset utama New Vernon Investment Management Llc adalah The Progressive Corporation (US:PGR) , W. R. Berkley Corporation (US:WRB) , The Hartford Insurance Group, Inc. (US:HIG) , Equitable Holdings, Inc. (US:EQH) , and The Travelers Companies, Inc. (US:TRV) . Posisi baru New Vernon Investment Management Llc meliputi: NVIDIA Corporation (PE:NVDA) , DoubleDown Interactive Co., Ltd. - Depositary Receipt (Common Stock) (US:DDI) , .
Peningkatan Tertinggi Kuartal Ini
Kami menggunakan perubahan dalam alokasi portofolio karena ini adalah metrik yang paling bermakna. Perubahan dapat disebabkan oleh perdagangan atau perubahan harga saham.
| Keamanan | Saham (MM) |
Nilai (Juta Dolar AS) |
Portfolio % | ΔPorsyento ng Portfolio |
|---|---|---|---|---|
| 0.15 | 5.33 | 6.2034 | 6.2034 | |
| 0.09 | 6.77 | 7.8811 | 3.4927 | |
| 0.02 | 5.36 | 6.2384 | 2.0870 | |
| 0.03 | 7.48 | 8.7034 | 2.0719 | |
| 0.11 | 3.81 | 4.4268 | 1.5612 | |
| 0.01 | 3.03 | 3.5275 | 1.0639 | |
| 0.00 | 0.71 | 0.8242 | 0.8242 | |
| 0.05 | 0.50 | 0.5789 | 0.5789 | |
| 0.00 | 2.01 | 2.3390 | 0.3093 | |
| 0.10 | 5.63 | 6.5493 | 0.2922 |
Penurunan Tertinggi Kuartal Ini
Kami menggunakan perubahan dalam alokasi portofolio karena ini adalah metrik yang paling bermakna. Perubahan dapat disebabkan oleh perdagangan atau perubahan harga saham.
| Keamanan | Saham (MM) |
Nilai (Juta Dolar AS) |
Portfolio % | ΔPorsyento ng Portfolio |
|---|---|---|---|---|
| 0.01 | 3.89 | 4.5216 | -6.6923 | |
| 0.02 | 3.77 | 4.3803 | -1.2411 | |
| 0.04 | 3.36 | 3.9108 | -0.8392 | |
| 0.04 | 5.66 | 6.5892 | -0.7997 | |
| 0.02 | 2.14 | 2.4894 | -0.6685 | |
| 0.01 | 2.23 | 2.5968 | -0.5953 | |
| 0.03 | 2.80 | 3.2602 | -0.5476 | |
| 0.06 | 1.42 | 1.6562 | -0.4297 | |
| 0.02 | 1.62 | 1.8874 | -0.4122 | |
| 0.07 | 1.60 | 1.8585 | -0.1905 |
Pengajuan 13F dan Dana
Formulir ini diajukan pada 2025-08-14 untuk periode pelaporan 2025-06-30. Klik ikon tautan untuk melihat riwayat transaksi selengkapnya.
Tingkatkan ke versi premium untuk membuka data premium dan ekspor ke Excel. ![]() .
.
| Keamanan | Ketik | Harga Saham Rata-rata | Saham (MM) |
ΔSaham (%) |
ΔSaham (%) |
Nilai ($MM) |
Portpolyo (%) |
ΔPortofolio (%) |
|
|---|---|---|---|---|---|---|---|---|---|
| PGR / The Progressive Corporation | 0.03 | 60.04 | 7.48 | 50.92 | 8.7034 | 2.0719 | |||
| WRB / W. R. Berkley Corporation | 0.09 | 100.00 | 6.77 | 106.52 | 7.8811 | 3.4927 | |||
| HIG / The Hartford Insurance Group, Inc. | 0.04 | 0.00 | 5.66 | 2.53 | 6.5892 | -0.7997 | |||
| EQH / Equitable Holdings, Inc. | 0.10 | 11.75 | 5.63 | 20.35 | 6.5493 | 0.2922 | |||
| TRV / The Travelers Companies, Inc. | 0.02 | 70.80 | 5.36 | 72.80 | 6.2384 | 2.0870 | |||
| LNC / Lincoln National Corporation | 0.15 | 5.33 | 6.2034 | 6.2034 | |||||
| AJG / Arthur J. Gallagher & Co. | 0.01 | -50.00 | 3.89 | -53.64 | 4.5216 | -6.6923 | |||
| CRBG / Corebridge Financial, Inc. | 0.11 | 57.96 | 3.81 | 77.64 | 4.4268 | 1.5612 | |||
| MMC / Marsh & McLennan Companies, Inc. | 0.02 | 0.00 | 3.77 | -10.40 | 4.3803 | -1.2411 | |||
| ACGL / Arch Capital Group Ltd. | 0.04 | 0.00 | 3.36 | -5.32 | 3.9108 | -0.8392 | |||
| PLMR / Palomar Holdings, Inc. | 0.02 | 0.00 | 3.06 | 12.54 | 3.5612 | -0.0777 | |||
| AVGO / Broadcom Inc. | 0.01 | 0.00 | 3.03 | 64.69 | 3.5275 | 1.0639 | |||
| AIG / American International Group, Inc. | 0.03 | 0.00 | 2.80 | -1.55 | 3.2602 | -0.5476 | |||
| EG / Everest Group, Ltd. | 0.01 | 0.00 | 2.23 | -6.45 | 2.5968 | -0.5953 | |||
| XOM / Exxon Mobil Corporation | 0.02 | 0.00 | 2.14 | -9.36 | 2.4894 | -0.6685 | |||
| MSFT / Microsoft Corporation | 0.00 | 0.00 | 2.01 | 32.50 | 2.3390 | 0.3093 | |||
| BX / Blackstone Inc. | 0.01 | 0.00 | 1.97 | 6.99 | 2.2972 | -0.1711 | |||
| ORLY / O'Reilly Automotive, Inc. | 0.02 | 1,400.00 | 1.62 | -5.64 | 1.8874 | -0.4122 | |||
| HG / Hamilton Insurance Group, Ltd. | 0.07 | 0.00 | 1.60 | 4.31 | 1.8585 | -0.1905 | |||
| UBER / Uber Technologies, Inc. | 0.02 | 0.00 | 1.59 | 28.11 | 1.8452 | 0.1884 | |||
| IGIC / International General Insurance Holdings Ltd. | 0.06 | 0.00 | 1.42 | -8.72 | 1.6562 | -0.4297 | |||
| GOOG / Alphabet Inc. | 0.01 | 0.00 | 1.28 | 13.61 | 1.4859 | -0.0188 | |||
| JPM / JPMorgan Chase & Co. | 0.00 | 0.00 | 1.23 | 18.12 | 1.4344 | 0.0389 | |||
| MS / Morgan Stanley | 0.01 | 0.00 | 1.20 | 20.76 | 1.4011 | 0.0668 | |||
| AMZN / Amazon.com, Inc. | 0.00 | 0.00 | 1.06 | 15.43 | 1.2274 | 0.0035 | |||
| HD / The Home Depot, Inc. | 0.00 | 0.00 | 0.92 | 0.00 | 1.0664 | -0.1593 | |||
| SYK / Stryker Corporation | 0.00 | 0.00 | 0.85 | 6.22 | 0.9942 | -0.0814 | |||
| ABT / Abbott Laboratories | 0.01 | 0.00 | 0.80 | 2.42 | 0.9364 | -0.1137 | |||
| NVDA / NVIDIA Corporation | 0.00 | 0.71 | 0.8242 | 0.8242 | |||||
| UNP / Union Pacific Corporation | 0.00 | 0.00 | 0.69 | -2.70 | 0.7990 | -0.1443 | |||
| NU / Nu Holdings Ltd. | 0.05 | 0.00 | 0.68 | 33.86 | 0.7873 | 0.1117 | |||
| MDT / Medtronic plc | 0.01 | 0.00 | 0.64 | -3.04 | 0.7416 | -0.1374 | |||
| EPD / Enterprise Products Partners L.P. - Limited Partnership | 0.02 | 0.00 | 0.50 | -9.19 | 0.5870 | -0.1561 | |||
| DDI / DoubleDown Interactive Co., Ltd. - Depositary Receipt (Common Stock) | 0.05 | 0.50 | 0.5789 | 0.5789 | |||||
| FIHL / Fidelis Insurance Holdings Limited | 0.02 | 0.00 | 0.36 | 2.31 | 0.4132 | -0.0510 | |||
| MET / MetLife, Inc. | 0.00 | -100.00 | 0.00 | 0.0000 | |||||
| FDX / FedEx Corporation | 0.00 | -100.00 | 0.00 | 0.0000 | |||||
| TECK / Teck Resources Limited | 0.00 | -100.00 | 0.00 | 0.0000 | |||||
| QCOM / QUALCOMM Incorporated | 0.00 | -100.00 | 0.00 | 0.0000 |