Mga Batayang Estadistika
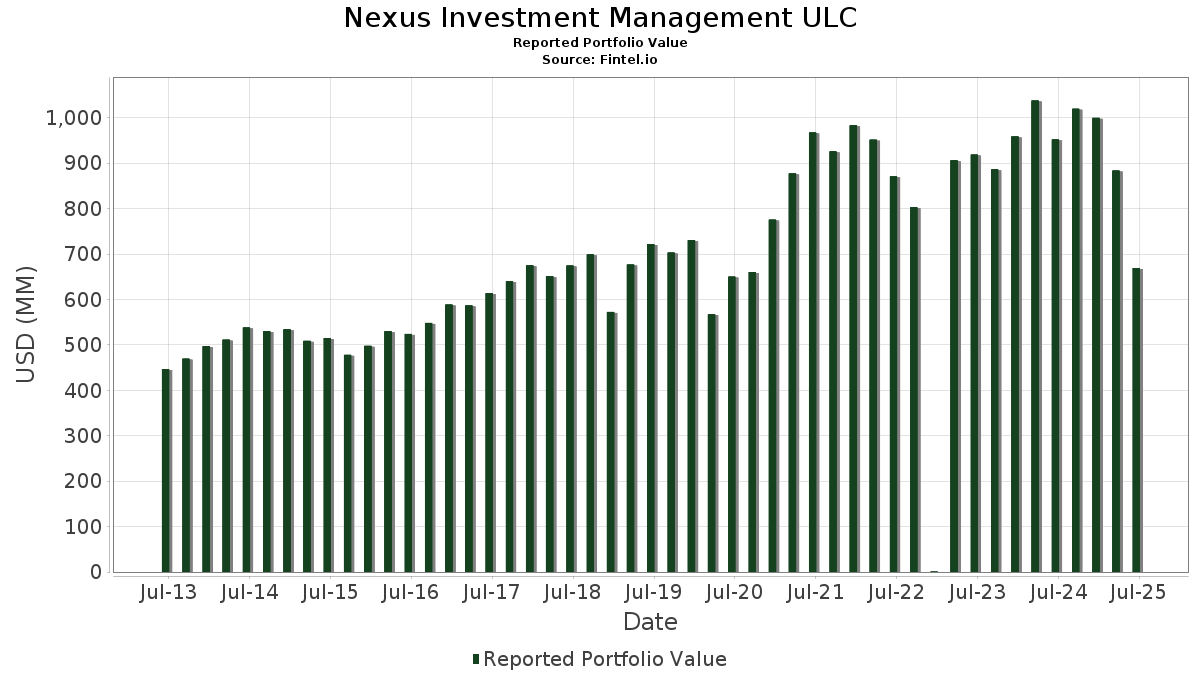
| Nilai Portofolio | $ 669,166,462 |
| Posisi Saat Ini | 80 |
Kepemilikan Terbaru, Kinerja, AUM (dari 13F, 13D)
Nexus Investment Management ULC telah mengungkapkan total kepemilikan 80 dalam pengajuan SEC terbaru mereka. Nilai portofolio terbaru dihitung sebesar $ 669,166,462 USD. Aset yang Dikelola (AUM) sebenarnya adalah nilai ini ditambah kas (yang tidak diungkapkan). Aset-aset utama Nexus Investment Management ULC adalah Meta Platforms, Inc. (US:META) , JPMorgan Chase & Co. (US:JPM) , Cisco Systems, Inc. (US:CSCO) , Citigroup Inc. (US:C) , and American Electric Power Company, Inc. (US:AEP) . Posisi baru Nexus Investment Management ULC meliputi: Thermo Fisher Scientific Inc. (US:TMO) , Capital One Financial Corporation (IT:1COF) , Amazon.com, Inc. (US:AMZN) , McDonald's Corporation (US:MCD) , and The Home Depot, Inc. (US:HD) .
Peningkatan Tertinggi Kuartal Ini
Kami menggunakan perubahan dalam alokasi portofolio karena ini adalah metrik yang paling bermakna. Perubahan dapat disebabkan oleh perdagangan atau perubahan harga saham.
| Keamanan | Saham (MM) |
Nilai (Juta Dolar AS) |
Portfolio % | ΔPorsyento ng Portfolio |
|---|---|---|---|---|
| 0.06 | 24.34 | 3.6371 | 3.6371 | |
| 0.08 | 58.78 | 8.7847 | 1.2398 | |
| 0.08 | 38.36 | 5.7325 | 1.0267 | |
| 0.29 | 32.67 | 4.8825 | 0.7658 | |
| 0.10 | 21.35 | 3.1911 | 0.7267 | |
| 0.20 | 57.23 | 8.5530 | 0.6215 | |
| 0.50 | 42.39 | 6.3344 | 0.5376 | |
| 0.21 | 37.97 | 5.6740 | 0.3169 | |
| 0.14 | 19.96 | 2.9828 | 0.2915 | |
| 0.11 | 21.81 | 3.2591 | 0.2864 |
Penurunan Tertinggi Kuartal Ini
Kami menggunakan perubahan dalam alokasi portofolio karena ini adalah metrik yang paling bermakna. Perubahan dapat disebabkan oleh perdagangan atau perubahan harga saham.
| Keamanan | Saham (MM) |
Nilai (Juta Dolar AS) |
Portfolio % | ΔPorsyento ng Portfolio |
|---|---|---|---|---|
| 0.39 | 40.92 | 6.1156 | -0.9373 | |
| 0.38 | 25.38 | 3.7930 | -0.6650 | |
| 0.21 | 24.84 | 3.7118 | -0.6046 | |
| 0.22 | 21.94 | 3.2783 | -0.5245 | |
| 0.24 | 26.37 | 3.9400 | -0.4689 | |
| 0.25 | 31.76 | 4.7458 | -0.4440 | |
| 0.88 | 21.21 | 3.1698 | -0.4060 | |
| 0.23 | 20.29 | 3.0325 | -0.2858 | |
| 0.06 | 20.73 | 3.0973 | -0.2251 | |
| 0.05 | 3.41 | 0.5099 | -0.0473 |
Pengajuan 13F dan Dana
Formulir ini diajukan pada 2025-07-28 untuk periode pelaporan 2025-06-30. Klik ikon tautan untuk melihat riwayat transaksi selengkapnya.
Tingkatkan ke versi premium untuk membuka data premium dan ekspor ke Excel. ![]() .
.
| Keamanan | Ketik | Harga Saham Rata-rata | Saham (MM) |
ΔSaham (%) |
ΔSaham (%) |
Nilai ($MM) |
Portpolyo (%) |
ΔPortofolio (%) |
|
|---|---|---|---|---|---|---|---|---|---|
| META / Meta Platforms, Inc. | 0.08 | -0.96 | 58.78 | -11.82 | 8.7847 | 1.2398 | |||
| JPM / JPMorgan Chase & Co. | 0.20 | -0.61 | 57.23 | -18.34 | 8.5530 | 0.6215 | |||
| CSCO / Cisco Systems, Inc. | 0.65 | -1.33 | 45.07 | -22.88 | 6.7347 | 0.1214 | |||
| C / Citigroup Inc. | 0.50 | -0.72 | 42.39 | -17.25 | 6.3344 | 0.5376 | |||
| AEP / American Electric Power Company, Inc. | 0.39 | -0.53 | 40.92 | -34.33 | 6.1156 | -0.9373 | |||
| MSFT / Microsoft Corporation | 0.08 | 0.15 | 38.36 | -7.74 | 5.7325 | 1.0267 | |||
| GOOG / Alphabet Inc. | 0.21 | 1.62 | 37.97 | -19.79 | 5.6740 | 0.3169 | |||
| DG / Dollar General Corporation | 0.29 | -0.68 | 32.67 | -10.18 | 4.8825 | 0.7658 | |||
| ROST / Ross Stores, Inc. | 0.25 | -0.22 | 31.76 | -30.75 | 4.7458 | -0.4440 | |||
| GILD / Gilead Sciences, Inc. | 0.24 | -1.62 | 26.37 | -32.32 | 3.9400 | -0.4689 | |||
| KMX / CarMax, Inc. | 0.38 | 7.45 | 25.38 | -35.56 | 3.7930 | -0.6650 | |||
| EOG / EOG Resources, Inc. | 0.21 | 0.44 | 24.84 | -34.88 | 3.7118 | -0.6046 | |||
| TMO / Thermo Fisher Scientific Inc. | 0.06 | 24.34 | 3.6371 | 3.6371 | |||||
| UPS / United Parcel Service, Inc. | 0.22 | 2.33 | 21.94 | -34.71 | 3.2783 | -0.5245 | |||
| TXN / Texas Instruments Incorporated | 0.11 | 3.37 | 21.81 | -16.97 | 3.2591 | 0.2864 | |||
| FERG / Ferguson Enterprises Inc. | 0.10 | 3.79 | 21.35 | -1.94 | 3.1911 | 0.7267 | |||
| PFE / Pfizer Inc. | 0.88 | 0.95 | 21.21 | -32.87 | 3.1698 | -0.4060 | |||
| V / Visa Inc. | 0.06 | 0.24 | 20.73 | -29.40 | 3.0973 | -0.2251 | |||
| MDT / Medtronic plc | 0.23 | 2.62 | 20.29 | -30.79 | 3.0325 | -0.2858 | |||
| MS / Morgan Stanley | 0.14 | 0.00 | 19.96 | -16.06 | 2.9828 | 0.2915 | |||
| HON / Honeywell International Inc. | 0.03 | 0.38 | 7.09 | -23.25 | 1.0590 | 0.0140 | |||
| GLW / Corning Incorporated | 0.09 | 0.00 | 4.94 | -20.15 | 0.7387 | 0.0382 | |||
| KR / The Kroger Co. | 0.05 | -5.93 | 3.41 | -30.71 | 0.5099 | -0.0473 | |||
| EFA / iShares Trust - iShares MSCI EAFE ETF | 0.03 | -3.17 | 2.73 | -26.40 | 0.4081 | -0.0117 | |||
| UNP / Union Pacific Corporation | 0.01 | 0.00 | 2.60 | -32.28 | 0.3887 | -0.0461 | |||
| DHR / Danaher Corporation | 0.01 | 0.00 | 1.53 | -33.03 | 0.2289 | -0.0299 | |||
| JNJ / Johnson & Johnson | 0.01 | 0.00 | 1.43 | -35.96 | 0.2130 | -0.0389 | |||
| GOOGL / Alphabet Inc. | 0.01 | 0.00 | 1.25 | -20.81 | 0.1872 | 0.0083 | |||
| CVX / Chevron Corporation | 0.01 | 0.00 | 1.08 | -40.54 | 0.1621 | -0.0442 | |||
| VZ / Verizon Communications Inc. | 0.02 | 0.00 | 0.68 | -33.69 | 0.1009 | -0.0143 | |||
| 1COF / Capital One Financial Corporation | 0.00 | 0.66 | 0.0986 | 0.0986 | |||||
| ABBV / AbbVie Inc. | 0.00 | 0.00 | 0.64 | -38.42 | 0.0959 | -0.0220 | |||
| LLY / Eli Lilly and Company | 0.00 | 0.00 | 0.63 | -34.44 | 0.0942 | -0.0145 | |||
| XOM / Exxon Mobil Corporation | 0.01 | 0.00 | 0.61 | -37.03 | 0.0919 | -0.0185 | |||
| T / AT&T Inc. | 0.02 | 0.00 | 0.56 | -28.94 | 0.0831 | -0.0054 | |||
| OTEX / Open Text Corporation | 0.02 | 0.00 | 0.52 | -19.69 | 0.0781 | 0.0045 | |||
| CSX / CSX Corporation | 0.02 | 0.00 | 0.52 | -22.99 | 0.0772 | 0.0014 | |||
| EXC / Exelon Corporation | 0.01 | 0.00 | 0.50 | -34.52 | 0.0741 | -0.0116 | |||
| TROW / T. Rowe Price Group, Inc. | 0.00 | 0.00 | 0.36 | -27.13 | 0.0539 | -0.0020 | |||
| FSV / FirstService Corporation | 0.00 | 0.00 | 0.35 | -26.83 | 0.0522 | -0.0018 | |||
| ABT / Abbott Laboratories | 0.00 | 0.00 | 0.34 | -28.84 | 0.0506 | -0.0032 | |||
| KMB / Kimberly-Clark Corporation | 0.00 | 0.00 | 0.33 | -36.93 | 0.0498 | -0.0100 | |||
| MRK / Merck & Co., Inc. | 0.00 | 0.00 | 0.30 | -38.80 | 0.0442 | -0.0104 | |||
| PG / The Procter & Gamble Company | 0.00 | 0.00 | 0.29 | -35.15 | 0.0429 | -0.0071 | |||
| BAC / Bank of America Corporation | 0.01 | 0.00 | 0.25 | -21.18 | 0.0378 | 0.0015 | |||
| EIX / Edison International | 0.00 | 0.00 | 0.19 | -39.37 | 0.0287 | -0.0070 | |||
| COST / Costco Wholesale Corporation | 0.00 | 75.00 | 0.17 | 27.21 | 0.0259 | 0.0105 | |||
| VEA / Vanguard Tax-Managed Funds - Vanguard FTSE Developed Markets ETF | 0.00 | 0.00 | 0.17 | -22.17 | 0.0258 | 0.0007 | |||
| VWO / Vanguard International Equity Index Funds - Vanguard FTSE Emerging Markets ETF | 0.00 | 0.00 | 0.12 | -23.90 | 0.0182 | 0.0001 | |||
| WMT / Walmart Inc. | 0.00 | 113.51 | 0.12 | 64.29 | 0.0173 | 0.0094 | |||
| BIIB / Biogen Inc. | 0.00 | 0.00 | 0.12 | -36.46 | 0.0173 | -0.0032 | |||
| MA / Mastercard Incorporated | 0.00 | 0.00 | 0.11 | -28.76 | 0.0164 | -0.0010 | |||
| PRAA / PRA Group, Inc. | 0.01 | 0.00 | 0.10 | -50.26 | 0.0142 | -0.0074 | |||
| CL / Colgate-Palmolive Company | 0.00 | 0.00 | 0.09 | -33.08 | 0.0131 | -0.0016 | |||
| AMZN / Amazon.com, Inc. | 0.00 | 0.09 | 0.0131 | 0.0131 | |||||
| ORCL / Oracle Corporation | 0.00 | 0.00 | 0.09 | 8.75 | 0.0131 | 0.0040 | |||
| BHC / Bausch Health Companies Inc. | 0.01 | 0.00 | 0.09 | -28.33 | 0.0129 | -0.0008 | |||
| BRK.B / Berkshire Hathaway Inc. | 0.00 | 172.13 | 0.08 | 73.91 | 0.0121 | 0.0068 | |||
| VLTO / Veralto Corporation | 0.00 | 0.00 | 0.07 | -27.96 | 0.0101 | -0.0005 | |||
| HQH / Abrdn Healthcare Investors | 0.00 | 0.00 | 0.06 | -33.70 | 0.0091 | -0.0013 | |||
| AAPL / Apple Inc. | 0.00 | 333.33 | 0.05 | 178.95 | 0.0080 | 0.0058 | |||
| BMY / Bristol-Myers Squibb Company | 0.00 | 0.00 | 0.04 | -46.99 | 0.0066 | -0.0029 | |||
| MCD / McDonald's Corporation | 0.00 | 0.04 | 0.0061 | 0.0061 | |||||
| HD / The Home Depot, Inc. | 0.00 | 0.04 | 0.0060 | 0.0060 | |||||
| AXP / American Express Company | 0.00 | 0.00 | 0.04 | -18.75 | 0.0060 | 0.0005 | |||
| NEM / Newmont Corporation | 0.00 | 0.00 | 0.04 | -17.78 | 0.0057 | 0.0006 | |||
| FNV / Franco-Nevada Corporation | 0.00 | 0.00 | 0.04 | -28.00 | 0.0055 | -0.0003 | |||
| SBUX / Starbucks Corporation | 0.00 | 0.03 | 0.0052 | 0.0052 | |||||
| B / Barrick Mining Corporation | 0.00 | 0.03 | 0.0047 | 0.0047 | |||||
| ADBE / Adobe Inc. | 0.00 | 0.03 | 0.0046 | 0.0046 | |||||
| NVS / Novartis AG - Depositary Receipt (Common Stock) | 0.00 | 0.00 | 0.03 | -25.71 | 0.0040 | -0.0000 | |||
| BDX / Becton, Dickinson and Company | 0.00 | 0.00 | 0.03 | -48.98 | 0.0039 | -0.0017 | |||
| GDXJ / VanEck ETF Trust - VanEck Junior Gold Miners ETF | 0.00 | 0.00 | 0.02 | -16.67 | 0.0030 | 0.0002 | |||
| ACN / Accenture plc | 0.00 | 0.00 | 0.02 | -34.48 | 0.0029 | -0.0004 | |||
| HQL / Abrdn Life Sciences Investors | 0.00 | 0.00 | 0.02 | -29.63 | 0.0029 | -0.0002 | |||
| PEP / PepsiCo, Inc. | 0.00 | 0.00 | 0.02 | -38.46 | 0.0025 | -0.0006 | |||
| SLV / iShares Silver Trust | 0.00 | 0.00 | 0.02 | -27.27 | 0.0025 | -0.0001 | |||
| RTX / RTX Corporation | 0.00 | 0.00 | 0.01 | -25.00 | 0.0010 | 0.0000 | |||
| VTRS / Viatris Inc. | 0.00 | 0.00 | 0.00 | -40.00 | 0.0005 | -0.0000 | |||
| CB144A Appvion Esc Npv / (038ESC026) | 0.00 | 0.00 | 0.0000 | ||||||
| GOLD / Barrick Mining Corporation | 0.00 | -100.00 | 0.00 | 0.0000 | |||||
| CVS / CVS Health Corporation | 0.00 | -100.00 | 0.00 | 0.0000 | |||||
| DFS / Discover Financial Services | 0.00 | -100.00 | 0.00 | 0.0000 |