Mga Batayang Estadistika
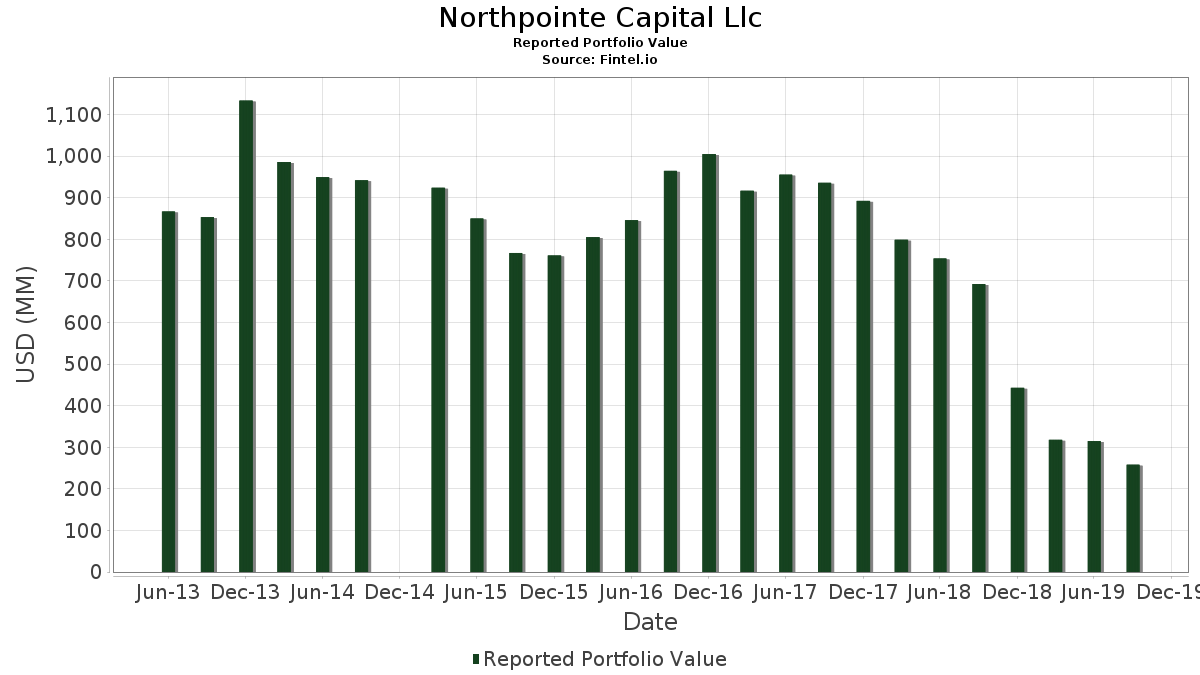
| Nilai Portofolio | $ 258,083,000 |
| Posisi Saat Ini | 76 |
Kepemilikan Terbaru, Kinerja, AUM (dari 13F, 13D)
Northpointe Capital Llc telah mengungkapkan total kepemilikan 76 dalam pengajuan SEC terbaru mereka. Nilai portofolio terbaru dihitung sebesar $ 258,083,000 USD. Aset yang Dikelola (AUM) sebenarnya adalah nilai ini ditambah kas (yang tidak diungkapkan). Aset-aset utama Northpointe Capital Llc adalah Berkshire Hathaway Inc. (US:BRK.B) , Bank of America Corporation (US:BAC) , JPMorgan Chase & Co. (US:JPM) , The Procter & Gamble Company (US:PG) , and Citigroup Inc. (US:C) . Posisi baru Northpointe Capital Llc meliputi: Newmont Corporation (US:NEM) , Realty Income Corporation (US:O) , Brown & Brown, Inc. (US:BRO) , Hyatt Hotels Corporation (US:H) , and Ally Financial Inc. (US:ALLY) .
Peningkatan Tertinggi Kuartal Ini
Kami menggunakan perubahan dalam alokasi portofolio karena ini adalah metrik yang paling bermakna. Perubahan dapat disebabkan oleh perdagangan atau perubahan harga saham.
| Keamanan | Saham (MM) |
Nilai (Juta Dolar AS) |
Portfolio % | ΔPorsyento ng Portfolio |
|---|---|---|---|---|
| 0.07 | 4.20 | 1.6270 | 1.6270 | |
| 0.04 | 4.12 | 1.5983 | 1.5983 | |
| 0.20 | 4.10 | 1.5894 | 1.5894 | |
| 0.03 | 3.87 | 1.4999 | 1.4999 | |
| 0.01 | 3.75 | 1.4519 | 1.4519 | |
| 0.03 | 3.71 | 1.4364 | 1.3631 | |
| 0.07 | 3.77 | 1.4623 | 1.2410 | |
| 0.03 | 3.19 | 1.2360 | 1.2360 | |
| 0.10 | 3.10 | 1.2000 | 1.2000 | |
| 0.08 | 2.90 | 1.1233 | 1.1233 |
Penurunan Tertinggi Kuartal Ini
Kami menggunakan perubahan dalam alokasi portofolio karena ini adalah metrik yang paling bermakna. Perubahan dapat disebabkan oleh perdagangan atau perubahan harga saham.
| Keamanan | Saham (MM) |
Nilai (Juta Dolar AS) |
Portfolio % | ΔPorsyento ng Portfolio |
|---|---|---|---|---|
| 0.00 | 0.00 | -1.8023 | ||
| 0.00 | 0.00 | -1.5946 | ||
| 0.00 | 0.00 | -1.4705 | ||
| 0.00 | 0.00 | -1.3889 | ||
| 0.00 | 0.00 | -1.2812 | ||
| 0.00 | 0.00 | -1.2749 | ||
| 0.00 | 0.00 | -1.2654 | ||
| 0.00 | 0.00 | -1.1491 | ||
| 0.00 | 0.00 | -1.1269 | ||
| 0.00 | 0.00 | -1.1161 |
Pengajuan 13F dan Dana
Formulir ini diajukan pada 2019-10-16 untuk periode pelaporan 2019-09-30. Klik ikon tautan untuk melihat riwayat transaksi selengkapnya.
Tingkatkan ke versi premium untuk membuka data premium dan ekspor ke Excel. ![]() .
.
| Keamanan | Ketik | Harga Saham Rata-rata | Saham (MM) |
ΔSaham (%) |
ΔSaham (%) |
Nilai ($MM) |
Portpolyo (%) |
ΔPortofolio (%) |
|
|---|---|---|---|---|---|---|---|---|---|
| BRK.B / Berkshire Hathaway Inc. | 0.04 | -20.02 | 8.48 | -21.96 | 3.2858 | -0.1645 | |||
| BAC / Bank of America Corporation | 0.28 | -5.62 | 8.31 | -5.07 | 3.2191 | 0.4401 | |||
| JPM / JPMorgan Chase & Co. | 0.07 | -24.52 | 8.15 | -20.54 | 3.1591 | -0.0991 | |||
| PG / The Procter & Gamble Company | 0.06 | -21.26 | 7.44 | -10.68 | 2.8812 | 0.2378 | |||
| C / Citigroup Inc. | 0.10 | 0.93 | 7.05 | -0.44 | 2.7313 | 0.4832 | |||
| VZ / Verizon Communications Inc. | 0.11 | -21.37 | 6.68 | -16.93 | 2.5875 | 0.0349 | |||
| CVX / Chevron Corporation | 0.05 | -21.29 | 6.39 | -24.99 | 2.4756 | -0.2289 | |||
| XOM / Exxon Mobil Corporation | 0.07 | -31.41 | 5.29 | -36.80 | 2.0486 | -0.6076 | |||
| JNJ / Johnson & Johnson | 0.04 | -5.97 | 5.10 | -12.65 | 1.9746 | 0.1221 | |||
| T / AT&T Inc. | 0.13 | 19.76 | 5.02 | 35.25 | 1.9463 | 0.7670 | |||
| ABT / Abbott Laboratories | 0.05 | -21.58 | 4.50 | -21.97 | 1.7432 | -0.0876 | |||
| INTC / Intel Corporation | 0.09 | 80.91 | 4.40 | 94.73 | 1.7037 | 0.9867 | |||
| SO / The Southern Company | 0.07 | 4.20 | 1.6270 | 1.6270 | |||||
| ALL / The Allstate Corporation | 0.04 | 4.12 | 1.5983 | 1.5983 | |||||
| BRX / Brixmor Property Group Inc. | 0.20 | 4.10 | 1.5894 | 1.5894 | |||||
| MDLZ / Mondelez International, Inc. | 0.07 | 14.11 | 4.05 | 17.10 | 1.5708 | 0.4715 | |||
| AIG / American International Group, Inc. | 0.07 | 58.36 | 4.02 | 65.55 | 1.5569 | 0.7862 | |||
| WMT / Walmart Inc. | 0.03 | 32.62 | 3.92 | 42.47 | 1.5170 | 0.6444 | |||
| PSX / Phillips 66 | 0.04 | -5.52 | 3.91 | 3.44 | 1.5158 | 0.3149 | |||
| CMCSA / Comcast Corporation | 0.09 | -27.84 | 3.91 | -23.06 | 1.5154 | -0.0986 | |||
| DHR / Danaher Corporation | 0.03 | 3.87 | 1.4999 | 1.4999 | |||||
| STOR / Store Capital Corp | 0.10 | -21.31 | 3.78 | -11.29 | 1.4650 | 0.1117 | |||
| BMY / Bristol-Myers Squibb Company | 0.07 | 384.34 | 3.77 | 441.46 | 1.4623 | 1.2410 | |||
| ESS / Essex Property Trust, Inc. | 0.01 | 3.75 | 1.4519 | 1.4519 | |||||
| LPLA / LPL Financial Holdings Inc. | 0.05 | -21.29 | 3.74 | -20.98 | 1.4491 | -0.0537 | |||
| DTE / DTE Energy Company | 0.03 | 194.70 | 3.71 | 483.78 | 1.4364 | 1.3631 | |||
| AGCO / AGCO Corporation | 0.05 | -21.25 | 3.65 | -23.15 | 1.4127 | -0.0936 | |||
| RS / Reliance, Inc. | 0.04 | -21.25 | 3.63 | -17.06 | 1.4069 | 0.0168 | |||
| BPOP / Popular, Inc. | 0.07 | -21.27 | 3.63 | -21.50 | 1.4050 | -0.0617 | |||
| MRK / Merck & Co., Inc. | 0.04 | -33.64 | 3.54 | -33.38 | 1.3705 | -0.3153 | |||
| XRX / Xerox Holdings Corporation | 0.11 | -3.42 | 3.36 | -18.41 | 1.3035 | -0.0057 | |||
| VLO / Valero Energy Corporation | 0.04 | -0.47 | 3.34 | -0.92 | 1.2957 | 0.2240 | |||
| LIN / Linde plc | 0.02 | -5.43 | 3.31 | -8.78 | 1.2845 | 0.1306 | |||
| RTN / Raytheon Co. | 0.02 | -5.42 | 3.30 | 6.69 | 1.2783 | 0.2965 | |||
| BAX / Baxter International Inc. | 0.04 | -21.34 | 3.24 | -15.99 | 1.2539 | 0.0307 | |||
| URI / United Rentals, Inc. | 0.03 | 3.19 | 1.2360 | 1.2360 | |||||
| CNP / CenterPoint Energy, Inc. | 0.10 | 3.10 | 1.2000 | 1.2000 | |||||
| PPC / Pilgrim's Pride Corporation | 0.10 | 19.64 | 3.08 | 50.98 | 1.1946 | 0.5462 | |||
| KDP / Keurig Dr Pepper Inc. | 0.11 | 29.57 | 2.91 | 22.47 | 1.1279 | 0.3732 | |||
| HON / Honeywell International Inc. | 0.02 | -22.09 | 2.91 | -24.51 | 1.1279 | -0.0965 | |||
| NEM / Newmont Corporation | 0.08 | 2.90 | 1.1233 | 1.1233 | |||||
| LOW / Lowe's Companies, Inc. | 0.03 | -5.49 | 2.88 | 3.01 | 1.1144 | 0.2278 | |||
| NEE / NextEra Energy, Inc. | 0.01 | 2.85 | 1.1051 | 1.1051 | |||||
| BHF / Brighthouse Financial, Inc. | 0.07 | -28.82 | 2.84 | -21.49 | 1.1016 | -0.0482 | |||
| CME / CME Group Inc. | 0.01 | 2.83 | 1.0962 | 1.0962 | |||||
| UAL / United Airlines Holdings, Inc. | 0.03 | -21.26 | 2.80 | -20.50 | 1.0849 | -0.0334 | |||
| O / Realty Income Corporation | 0.04 | 2.77 | 1.0741 | 1.0741 | |||||
| SNA / Snap-on Incorporated | 0.02 | -21.87 | 2.72 | -26.16 | 1.0524 | -0.1155 | |||
| MO / Altria Group, Inc. | 0.06 | -17.90 | 2.61 | -29.08 | 1.0113 | -0.1572 | |||
| F / Ford Motor Company | 0.28 | 54.05 | 2.56 | 37.92 | 0.9935 | 0.4032 | |||
| CIT / CIT Group Inc | 0.06 | 2.54 | 0.9826 | 0.9826 | |||||
| WEC / WEC Energy Group, Inc. | 0.03 | 2.53 | 0.9799 | 0.9799 | |||||
| CMI / Cummins Inc. | 0.02 | -5.42 | 2.52 | -10.19 | 0.9764 | 0.0854 | |||
| BKR / Baker Hughes Company | 0.11 | -21.24 | 2.46 | -25.80 | 0.9528 | -0.0995 | |||
| UNM / Unum Group | 0.08 | 2.42 | 0.9377 | 0.9377 | |||||
| BRO / Brown & Brown, Inc. | 0.07 | 2.36 | 0.9129 | 0.9129 | |||||
| H / Hyatt Hotels Corporation | 0.03 | 2.35 | 0.9090 | 0.9090 | |||||
| VRNT / Verint Systems Inc. | 0.05 | -11.74 | 2.34 | -29.80 | 0.9055 | -0.1515 | |||
| TMO / Thermo Fisher Scientific Inc. | 0.01 | -5.42 | 2.29 | -6.22 | 0.8885 | 0.1121 | |||
| TGT / Target Corporation | 0.02 | -32.69 | 2.27 | -16.91 | 0.8776 | 0.0120 | |||
| DELL / Dell Technologies Inc. | 0.04 | 2.25 | 0.8722 | 0.8722 | |||||
| KNX / Knight-Swift Transportation Holdings Inc. | 0.06 | -5.56 | 2.10 | 4.37 | 0.8141 | 0.1749 | |||
| TXT / Textron Inc. | 0.04 | -21.26 | 2.07 | -27.33 | 0.8025 | -0.1025 | |||
| MOH / Molina Healthcare, Inc. | 0.02 | -5.42 | 1.96 | -27.50 | 0.7610 | -0.0992 | |||
| GM / General Motors Company | 0.05 | -21.24 | 1.92 | -23.40 | 0.7420 | -0.0518 | |||
| ORCL / Oracle Corporation | 0.03 | -39.27 | 1.87 | -41.32 | 0.7242 | -0.2872 | |||
| WRK / WestRock Company | 0.05 | -21.32 | 1.86 | -21.35 | 0.7195 | -0.0302 | |||
| ALLY / Ally Financial Inc. | 0.06 | 1.84 | 0.7137 | 0.7137 | |||||
| CNK / Cinemark Holdings, Inc. | 0.05 | -14.45 | 1.82 | -8.45 | 0.7048 | 0.0739 | |||
| DIS / The Walt Disney Company | 0.01 | -0.27 | 1.75 | -6.90 | 0.6792 | 0.0813 | |||
| ANTM / Anthem Inc | 0.01 | -32.85 | 1.74 | -42.89 | 0.6723 | -0.2924 | |||
| M / Macy's, Inc. | 0.10 | -5.60 | 1.63 | -31.63 | 0.6324 | -0.1256 | |||
| DISCA / Discovery Inc - Class A | 0.06 | -59.86 | 1.59 | -65.17 | 0.6165 | -0.8340 | |||
| OGE / OGE Energy Corp. | 0.03 | -61.13 | 1.44 | -58.56 | 0.5568 | -0.5444 | |||
| LEA / Lear Corporation | 0.01 | -21.98 | 1.36 | -33.95 | 0.5262 | -0.1267 | |||
| LLY / Eli Lilly and Company | 0.01 | -54.35 | 1.23 | -53.93 | 0.4747 | -0.3697 | |||
| OXY / Occidental Petroleum Corporation | 0.00 | -100.00 | 0.00 | -100.00 | -0.1797 | ||||
| MCD / McDonald's Corporation | 0.00 | -100.00 | 0.00 | -100.00 | -0.8088 | ||||
| PEG / Public Service Enterprise Group Incorporated | 0.00 | -100.00 | 0.00 | -100.00 | -0.1746 | ||||
| PFE / Pfizer Inc. | 0.00 | -100.00 | 0.00 | -100.00 | -1.1491 | ||||
| MDT / Medtronic plc | 0.00 | -100.00 | 0.00 | -100.00 | -0.4137 | ||||
| AVGO / Broadcom Inc. | 0.00 | -100.00 | 0.00 | -100.00 | -0.2274 | ||||
| WBA / Walgreens Boots Alliance, Inc. | 0.00 | -100.00 | 0.00 | -100.00 | -1.3889 | ||||
| FL / Foot Locker, Inc. | 0.00 | -100.00 | 0.00 | -100.00 | -0.5620 | ||||
| DRI / Darden Restaurants, Inc. | 0.00 | -100.00 | 0.00 | -100.00 | -0.1988 | ||||
| MS / Morgan Stanley | 0.00 | -100.00 | 0.00 | -100.00 | -0.9310 | ||||
| CSCO / Cisco Systems, Inc. | 0.00 | -100.00 | 0.00 | -100.00 | -1.1161 | ||||
| NUE / Nucor Corporation | 0.00 | -100.00 | 0.00 | -100.00 | -0.1213 | ||||
| SLM / SLM Corporation | 0.00 | -100.00 | 0.00 | -100.00 | -0.8043 | ||||
| HST / Host Hotels & Resorts, Inc. | 0.00 | -100.00 | 0.00 | -100.00 | -1.2812 | ||||
| KMB / Kimberly-Clark Corporation | 0.00 | -100.00 | 0.00 | -100.00 | -0.1283 | ||||
| MOS / The Mosaic Company | 0.00 | -100.00 | 0.00 | -100.00 | -1.0447 | ||||
| C.WSA / Citigroup, Inc. | 0.00 | -100.00 | 0.00 | -100.00 | -1.1269 | ||||
| AEE / Ameren Corporation | 0.00 | -100.00 | 0.00 | -100.00 | -1.2654 | ||||
| HOLX / Hologic, Inc. | 0.00 | -100.00 | 0.00 | -100.00 | -0.6328 | ||||
| ZION / Zions Bancorporation, National Association | 0.00 | -100.00 | 0.00 | -100.00 | -0.9726 | ||||
| EXC / Exelon Corporation | 0.00 | -100.00 | 0.00 | -100.00 | -1.4705 | ||||
| AME / AMETEK, Inc. | 0.00 | -100.00 | 0.00 | -100.00 | -1.2749 | ||||
| WFC / Wells Fargo & Company | 0.00 | -100.00 | 0.00 | -100.00 | -0.4122 | ||||
| DUK / Duke Energy Corporation | 0.00 | -100.00 | 0.00 | -100.00 | -1.5946 | ||||
| MET / MetLife, Inc. | 0.00 | -100.00 | 0.00 | -100.00 | -1.8023 | ||||
| VICI / VICI Properties Inc. | 0.00 | -100.00 | 0.00 | -100.00 | 0.0000 | 0.0000 | |||
| COP / ConocoPhillips | 0.00 | -100.00 | 0.00 | -100.00 | -0.2016 | ||||
| HPE / Hewlett Packard Enterprise Company | 0.00 | -100.00 | 0.00 | -100.00 | -0.9424 | ||||
| LPT / Liberty Property Trust | 0.00 | -100.00 | 0.00 | -100.00 | 0.0000 | 0.0000 | |||
| ETN / Eaton Corporation plc | 0.00 | -100.00 | 0.00 | -100.00 | -0.1159 | ||||
| PPL / PPL Corporation | 0.00 | -100.00 | 0.00 | -100.00 | -0.8215 | ||||
| LNC / Lincoln National Corporation | 0.00 | -100.00 | 0.00 | -100.00 | -1.0348 |