Mga Batayang Estadistika
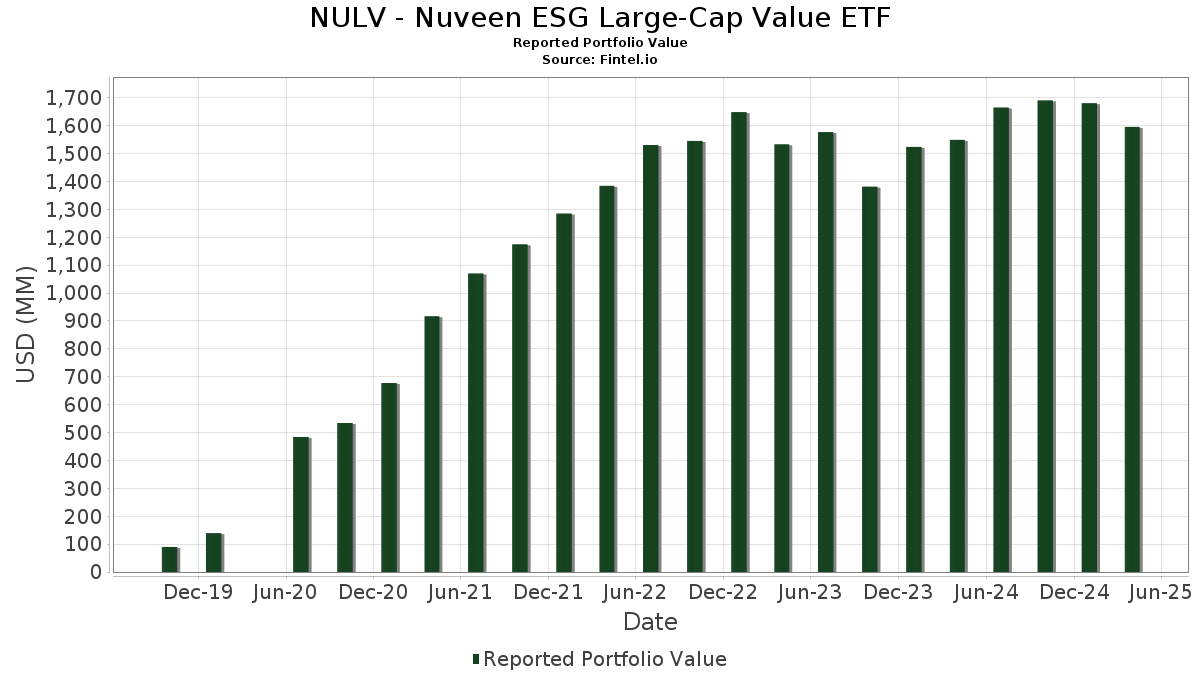
| Nilai Portofolio | $ 1,595,746,665 |
| Posisi Saat Ini | 111 |
Kepemilikan Terbaru, Kinerja, AUM (dari 13F, 13D)
NULV - Nuveen ESG Large-Cap Value ETF telah mengungkapkan total kepemilikan 111 dalam pengajuan SEC terbaru mereka. Nilai portofolio terbaru dihitung sebesar $ 1,595,746,665 USD. Aset yang Dikelola (AUM) sebenarnya adalah nilai ini ditambah kas (yang tidak diungkapkan). Aset-aset utama NULV - Nuveen ESG Large-Cap Value ETF adalah The Coca-Cola Company (US:KO) , McDonald's Corporation (US:MCD) , Verizon Communications Inc. (US:VZ) , International Business Machines Corporation (US:IBM) , and Bank of America Corporation (US:BAC) . Posisi baru NULV - Nuveen ESG Large-Cap Value ETF meliputi: Union Pacific Corporation (US:UNP) , Edwards Lifesciences Corporation (US:EW) , .
Peningkatan Tertinggi Kuartal Ini
Kami menggunakan perubahan dalam alokasi portofolio karena ini adalah metrik yang paling bermakna. Perubahan dapat disebabkan oleh perdagangan atau perubahan harga saham.
| Keamanan | Saham (MM) |
Nilai (Juta Dolar AS) |
Portfolio % | ΔPorsyento ng Portfolio |
|---|---|---|---|---|
| 0.04 | 23.72 | 1.4821 | 1.4821 | |
| 0.10 | 20.99 | 1.3115 | 1.3115 | |
| 0.24 | 17.95 | 1.1220 | 1.1220 | |
| 0.17 | 16.70 | 1.0438 | 0.8945 | |
| 0.26 | 14.57 | 0.9107 | 0.8875 | |
| 0.39 | 19.43 | 1.2144 | 0.6714 | |
| 0.04 | 8.27 | 0.5165 | 0.5165 | |
| 0.58 | 42.40 | 2.6499 | 0.3480 | |
| 0.23 | 25.45 | 1.5902 | 0.3395 | |
| 0.80 | 35.27 | 2.2043 | 0.3386 |
Penurunan Tertinggi Kuartal Ini
Kami menggunakan perubahan dalam alokasi portofolio karena ini adalah metrik yang paling bermakna. Perubahan dapat disebabkan oleh perdagangan atau perubahan harga saham.
| Keamanan | Saham (MM) |
Nilai (Juta Dolar AS) |
Portfolio % | ΔPorsyento ng Portfolio |
|---|---|---|---|---|
| 0.13 | 20.72 | 1.2950 | -0.8928 | |
| 0.38 | 25.93 | 1.6206 | -0.4855 | |
| 0.32 | 28.79 | 1.7992 | -0.4031 | |
| 0.52 | 18.40 | 1.1500 | -0.3844 | |
| 0.14 | 34.66 | 2.1661 | -0.2977 | |
| 0.06 | 27.77 | 1.7354 | -0.2957 | |
| 0.13 | 23.68 | 1.4795 | -0.2924 | |
| 0.08 | 22.44 | 1.4023 | -0.2891 | |
| 0.13 | 20.61 | 1.2881 | -0.2398 | |
| 0.10 | 10.65 | 0.6654 | -0.2241 |
Pengajuan 13F dan Dana
Formulir ini diajukan pada 2025-06-26 untuk periode pelaporan 2025-04-30. Klik ikon tautan untuk melihat riwayat transaksi selengkapnya.
Tingkatkan ke versi premium untuk membuka data premium dan ekspor ke Excel. ![]() .
.
| Keamanan | Ketik | Harga Saham Rata-rata | Saham (MM) |
ΔSaham (%) |
ΔSaham (%) |
Nilai ($MM) |
Portpolyo (%) |
ΔPortofolio (%) |
|
|---|---|---|---|---|---|---|---|---|---|
| KO / The Coca-Cola Company | 0.58 | -4.30 | 42.40 | 9.37 | 2.6499 | 0.3480 | |||
| MCD / McDonald's Corporation | 0.12 | -0.77 | 37.78 | 9.87 | 2.3609 | 0.3193 | |||
| VZ / Verizon Communications Inc. | 0.80 | 0.36 | 35.27 | 12.26 | 2.2043 | 0.3386 | |||
| IBM / International Business Machines Corporation | 0.14 | -11.67 | 34.66 | -16.47 | 2.1661 | -0.2977 | |||
| BAC / Bank of America Corporation | 0.86 | 17.72 | 34.26 | 1.39 | 2.1408 | 0.1348 | |||
| DIS / The Walt Disney Company | 0.32 | -3.51 | 28.79 | -22.38 | 1.7992 | -0.4031 | |||
| MMC / Marsh & McLennan Companies, Inc. | 0.13 | -0.88 | 28.32 | 3.04 | 1.7697 | 0.1380 | |||
| WELL / Welltower Inc. | 0.18 | -7.86 | 27.95 | 3.02 | 1.7464 | 0.1357 | |||
| DE / Deere & Company | 0.06 | -16.55 | 27.77 | -18.82 | 1.7354 | -0.2957 | |||
| PGR / The Progressive Corporation | 0.10 | 0.14 | 27.76 | 14.48 | 1.7346 | 0.2950 | |||
| MRK / Merck & Co., Inc. | 0.33 | 0.17 | 27.74 | -13.63 | 1.7332 | -0.1734 | |||
| AMGN / Amgen Inc. | 0.09 | 0.10 | 26.59 | 2.03 | 1.6613 | 0.1143 | |||
| CI / The Cigna Group | 0.08 | 0.10 | 26.58 | 15.69 | 1.6612 | 0.2970 | |||
| EXC / Exelon Corporation | 0.57 | -6.08 | 26.55 | 10.12 | 1.6592 | 0.2278 | |||
| SPGI / S&P Global Inc. | 0.05 | -4.60 | 26.49 | -8.51 | 1.6554 | -0.0637 | |||
| TXN / Texas Instruments Incorporated | 0.16 | 0.14 | 25.94 | -13.18 | 1.6210 | -0.1529 | |||
| C / Citigroup Inc. | 0.38 | -12.94 | 25.93 | -26.89 | 1.6206 | -0.4855 | |||
| LOW / Lowe's Companies, Inc. | 0.12 | -0.05 | 25.88 | -14.07 | 1.6175 | -0.1709 | |||
| TRV / The Travelers Companies, Inc. | 0.10 | -0.07 | 25.74 | 7.66 | 1.6086 | 0.1890 | |||
| ED / Consolidated Edison, Inc. | 0.23 | 0.43 | 25.45 | 20.80 | 1.5902 | 0.3395 | |||
| MMM / 3M Company | 0.18 | 0.12 | 24.33 | -8.62 | 1.5201 | -0.0604 | |||
| PH / Parker-Hannifin Corporation | 0.04 | 23.72 | 1.4821 | 1.4821 | |||||
| FI / Fiserv, Inc. | 0.13 | -7.14 | 23.68 | -20.67 | 1.4795 | -0.2924 | |||
| DHR / Danaher Corporation | 0.12 | 0.16 | 23.19 | -10.37 | 1.4495 | -0.0870 | |||
| ADP / Automatic Data Processing, Inc. | 0.08 | 0.12 | 23.11 | -0.67 | 1.4442 | 0.0627 | |||
| BK / The Bank of New York Mellon Corporation | 0.29 | -10.86 | 23.10 | -16.59 | 1.4434 | -0.2007 | |||
| MCK / McKesson Corporation | 0.03 | 0.12 | 22.94 | 19.99 | 1.4334 | 0.2984 | |||
| MS / Morgan Stanley | 0.20 | -0.07 | 22.69 | -16.68 | 1.4178 | -0.1989 | |||
| CRM / Salesforce, Inc. | 0.08 | 0.16 | 22.44 | -21.23 | 1.4023 | -0.2891 | |||
| KVUE / Kenvue Inc. | 0.94 | 0.12 | 22.17 | 10.98 | 1.3856 | 0.1994 | |||
| AXP / American Express Company | 0.08 | 0.15 | 22.16 | -15.95 | 1.3846 | -0.1806 | |||
| AMT / American Tower Corporation | 0.10 | 0.10 | 21.62 | 22.00 | 1.3512 | 0.2989 | |||
| ECL / Ecolab Inc. | 0.09 | 0.31 | 21.59 | 0.80 | 1.3491 | 0.0776 | |||
| INTC / Intel Corporation | 1.07 | -3.38 | 21.47 | -0.05 | 1.3417 | 0.0663 | |||
| OKE / ONEOK, Inc. | 0.26 | 9.40 | 21.17 | -7.50 | 1.3229 | -0.0359 | |||
| UNP / Union Pacific Corporation | 0.10 | 20.99 | 1.3115 | 1.3115 | |||||
| PG / The Procter & Gamble Company | 0.13 | -38.82 | 20.72 | -39.06 | 1.2950 | -0.8928 | |||
| PNC / The PNC Financial Services Group, Inc. | 0.13 | 0.16 | 20.61 | -19.90 | 1.2881 | -0.2398 | |||
| SRE / Sempra | 0.27 | 0.09 | 20.22 | -10.36 | 1.2637 | -0.0757 | |||
| BMY / Bristol-Myers Squibb Company | 0.39 | 149.55 | 19.43 | 112.51 | 1.2144 | 0.6714 | |||
| HD / The Home Depot, Inc. | 0.05 | 0.16 | 19.36 | -12.36 | 1.2101 | -0.1017 | |||
| BKR / Baker Hughes Company | 0.52 | -7.11 | 18.40 | -28.79 | 1.1500 | -0.3844 | |||
| FERG / Ferguson Enterprises Inc. | 0.11 | -0.06 | 18.04 | -6.37 | 1.1270 | -0.0167 | |||
| EW / Edwards Lifesciences Corporation | 0.24 | 17.95 | 1.1220 | 1.1220 | |||||
| HCA / HCA Healthcare, Inc. | 0.05 | 0.10 | 16.93 | 4.71 | 1.0579 | 0.0980 | |||
| TGT / Target Corporation | 0.17 | 846.96 | 16.70 | 564.14 | 1.0438 | 0.8945 | |||
| FTV / Fortive Corporation | 0.23 | 0.06 | 16.32 | -14.27 | 1.0201 | -0.1103 | |||
| CHD / Church & Dwight Co., Inc. | 0.16 | -0.15 | 16.15 | -6.00 | 1.0094 | -0.0108 | |||
| GS / The Goldman Sachs Group, Inc. | 0.03 | 0.06 | 15.92 | -14.45 | 0.9951 | -0.1100 | |||
| COR / Cencora, Inc. | 0.05 | 0.08 | 15.89 | 15.22 | 0.9928 | 0.1741 | |||
| CBOE / Cboe Global Markets, Inc. | 0.07 | 0.89 | 15.70 | 9.52 | 0.9810 | 0.1299 | |||
| ADM / Archer-Daniels-Midland Company | 0.32 | 0.89 | 15.44 | -5.96 | 0.9646 | -0.0100 | |||
| CAH / Cardinal Health, Inc. | 0.11 | 0.10 | 15.18 | 14.37 | 0.9483 | 0.1605 | |||
| CAT / Caterpillar Inc. | 0.05 | 0.10 | 14.66 | -16.66 | 0.9158 | -0.1282 | |||
| GIS / General Mills, Inc. | 0.26 | 5,137.28 | 14.57 | 4,468.03 | 0.9107 | 0.8875 | |||
| GILD / Gilead Sciences, Inc. | 0.12 | 0.10 | 12.79 | 9.72 | 0.7991 | 0.1071 | |||
| FIS / Fidelity National Information Services, Inc. | 0.16 | 0.56 | 12.71 | -2.64 | 0.7946 | 0.0192 | |||
| KDP / Keurig Dr Pepper Inc. | 0.35 | 0.15 | 12.18 | 7.91 | 0.7611 | 0.0910 | |||
| HAL / Halliburton Company | 0.59 | -0.16 | 11.70 | -23.95 | 0.7314 | -0.1823 | |||
| WTW / Willis Towers Watson Public Limited Company | 0.04 | 0.10 | 11.25 | -6.51 | 0.7033 | -0.0114 | |||
| JCI / Johnson Controls International plc | 0.13 | 0.16 | 10.70 | 7.74 | 0.6689 | 0.0790 | |||
| PPG / PPG Industries, Inc. | 0.10 | 0.10 | 10.65 | -5.56 | 0.6655 | -0.0040 | |||
| A / Agilent Technologies, Inc. | 0.10 | 0.08 | 10.65 | -28.93 | 0.6654 | -0.2241 | |||
| RF / Regions Financial Corporation | 0.52 | 0.07 | 10.59 | -17.11 | 0.6617 | -0.0968 | |||
| AMAT / Applied Materials, Inc. | 0.07 | 0.07 | 10.41 | -16.38 | 0.6502 | -0.0885 | |||
| J / Jacobs Solutions Inc. | 0.08 | 0.09 | 10.29 | -11.58 | 0.6431 | -0.0479 | |||
| EQIX / Equinix, Inc. | 0.01 | 0.10 | 9.95 | -5.71 | 0.6217 | -0.0047 | |||
| BR / Broadridge Financial Solutions, Inc. | 0.04 | 0.14 | 9.70 | 1.90 | 0.6059 | 0.0409 | |||
| STLD / Steel Dynamics, Inc. | 0.07 | 0.17 | 9.01 | 1.36 | 0.5632 | 0.0352 | |||
| ES / Eversource Energy | 0.15 | 0.20 | 8.94 | 3.33 | 0.5589 | 0.0450 | |||
| IR / Ingersoll Rand Inc. | 0.12 | 0.10 | 8.79 | -19.51 | 0.5496 | -0.0991 | |||
| FSLR / First Solar, Inc. | 0.07 | -0.13 | 8.57 | -24.99 | 0.5354 | -0.1427 | |||
| ABBV / AbbVie Inc. | 0.04 | 8.27 | 0.5165 | 0.5165 | |||||
| JNPR / Juniper Networks, Inc. | 0.22 | 0.39 | 8.01 | 4.60 | 0.5007 | 0.0459 | |||
| FFIV / F5, Inc. | 0.03 | 0.21 | 7.68 | -10.75 | 0.4801 | -0.0310 | |||
| ATO / Atmos Energy Corporation | 0.05 | 0.30 | 7.60 | 13.06 | 0.4751 | 0.0758 | |||
| EA / Electronic Arts Inc. | 0.05 | 0.29 | 7.55 | 18.38 | 0.4721 | 0.0932 | |||
| AFL / Aflac Incorporated | 0.07 | 0.34 | 7.54 | 1.55 | 0.4712 | 0.0304 | |||
| BG / Bunge Global SA | 0.09 | -0.23 | 7.44 | 3.16 | 0.4646 | 0.0367 | |||
| MET / MetLife, Inc. | 0.09 | 0.27 | 6.92 | -12.64 | 0.4324 | -0.0379 | |||
| SOLV / Solventum Corporation | 0.10 | 0.28 | 6.50 | -10.47 | 0.4062 | -0.0248 | |||
| PHM / PulteGroup, Inc. | 0.06 | 0.34 | 6.39 | -9.55 | 0.3991 | -0.0201 | |||
| NEM / Newmont Corporation | 0.10 | 5.29 | 5.41 | 29.83 | 0.3381 | 0.0907 | |||
| WST / West Pharmaceutical Services, Inc. | 0.02 | 0.53 | 5.03 | -37.81 | 0.3143 | -0.1659 | |||
| EXPD / Expeditors International of Washington, Inc. | 0.04 | 4.70 | 0.2940 | 0.2940 | |||||
| WDC / Western Digital Corporation | 0.10 | 0.72 | 4.35 | -32.18 | 0.2721 | -0.1090 | |||
| NXPI / NXP Semiconductors N.V. | 0.02 | 0.70 | 4.30 | -11.00 | 0.2686 | -0.0182 | |||
| KHC / The Kraft Heinz Company | 0.14 | 2,780.29 | 4.11 | 2,570.13 | 0.2570 | 0.2458 | |||
| RIVN / Rivian Automotive, Inc. | 0.29 | 0.12 | 3.90 | 8.89 | 0.2435 | 0.0310 | |||
| FOX / Fox Corporation | 0.08 | 0.82 | 3.70 | -4.07 | 0.2315 | 0.0022 | |||
| OC / Owens Corning | 0.03 | 0.95 | 3.67 | -20.46 | 0.2291 | -0.0445 | |||
| HRL / Hormel Foods Corporation | 0.12 | 1.12 | 3.53 | 0.86 | 0.2207 | 0.0128 | |||
| IPG / The Interpublic Group of Companies, Inc. | 0.13 | -0.44 | 3.27 | -12.77 | 0.2046 | -0.0182 | |||
| EBAY / eBay Inc. | 0.04 | 2.89 | 0.1808 | 0.1808 | |||||
| TFC / Truist Financial Corporation | 0.06 | 1.61 | 2.36 | -18.19 | 0.1472 | -0.0238 | |||
| K / Kellanova | 0.03 | 2.12 | 0.1324 | 0.1324 | |||||
| URI / United Rentals, Inc. | 0.00 | -55.26 | 2.01 | -62.75 | 0.1257 | -0.1948 | |||
| REGN / Regeneron Pharmaceuticals, Inc. | 0.00 | -1.84 | 1.76 | -12.67 | 0.1098 | -0.0097 | |||
| HPQ / HP Inc. | 0.07 | 0.06 | 1.67 | -21.29 | 0.1044 | -0.0216 | |||
| BLL / Ball Corp. | 0.03 | -1.62 | 1.39 | -8.25 | 0.0869 | -0.0031 | |||
| VMC / Vulcan Materials Company | 0.01 | -1.82 | 1.36 | -6.03 | 0.0848 | -0.0010 | |||
| PRU / Prudential Financial, Inc. | 0.01 | -2.21 | 1.10 | -16.84 | 0.0685 | -0.0098 | |||
| AWK / American Water Works Company, Inc. | 0.01 | 4.67 | 0.81 | 23.52 | 0.0509 | 0.0117 | |||
| CBRE / CBRE Group, Inc. | 0.01 | -1.32 | 0.81 | -16.70 | 0.0509 | -0.0071 | |||
| IRM / Iron Mountain Incorporated | 0.00 | 5.13 | 0.39 | -7.21 | 0.0241 | -0.0006 | |||
| KMB / Kimberly-Clark Corporation | 0.00 | 4.42 | 0.38 | 5.92 | 0.0235 | 0.0024 | |||
| AJG / Arthur J. Gallagher & Co. | 0.00 | 3.76 | 0.37 | 10.09 | 0.0232 | 0.0032 | |||
| US8575093013 / State Street Navigator Securities Lending Government Money Market Portfolio | 0.37 | 358.87 | 0.37 | 362.03 | 0.0228 | 0.0181 | |||
| STE / STERIS plc | 0.00 | 6.71 | 0.30 | 8.70 | 0.0187 | 0.0024 | |||
| CNH / CNH Industrial N.V. | 0.03 | 5.01 | 0.29 | -5.48 | 0.0183 | -0.0001 | |||
| HOLX / Hologic, Inc. | 0.00 | 4.25 | 0.17 | -16.10 | 0.0108 | -0.0014 |