Mga Batayang Estadistika
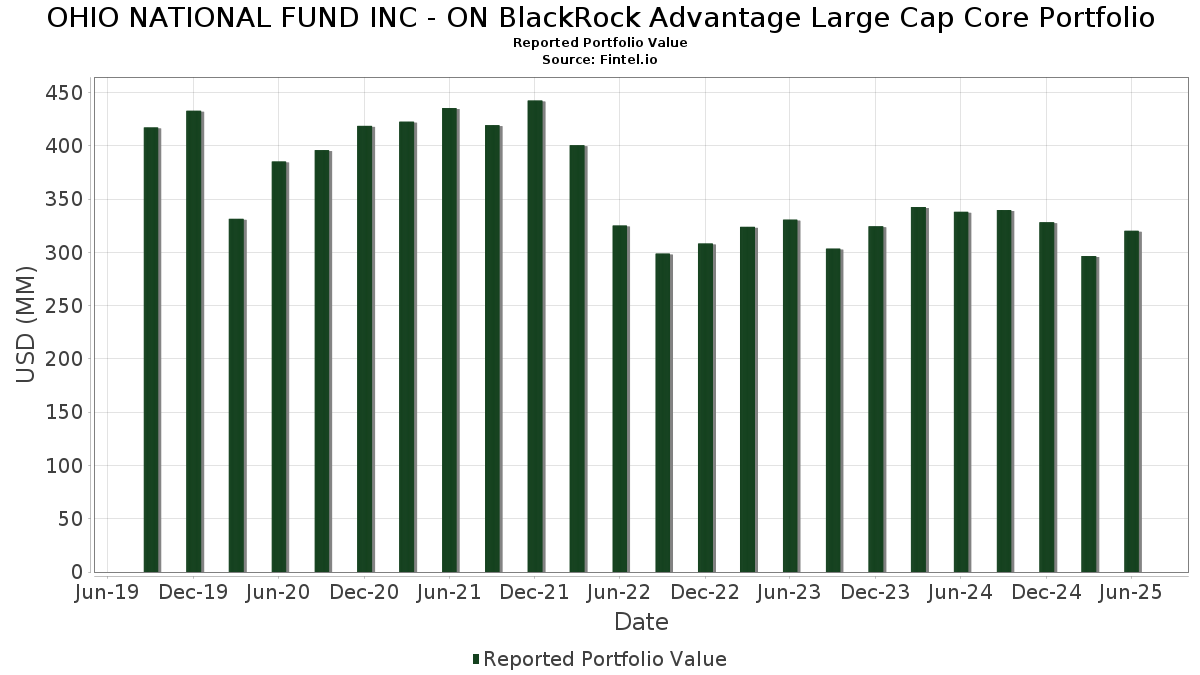
| Nilai Portofolio | $ 320,297,188 |
| Posisi Saat Ini | 129 |
Kepemilikan Terbaru, Kinerja, AUM (dari 13F, 13D)
OHIO NATIONAL FUND INC - ON BlackRock Advantage Large Cap Core Portfolio telah mengungkapkan total kepemilikan 129 dalam pengajuan SEC terbaru mereka. Nilai portofolio terbaru dihitung sebesar $ 320,297,188 USD. Aset yang Dikelola (AUM) sebenarnya adalah nilai ini ditambah kas (yang tidak diungkapkan). Aset-aset utama OHIO NATIONAL FUND INC - ON BlackRock Advantage Large Cap Core Portfolio adalah Microsoft Corporation (US:MSFT) , NVIDIA Corporation (US:NVDA) , Apple Inc. (US:AAPL) , Amazon.com, Inc. (US:AMZN) , and Meta Platforms, Inc. (US:META) . Posisi baru OHIO NATIONAL FUND INC - ON BlackRock Advantage Large Cap Core Portfolio meliputi: Blackstone Inc. (US:BX) , Flowserve Corporation (US:FLS) , RTX Corporation (US:RTX) , PG&E Corporation (US:PCG) , and Elastic N.V. (US:ESTC) .
Peningkatan Tertinggi Kuartal Ini
Kami menggunakan perubahan dalam alokasi portofolio karena ini adalah metrik yang paling bermakna. Perubahan dapat disebabkan oleh perdagangan atau perubahan harga saham.
| Keamanan | Saham (MM) |
Nilai (Juta Dolar AS) |
Portfolio % | ΔPorsyento ng Portfolio |
|---|---|---|---|---|
| 0.16 | 25.38 | 7.8071 | 1.8369 | |
| 0.05 | 25.96 | 7.9857 | 1.2336 | |
| 0.03 | 8.02 | 2.4676 | 0.8501 | |
| 0.02 | 3.38 | 1.0388 | 0.8324 | |
| 0.04 | 3.52 | 1.0836 | 0.8246 | |
| 0.00 | 2.35 | 0.7215 | 0.7215 | |
| 0.01 | 2.80 | 0.8626 | 0.7190 | |
| 0.06 | 6.05 | 1.8613 | 0.6947 | |
| 0.00 | 2.72 | 0.8364 | 0.6891 | |
| 0.04 | 3.81 | 1.1733 | 0.6281 |
Penurunan Tertinggi Kuartal Ini
Kami menggunakan perubahan dalam alokasi portofolio karena ini adalah metrik yang paling bermakna. Perubahan dapat disebabkan oleh perdagangan atau perubahan harga saham.
| Keamanan | Saham (MM) |
Nilai (Juta Dolar AS) |
Portfolio % | ΔPorsyento ng Portfolio |
|---|---|---|---|---|
| 0.10 | 20.78 | 6.3928 | -1.0767 | |
| 0.00 | 1.60 | 0.4920 | -0.9165 | |
| 0.02 | 1.38 | 0.4259 | -0.7111 | |
| 0.01 | 1.81 | 0.5558 | -0.6085 | |
| 0.01 | 2.08 | 0.6402 | -0.5382 | |
| 0.01 | 0.55 | 0.1683 | -0.5351 | |
| 0.00 | 0.50 | 0.1534 | -0.5018 | |
| 0.01 | 1.91 | 0.5871 | -0.4766 | |
| 0.00 | 3.80 | 1.1697 | -0.4753 | |
| 0.00 | 1.03 | 0.3164 | -0.4533 |
Pengajuan 13F dan Dana
Formulir ini diajukan pada 2025-08-27 untuk periode pelaporan 2025-06-30. Klik ikon tautan untuk melihat riwayat transaksi selengkapnya.
Tingkatkan ke versi premium untuk membuka data premium dan ekspor ke Excel. ![]() .
.
| Keamanan | Ketik | Harga Saham Rata-rata | Saham (MM) |
ΔSaham (%) |
ΔSaham (%) |
Nilai ($MM) |
Portpolyo (%) |
ΔPortofolio (%) |
|
|---|---|---|---|---|---|---|---|---|---|
| MSFT / Microsoft Corporation | 0.05 | -3.67 | 25.96 | 27.64 | 7.9857 | 1.2336 | |||
| NVDA / NVIDIA Corporation | 0.16 | -3.19 | 25.38 | 41.13 | 7.8071 | 1.8369 | |||
| AAPL / Apple Inc. | 0.10 | 0.00 | 20.78 | -7.64 | 6.3928 | -1.0767 | |||
| AMZN / Amazon.com, Inc. | 0.07 | 0.00 | 15.09 | 15.31 | 4.6428 | 0.2975 | |||
| META / Meta Platforms, Inc. | 0.01 | -3.57 | 10.52 | 23.49 | 3.2350 | 0.4077 | |||
| GOOGL / Alphabet Inc. | 0.05 | 0.00 | 9.23 | 13.96 | 2.8399 | 0.1505 | |||
| AVGO / Broadcom Inc. | 0.03 | 0.00 | 8.02 | 64.63 | 2.4676 | 0.8501 | |||
| WMT / Walmart Inc. | 0.06 | 54.60 | 6.05 | 72.22 | 1.8613 | 0.6947 | |||
| GOOG / Alphabet Inc. | 0.03 | -3.95 | 5.12 | 9.04 | 1.5765 | 0.0165 | |||
| JPM / JPMorgan Chase & Co. | 0.02 | 0.00 | 4.80 | 18.19 | 1.4772 | 0.1283 | |||
| BAC / Bank of America Corporation | 0.09 | 0.00 | 4.37 | 13.40 | 1.3436 | 0.0649 | |||
| HD / The Home Depot, Inc. | 0.01 | 0.00 | 4.31 | 0.02 | 1.3270 | -0.1045 | |||
| MS / Morgan Stanley | 0.03 | 24.77 | 4.28 | 50.65 | 1.3168 | 0.3734 | |||
| MDT / Medtronic plc | 0.05 | 24.17 | 4.04 | 20.45 | 1.2430 | 0.1293 | |||
| CRM / Salesforce, Inc. | 0.01 | 32.35 | 3.90 | 37.13 | 1.1987 | 0.3351 | |||
| SCHW / The Charles Schwab Corporation | 0.04 | 99.28 | 3.81 | 132.28 | 1.1733 | 0.6281 | |||
| COST / Costco Wholesale Corporation | 0.00 | -26.68 | 3.80 | -23.25 | 1.1697 | -0.4753 | |||
| TSLA / Tesla, Inc. | 0.01 | -24.97 | 3.72 | -8.04 | 1.1434 | -0.1984 | |||
| ETR / Entergy Corporation | 0.04 | 364.48 | 3.52 | 351.54 | 1.0836 | 0.8246 | |||
| CAH / Cardinal Health, Inc. | 0.02 | 345.58 | 3.38 | 443.64 | 1.0388 | 0.8324 | |||
| BKNG / Booking Holdings Inc. | 0.00 | -29.16 | 3.28 | -10.98 | 1.0080 | -0.2140 | |||
| PH / Parker-Hannifin Corporation | 0.00 | -23.34 | 3.23 | -11.91 | 0.9924 | -0.2234 | |||
| TRV / The Travelers Companies, Inc. | 0.01 | 0.00 | 3.17 | 1.18 | 0.9753 | -0.0651 | |||
| LLY / Eli Lilly and Company | 0.00 | -21.33 | 3.11 | -25.75 | 0.9553 | -0.4331 | |||
| PM / Philip Morris International Inc. | 0.02 | 0.00 | 2.96 | 14.75 | 0.9098 | 0.0541 | |||
| MA / Mastercard Incorporated | 0.01 | 0.00 | 2.95 | 2.50 | 0.9077 | -0.0478 | |||
| CTAS / Cintas Corporation | 0.01 | -27.95 | 2.86 | -21.86 | 0.8796 | -0.3354 | |||
| REGN / Regeneron Pharmaceuticals, Inc. | 0.01 | 683.14 | 2.80 | 549.07 | 0.8626 | 0.7190 | |||
| NFLX / Netflix, Inc. | 0.00 | -9.56 | 2.80 | 29.84 | 0.8609 | 0.1455 | |||
| PFE / Pfizer Inc. | 0.11 | 31.08 | 2.73 | 25.41 | 0.8411 | 0.1172 | |||
| EQIX / Equinix, Inc. | 0.00 | 528.31 | 2.72 | 513.54 | 0.8364 | 0.6891 | |||
| FDX / FedEx Corporation | 0.01 | 347.19 | 2.64 | 317.06 | 0.8124 | 0.6021 | |||
| DVN / Devon Energy Corporation | 0.08 | 56.69 | 2.63 | 33.23 | 0.8105 | 0.1542 | |||
| QCOM / QUALCOMM Incorporated | 0.02 | 0.00 | 2.63 | 3.67 | 0.8081 | -0.0331 | |||
| BMY / Bristol-Myers Squibb Company | 0.06 | 81.05 | 2.58 | 61.98 | 0.7943 | 0.3308 | |||
| BRK.B / Berkshire Hathaway Inc. | 0.01 | 0.00 | 2.55 | -8.77 | 0.7839 | -0.1436 | |||
| SPGI / S&P Global Inc. | 0.00 | 0.00 | 2.54 | 3.81 | 0.7799 | -0.0311 | |||
| ICE / Intercontinental Exchange, Inc. | 0.01 | 0.00 | 2.51 | 6.35 | 0.7730 | -0.0114 | |||
| ADBE / Adobe Inc. | 0.01 | 0.00 | 2.49 | 0.89 | 0.7663 | -0.0535 | |||
| LMT / Lockheed Martin Corporation | 0.01 | 0.00 | 2.44 | 3.65 | 0.7521 | -0.0308 | |||
| CMCSA / Comcast Corporation | 0.07 | -12.80 | 2.37 | -15.67 | 0.7303 | -0.2042 | |||
| INTU / Intuit Inc. | 0.00 | 2.35 | 0.7215 | 0.7215 | |||||
| MSI / Motorola Solutions, Inc. | 0.01 | -23.37 | 2.33 | -26.40 | 0.7172 | -0.3345 | |||
| LRCX / Lam Research Corporation | 0.02 | 0.00 | 2.19 | 33.94 | 0.6738 | 0.1307 | |||
| ABBV / AbbVie Inc. | 0.01 | 0.00 | 2.10 | -11.40 | 0.6459 | -0.1409 | |||
| SPG / Simon Property Group, Inc. | 0.01 | -39.43 | 2.08 | -41.36 | 0.6402 | -0.5382 | |||
| MRK / Merck & Co., Inc. | 0.03 | 33.25 | 2.07 | 17.48 | 0.6370 | 0.0520 | |||
| PKG / Packaging Corporation of America | 0.01 | -14.57 | 1.96 | -18.69 | 0.6036 | -0.1977 | |||
| CME / CME Group Inc. | 0.01 | -21.62 | 1.96 | -18.58 | 0.6028 | -0.1961 | |||
| UNH / UnitedHealth Group Incorporated | 0.01 | 0.00 | 1.91 | -40.45 | 0.5871 | -0.4766 | |||
| TXN / Texas Instruments Incorporated | 0.01 | 25.68 | 1.91 | 69.88 | 0.5864 | 0.2425 | |||
| BX / Blackstone Inc. | 0.01 | 1.88 | 0.5798 | 0.5798 | |||||
| BSX / Boston Scientific Corporation | 0.02 | 120.96 | 1.88 | 135.38 | 0.5794 | 0.3136 | |||
| GILD / Gilead Sciences, Inc. | 0.02 | 0.00 | 1.83 | -1.03 | 0.5630 | -0.0511 | |||
| PGR / The Progressive Corporation | 0.01 | -45.37 | 1.81 | -48.50 | 0.5558 | -0.6085 | |||
| AME / AMETEK, Inc. | 0.01 | 1.78 | 0.5486 | 0.5486 | |||||
| APH / Amphenol Corporation | 0.02 | -47.99 | 1.71 | -21.71 | 0.5270 | -0.1993 | |||
| PG / The Procter & Gamble Company | 0.01 | 0.00 | 1.69 | -6.49 | 0.5187 | -0.0801 | |||
| UBER / Uber Technologies, Inc. | 0.02 | 44.34 | 1.67 | 84.83 | 0.5136 | 0.2137 | |||
| V / Visa Inc. | 0.00 | -62.79 | 1.60 | -62.31 | 0.4920 | -0.9165 | |||
| MCO / Moody's Corporation | 0.00 | 0.00 | 1.58 | 7.73 | 0.4846 | -0.0010 | |||
| RL / Ralph Lauren Corporation | 0.01 | 1.46 | 0.4506 | 0.4506 | |||||
| AMD / Advanced Micro Devices, Inc. | 0.01 | 0.00 | 1.44 | 38.06 | 0.4431 | 0.0969 | |||
| TRGP / Targa Resources Corp. | 0.01 | 72.88 | 1.43 | 50.16 | 0.4404 | 0.1238 | |||
| CL / Colgate-Palmolive Company | 0.02 | -58.33 | 1.38 | -59.59 | 0.4259 | -0.7111 | |||
| TOL / Toll Brothers, Inc. | 0.01 | 0.00 | 1.34 | 8.13 | 0.4135 | 0.0006 | |||
| PLTR / Palantir Technologies Inc. | 0.01 | 131.95 | 1.22 | 275.62 | 0.3745 | 0.2666 | |||
| BWA / BorgWarner Inc. | 0.04 | 0.00 | 1.21 | 16.88 | 0.3729 | 0.0285 | |||
| XOM / Exxon Mobil Corporation | 0.01 | 0.00 | 1.18 | -9.35 | 0.3641 | -0.0694 | |||
| MRVL / Marvell Technology, Inc. | 0.02 | 191.19 | 1.17 | 266.46 | 0.3596 | 0.2536 | |||
| AXP / American Express Company | 0.00 | 0.00 | 1.16 | 18.53 | 0.3582 | 0.0321 | |||
| ECL / Ecolab Inc. | 0.00 | 0.00 | 1.15 | 6.19 | 0.3537 | -0.0055 | |||
| ED / Consolidated Edison, Inc. | 0.01 | 0.00 | 1.15 | -9.27 | 0.3524 | -0.0667 | |||
| C / Citigroup Inc. | 0.01 | -40.41 | 1.13 | -28.56 | 0.3487 | -0.1780 | |||
| PNC / The PNC Financial Services Group, Inc. | 0.01 | -26.62 | 1.13 | -22.17 | 0.3467 | -0.1341 | |||
| TJX / The TJX Companies, Inc. | 0.01 | -44.03 | 1.12 | -43.24 | 0.3449 | -0.3110 | |||
| CMI / Cummins Inc. | 0.00 | 0.00 | 1.12 | 4.50 | 0.3430 | -0.0113 | |||
| TMO / Thermo Fisher Scientific Inc. | 0.00 | -35.15 | 1.11 | -47.18 | 0.3429 | -0.3574 | |||
| DIS / The Walt Disney Company | 0.01 | 87.63 | 1.06 | 146.87 | 0.3275 | 0.1952 | |||
| FIX / Comfort Systems USA, Inc. | 0.00 | 0.00 | 1.06 | 66.56 | 0.3249 | 0.1141 | |||
| ETN / Eaton Corporation plc | 0.00 | -66.22 | 1.03 | -55.65 | 0.3164 | -0.4533 | |||
| VZ / Verizon Communications Inc. | 0.02 | 0.00 | 1.02 | -4.59 | 0.3136 | -0.0412 | |||
| FLS / Flowserve Corporation | 0.02 | 0.99 | 0.3034 | 0.3034 | |||||
| WMB / The Williams Companies, Inc. | 0.02 | 96.12 | 0.97 | 106.16 | 0.2987 | 0.1423 | |||
| EXPD / Expeditors International of Washington, Inc. | 0.01 | 0.00 | 0.96 | -5.05 | 0.2952 | -0.0401 | |||
| HON / Honeywell International Inc. | 0.00 | 42.52 | 0.96 | 58.28 | 0.2941 | 0.1105 | |||
| OGE / OGE Energy Corp. | 0.02 | -34.56 | 0.93 | -36.81 | 0.2874 | -0.2035 | |||
| RTX / RTX Corporation | 0.01 | 0.90 | 0.2767 | 0.2767 | |||||
| NEM / Newmont Corporation | 0.02 | 129.32 | 0.90 | 183.60 | 0.2767 | 0.1752 | |||
| VTR / Ventas, Inc. | 0.01 | 0.00 | 0.87 | -8.19 | 0.2690 | -0.0471 | |||
| MTZ / MasTec, Inc. | 0.01 | 0.00 | 0.86 | 46.10 | 0.2654 | 0.0693 | |||
| FLEX / Flex Ltd. | 0.02 | -48.57 | 0.81 | -4.84 | 0.2481 | -0.0259 | |||
| KDP / Keurig Dr Pepper Inc. | 0.02 | -38.40 | 0.78 | -42.48 | 0.2414 | -0.1764 | |||
| NDAQ / Nasdaq, Inc. | 0.01 | 0.00 | 0.78 | 17.80 | 0.2405 | 0.0203 | |||
| DRI / Darden Restaurants, Inc. | 0.00 | -54.03 | 0.77 | -35.41 | 0.2357 | 0.2357 | |||
| FOXA / Fox Corporation | 0.01 | 0.76 | 0.2340 | 0.2340 | |||||
| PCG / PG&E Corporation | 0.05 | 0.75 | 0.2316 | 0.2316 | |||||
| NTRA / Natera, Inc. | 0.00 | 0.00 | 0.73 | 19.54 | 0.2240 | 0.0216 | |||
| CNC / Centene Corporation | 0.01 | -32.54 | 0.72 | -39.70 | 0.2206 | -0.1741 | |||
| AZO / AutoZone, Inc. | 0.00 | 0.68 | 0.2101 | 0.2101 | |||||
| FTNT / Fortinet, Inc. | 0.01 | -64.30 | 0.66 | -60.81 | 0.2025 | -0.3549 | |||
| HBAN / Huntington Bancshares Incorporated | 0.04 | 246.66 | 0.63 | 276.79 | 0.1950 | 0.1570 | |||
| YUM / Yum! Brands, Inc. | 0.00 | 0.62 | 0.1902 | 0.1902 | |||||
| ESTC / Elastic N.V. | 0.01 | 0.60 | 0.1858 | 0.1858 | |||||
| DAL / Delta Air Lines, Inc. | 0.01 | 0.00 | 0.60 | 12.76 | 0.1851 | 0.0080 | |||
| ACN / Accenture plc | 0.00 | -66.15 | 0.60 | -67.59 | 0.1838 | -0.4279 | |||
| HAL / Halliburton Company | 0.03 | -52.27 | 0.59 | -61.69 | 0.1811 | -0.3287 | |||
| WCN / Waste Connections, Inc. | 0.00 | 197.70 | 0.58 | 308.45 | 0.1787 | 0.1465 | |||
| TT / Trane Technologies plc | 0.00 | -69.09 | 0.55 | -59.87 | 0.1690 | -0.2855 | |||
| KO / The Coca-Cola Company | 0.01 | -73.87 | 0.55 | -74.22 | 0.1683 | -0.5351 | |||
| EIX / Edison International | 0.01 | 0.53 | 0.1615 | 0.1615 | |||||
| LNG / Cheniere Energy, Inc. | 0.00 | 0.00 | 0.50 | 5.26 | 0.1541 | -0.0039 | |||
| NOW / ServiceNow, Inc. | 0.00 | -80.44 | 0.50 | -74.76 | 0.1534 | -0.5018 | |||
| HEIA / Heico Corp. - Class A | 0.00 | -87.70 | 0.50 | -69.82 | 0.1525 | -0.3503 | |||
| AR / Antero Resources Corporation | 0.01 | 0.48 | 0.1468 | 0.1468 | |||||
| WM / Waste Management, Inc. | 0.00 | 0.00 | 0.46 | -1.28 | 0.1424 | -0.0131 | |||
| ALL / The Allstate Corporation | 0.00 | 0.00 | 0.46 | -2.75 | 0.1414 | -0.0156 | |||
| UPS / United Parcel Service, Inc. | 0.00 | -41.98 | 0.46 | -62.74 | 0.1400 | -0.2314 | |||
| CUBE / CubeSmart | 0.01 | 0.00 | 0.44 | -0.46 | 0.1345 | -0.0114 | |||
| BMRN / BioMarin Pharmaceutical Inc. | 0.01 | 0.00 | 0.43 | -22.28 | 0.1323 | -0.0513 | |||
| FI / Fiserv, Inc. | 0.00 | 26.27 | 0.43 | 103.81 | 0.1318 | 0.0835 | |||
| LAD / Lithia Motors, Inc. | 0.00 | 63.25 | 0.42 | 85.96 | 0.1306 | 0.0790 | |||
| ORLY / O'Reilly Automotive, Inc. | 0.00 | 0.42 | 0.1281 | 0.1281 | |||||
| GD / General Dynamics Corporation | 0.00 | -62.52 | 0.41 | -59.90 | 0.1259 | -0.2128 | |||
| GRMN / Garmin Ltd. | 0.00 | 0.39 | 0.1197 | 0.1197 | |||||
| UNP / Union Pacific Corporation | 0.00 | -12.16 | 0.37 | -2.36 | 0.1145 | -0.0073 | |||
| FICO / Fair Isaac Corporation | 0.00 | 0.00 | 0.34 | -0.87 | 0.1052 | -0.0093 | |||
| S+P500 EMINI FUT SEP25 XCME 20250919 / DE (000000000) | 0.16 | 0.0495 | 0.0495 | ||||||
| FOX / Fox Corporation | 0.00 | -1.55 | 0.04 | -4.55 | 0.0132 | -0.0016 | |||
| UHS / Universal Health Services, Inc. | 0.00 | -100.00 | 0.00 | -100.00 | -0.1132 | ||||
| SAIL / SailPoint, Inc. | 0.00 | -100.00 | 0.00 | -100.00 | -0.0252 | ||||
| ISRG / Intuitive Surgical, Inc. | 0.00 | -100.00 | 0.00 | -100.00 | -0.1366 | ||||
| IRM / Iron Mountain Incorporated | 0.00 | -100.00 | 0.00 | -100.00 | -0.3997 | ||||
| STZ / Constellation Brands, Inc. | 0.00 | -100.00 | 0.00 | -100.00 | -0.1463 |