Mga Batayang Estadistika
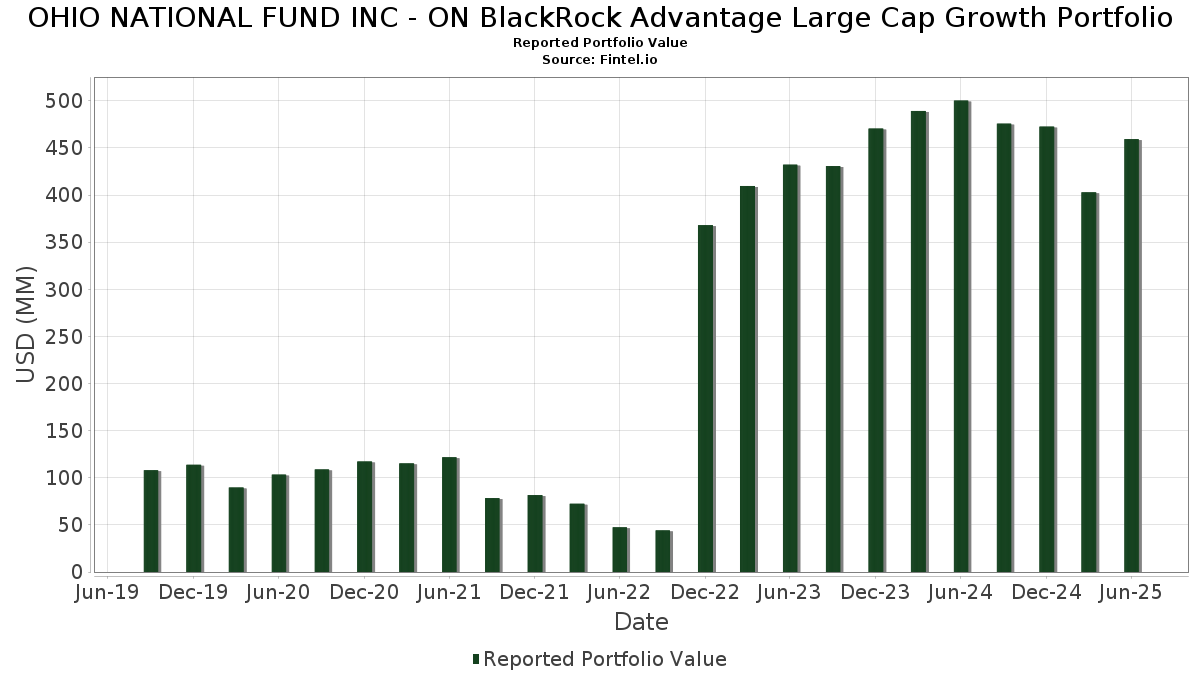
| Nilai Portofolio | $ 459,329,412 |
| Posisi Saat Ini | 87 |
Kepemilikan Terbaru, Kinerja, AUM (dari 13F, 13D)
OHIO NATIONAL FUND INC - ON BlackRock Advantage Large Cap Growth Portfolio telah mengungkapkan total kepemilikan 87 dalam pengajuan SEC terbaru mereka. Nilai portofolio terbaru dihitung sebesar $ 459,329,412 USD. Aset yang Dikelola (AUM) sebenarnya adalah nilai ini ditambah kas (yang tidak diungkapkan). Aset-aset utama OHIO NATIONAL FUND INC - ON BlackRock Advantage Large Cap Growth Portfolio adalah Microsoft Corporation (US:MSFT) , NVIDIA Corporation (US:NVDA) , Apple Inc. (US:AAPL) , Broadcom Inc. (US:AVGO) , and Amazon.com, Inc. (US:AMZN) . Posisi baru OHIO NATIONAL FUND INC - ON BlackRock Advantage Large Cap Growth Portfolio meliputi: General Electric Company (US:GE) , GE Vernova Inc. (US:GEV) , FedEx Corporation (US:FDX) , Howmet Aerospace Inc. (US:HWM) , and Flowserve Corporation (US:FLS) .
Peningkatan Tertinggi Kuartal Ini
Kami menggunakan perubahan dalam alokasi portofolio karena ini adalah metrik yang paling bermakna. Perubahan dapat disebabkan oleh perdagangan atau perubahan harga saham.
| Keamanan | Saham (MM) |
Nilai (Juta Dolar AS) |
Portfolio % | ΔPorsyento ng Portfolio |
|---|---|---|---|---|
| 0.25 | 38.88 | 8.3519 | 1.7176 | |
| 0.11 | 15.66 | 3.3636 | 1.6432 | |
| 0.01 | 15.65 | 3.3611 | 1.5614 | |
| 0.09 | 24.72 | 5.3109 | 1.2772 | |
| 0.05 | 6.29 | 1.3506 | 1.2172 | |
| 0.03 | 5.06 | 1.0859 | 0.8458 | |
| 0.03 | 3.76 | 0.8085 | 0.8085 | |
| 0.01 | 5.65 | 1.2136 | 0.7699 | |
| 0.05 | 4.59 | 0.9863 | 0.7661 | |
| 0.09 | 44.54 | 9.5679 | 0.6796 |
Penurunan Tertinggi Kuartal Ini
Kami menggunakan perubahan dalam alokasi portofolio karena ini adalah metrik yang paling bermakna. Perubahan dapat disebabkan oleh perdagangan atau perubahan harga saham.
| Keamanan | Saham (MM) |
Nilai (Juta Dolar AS) |
Portfolio % | ΔPorsyento ng Portfolio |
|---|---|---|---|---|
| 0.16 | 33.09 | 7.1078 | -2.0582 | |
| 0.02 | 5.61 | 1.2048 | -1.3708 | |
| 0.02 | 17.02 | 3.6572 | -1.2629 | |
| 0.05 | 8.45 | 1.8144 | -0.9877 | |
| 0.01 | 10.28 | 2.2084 | -0.9007 | |
| 0.02 | 2.46 | 0.5293 | -0.6982 | |
| 0.01 | 1.69 | 0.3621 | -0.6950 | |
| 0.01 | 2.43 | 0.5224 | -0.5509 | |
| 0.02 | 5.15 | 1.1059 | -0.4970 | |
| 0.01 | 8.99 | 1.9307 | -0.4669 |
Pengajuan 13F dan Dana
Formulir ini diajukan pada 2025-08-27 untuk periode pelaporan 2025-06-30. Klik ikon tautan untuk melihat riwayat transaksi selengkapnya.
Tingkatkan ke versi premium untuk membuka data premium dan ekspor ke Excel. ![]() .
.
| Keamanan | Ketik | Harga Saham Rata-rata | Saham (MM) |
ΔSaham (%) |
ΔSaham (%) |
Nilai ($MM) |
Portpolyo (%) |
ΔPortofolio (%) |
|
|---|---|---|---|---|---|---|---|---|---|
| MSFT / Microsoft Corporation | 0.09 | -7.91 | 44.54 | 22.02 | 9.5679 | 0.6796 | |||
| NVDA / NVIDIA Corporation | 0.25 | -2.11 | 38.88 | 42.70 | 8.3519 | 1.7176 | |||
| AAPL / Apple Inc. | 0.16 | -4.84 | 33.09 | -12.10 | 7.1078 | -2.0582 | |||
| AVGO / Broadcom Inc. | 0.09 | -9.35 | 24.72 | 49.25 | 5.3109 | 1.2772 | |||
| AMZN / Amazon.com, Inc. | 0.11 | 1.82 | 23.14 | 17.41 | 4.9705 | 0.1718 | |||
| META / Meta Platforms, Inc. | 0.02 | -34.21 | 17.02 | -15.75 | 3.6572 | -1.2629 | |||
| AMD / Advanced Micro Devices, Inc. | 0.11 | 60.46 | 15.66 | 121.63 | 3.3636 | 1.6432 | |||
| NFLX / Netflix, Inc. | 0.01 | 47.41 | 15.65 | 111.69 | 3.3611 | 1.5614 | |||
| TSLA / Tesla, Inc. | 0.04 | -15.13 | 11.73 | 4.03 | 2.5202 | -0.2258 | |||
| GOOGL / Alphabet Inc. | 0.06 | 28.30 | 11.14 | 46.21 | 2.3939 | 0.5381 | |||
| LLY / Eli Lilly and Company | 0.01 | -14.70 | 10.28 | -19.49 | 2.2084 | -0.9007 | |||
| CRM / Salesforce, Inc. | 0.03 | 60.43 | 9.02 | 63.01 | 1.9369 | 0.5901 | |||
| COST / Costco Wholesale Corporation | 0.01 | -12.79 | 8.99 | -8.72 | 1.9307 | -0.4669 | |||
| GOOG / Alphabet Inc. | 0.05 | -35.36 | 8.45 | -26.60 | 1.8144 | -0.9877 | |||
| NOW / ServiceNow, Inc. | 0.01 | 0.14 | 7.50 | 29.31 | 1.6122 | 0.1990 | |||
| DELL / Dell Technologies Inc. | 0.05 | 830.71 | 6.29 | 891.64 | 1.3506 | 1.2172 | |||
| BKNG / Booking Holdings Inc. | 0.00 | -33.38 | 6.08 | -16.28 | 1.3058 | -0.4621 | |||
| HD / The Home Depot, Inc. | 0.02 | -3.80 | 6.04 | -3.76 | 1.2973 | -0.2307 | |||
| MA / Mastercard Incorporated | 0.01 | -6.69 | 5.95 | -4.34 | 1.2773 | -0.2362 | |||
| ORCL / Oracle Corporation | 0.03 | 32.00 | 5.71 | 106.44 | 1.2264 | 0.5529 | |||
| INTU / Intuit Inc. | 0.01 | 141.68 | 5.65 | 210.04 | 1.2136 | 0.7699 | |||
| V / Visa Inc. | 0.02 | -47.66 | 5.61 | -46.98 | 1.2048 | -1.3708 | |||
| CTAS / Cintas Corporation | 0.02 | -27.88 | 5.15 | -21.79 | 1.1059 | -0.4970 | |||
| ABBV / AbbVie Inc. | 0.03 | 478.59 | 5.06 | 412.68 | 1.0859 | 0.8458 | |||
| WMT / Walmart Inc. | 0.05 | 45.63 | 4.94 | 62.19 | 1.0607 | 0.3194 | |||
| PLTR / Palantir Technologies Inc. | 0.03 | 16.02 | 4.71 | 87.45 | 1.0107 | 0.3993 | |||
| LRCX / Lam Research Corporation | 0.05 | -21.92 | 4.68 | 4.55 | 1.0060 | -0.0848 | |||
| ADBE / Adobe Inc. | 0.01 | 0.00 | 4.61 | 0.87 | 0.9911 | -0.1226 | |||
| SCHW / The Charles Schwab Corporation | 0.05 | 335.75 | 4.59 | 408.42 | 0.9863 | 0.7661 | |||
| BX / Blackstone Inc. | 0.03 | 3.76 | 0.8085 | 0.8085 | |||||
| UBER / Uber Technologies, Inc. | 0.04 | 0.00 | 3.65 | 28.04 | 0.7837 | 0.0900 | |||
| PH / Parker-Hannifin Corporation | 0.01 | -21.30 | 3.58 | -9.59 | 0.7699 | -0.1951 | |||
| FTNT / Fortinet, Inc. | 0.03 | -20.57 | 3.34 | -12.76 | 0.7179 | -0.2150 | |||
| SPOT / Spotify Technology S.A. | 0.00 | 280.70 | 3.25 | 553.41 | 0.6991 | 0.5943 | |||
| QCOM / QUALCOMM Incorporated | 0.02 | -26.39 | 3.21 | -23.69 | 0.6886 | -0.3341 | |||
| APH / Amphenol Corporation | 0.03 | -46.97 | 3.06 | -20.15 | 0.6583 | -0.2763 | |||
| SPGI / S&P Global Inc. | 0.01 | -22.16 | 3.02 | -19.22 | 0.6484 | -0.2615 | |||
| MS / Morgan Stanley | 0.02 | 65.43 | 3.00 | 99.73 | 0.6455 | 0.2792 | |||
| RL / Ralph Lauren Corporation | 0.01 | 1,490.52 | 2.85 | 5,087.27 | 0.6129 | 0.4874 | |||
| BMY / Bristol-Myers Squibb Company | 0.06 | 180.01 | 2.83 | 152.82 | 0.6077 | 0.3718 | |||
| MCO / Moody's Corporation | 0.01 | 0.00 | 2.81 | 7.71 | 0.6034 | -0.0316 | |||
| FIX / Comfort Systems USA, Inc. | 0.01 | -15.19 | 2.78 | 41.10 | 0.5982 | 0.1176 | |||
| GE / General Electric Company | 0.01 | 2.78 | 0.5979 | 0.5979 | |||||
| CAH / Cardinal Health, Inc. | 0.02 | 121.52 | 2.61 | 214.61 | 0.5598 | 0.3858 | |||
| MRVL / Marvell Technology, Inc. | 0.03 | 52.32 | 2.57 | 91.43 | 0.5521 | 0.2253 | |||
| TJX / The TJX Companies, Inc. | 0.02 | -51.79 | 2.46 | -51.12 | 0.5293 | -0.6982 | |||
| PGR / The Progressive Corporation | 0.01 | -41.49 | 2.43 | -44.84 | 0.5224 | -0.5509 | |||
| FLEX / Flex Ltd. | 0.05 | 215.16 | 2.42 | 375.59 | 0.5191 | 0.3954 | |||
| REGN / Regeneron Pharmaceuticals, Inc. | 0.00 | 158.78 | 2.40 | 89.20 | 0.5154 | 0.2252 | |||
| MSI / Motorola Solutions, Inc. | 0.01 | -37.59 | 2.23 | -40.06 | 0.4795 | -0.4274 | |||
| GDDY / GoDaddy Inc. | 0.01 | 2,782.35 | 2.03 | 5,867.65 | 0.4359 | 0.4079 | |||
| TRGP / Targa Resources Corp. | 0.01 | 257.49 | 2.02 | 210.77 | 0.4339 | 0.2755 | |||
| BSX / Boston Scientific Corporation | 0.02 | 0.00 | 2.01 | 6.46 | 0.4323 | -0.0279 | |||
| MELI / MercadoLibre, Inc. | 0.00 | -30.53 | 2.00 | -6.92 | 0.4306 | -0.0938 | |||
| GRMN / Garmin Ltd. | 0.01 | 126.04 | 1.99 | 117.38 | 0.4273 | 0.2044 | |||
| ESTC / Elastic N.V. | 0.02 | 258.96 | 1.98 | 239.97 | 0.4258 | 0.2837 | |||
| NTAP / NetApp, Inc. | 0.02 | 37.29 | 1.91 | 66.64 | 0.4110 | 0.1313 | |||
| GEV / GE Vernova Inc. | 0.00 | 1.71 | 0.3668 | 0.3668 | |||||
| DASH / DoorDash, Inc. | 0.01 | -71.21 | 1.69 | -61.18 | 0.3621 | -0.6950 | |||
| FDX / FedEx Corporation | 0.01 | 1.67 | 0.3580 | 0.3580 | |||||
| TXN / Texas Instruments Incorporated | 0.01 | 2.34 | 1.53 | 28.63 | 0.3291 | 0.0105 | |||
| ABNB / Airbnb, Inc. | 0.01 | 0.00 | 1.42 | 10.79 | 0.3044 | -0.0071 | |||
| FICO / Fair Isaac Corporation | 0.00 | 0.00 | 1.35 | -0.88 | 0.2890 | -0.0415 | |||
| TEAM / Atlassian Corporation | 0.01 | 81.45 | 1.28 | 73.71 | 0.2740 | 0.0951 | |||
| HWM / Howmet Aerospace Inc. | 0.01 | 1.22 | 0.2625 | 0.2625 | |||||
| CPNG / Coupang, Inc. | 0.04 | 1.20 | 0.2587 | 0.2587 | |||||
| ANET / Arista Networks Inc | 0.01 | 0.00 | 1.15 | 32.07 | 0.2478 | 0.0351 | |||
| CDNS / Cadence Design Systems, Inc. | 0.00 | -47.32 | 1.14 | -36.16 | 0.2439 | -0.1892 | |||
| PANW / Palo Alto Networks, Inc. | 0.01 | -52.99 | 1.08 | -43.66 | 0.2319 | -0.2344 | |||
| TMO / Thermo Fisher Scientific Inc. | 0.00 | -28.33 | 1.04 | -41.58 | 0.2237 | -0.2105 | |||
| VEEV / Veeva Systems Inc. | 0.00 | -61.69 | 0.99 | -40.00 | 0.2121 | 0.2121 | |||
| WCN / Waste Connections, Inc. | 0.00 | 443.58 | 0.92 | 645.16 | 0.1986 | 0.0465 | |||
| GILD / Gilead Sciences, Inc. | 0.01 | 0.00 | 0.92 | -1.08 | 0.1969 | -0.0287 | |||
| MTZ / MasTec, Inc. | 0.01 | 0.00 | 0.91 | 45.89 | 0.1948 | 0.0436 | |||
| AXP / American Express Company | 0.00 | 0.00 | 0.86 | 18.68 | 0.1856 | 0.0082 | |||
| COR / Cencora, Inc. | 0.00 | -81.05 | 0.77 | -65.75 | 0.1656 | -0.4358 | |||
| FLS / Flowserve Corporation | 0.01 | 0.72 | 0.1545 | 0.1545 | |||||
| ORLY / O'Reilly Automotive, Inc. | 0.01 | 541.64 | 0.71 | -45.27 | 0.1531 | -0.1051 | |||
| MDT / Medtronic plc | 0.01 | -53.55 | 0.70 | -50.84 | 0.1502 | -0.1494 | |||
| NTRA / Natera, Inc. | 0.00 | 0.00 | 0.68 | 19.61 | 0.1467 | 0.0075 | |||
| WDAY / Workday, Inc. | 0.00 | -18.55 | 0.66 | -24.28 | 0.1415 | -0.0412 | |||
| EQIX / Equinix, Inc. | 0.00 | -62.43 | 0.60 | -60.54 | 0.1297 | -0.1735 | |||
| RMBS / Rambus Inc. | 0.01 | 0.00 | 0.60 | 23.81 | 0.1285 | 0.0107 | |||
| ZS / Zscaler, Inc. | 0.00 | 0.58 | 0.1252 | 0.1252 | |||||
| DRI / Darden Restaurants, Inc. | 0.00 | 0.57 | 0.1223 | 0.1223 | |||||
| PM / Philip Morris International Inc. | 0.00 | 0.52 | 0.1113 | 0.1113 | |||||
| NASDAQ 100 E-MINI SEP25 XCME 20250919 / DE (000000000) | 0.27 | 0.0579 | 0.0579 | ||||||
| IRM / Iron Mountain Incorporated | 0.00 | -100.00 | 0.00 | -100.00 | -0.1312 | ||||
| SAIL / SailPoint, Inc. | 0.00 | -100.00 | 0.00 | -100.00 | -0.0262 |