Mga Batayang Estadistika
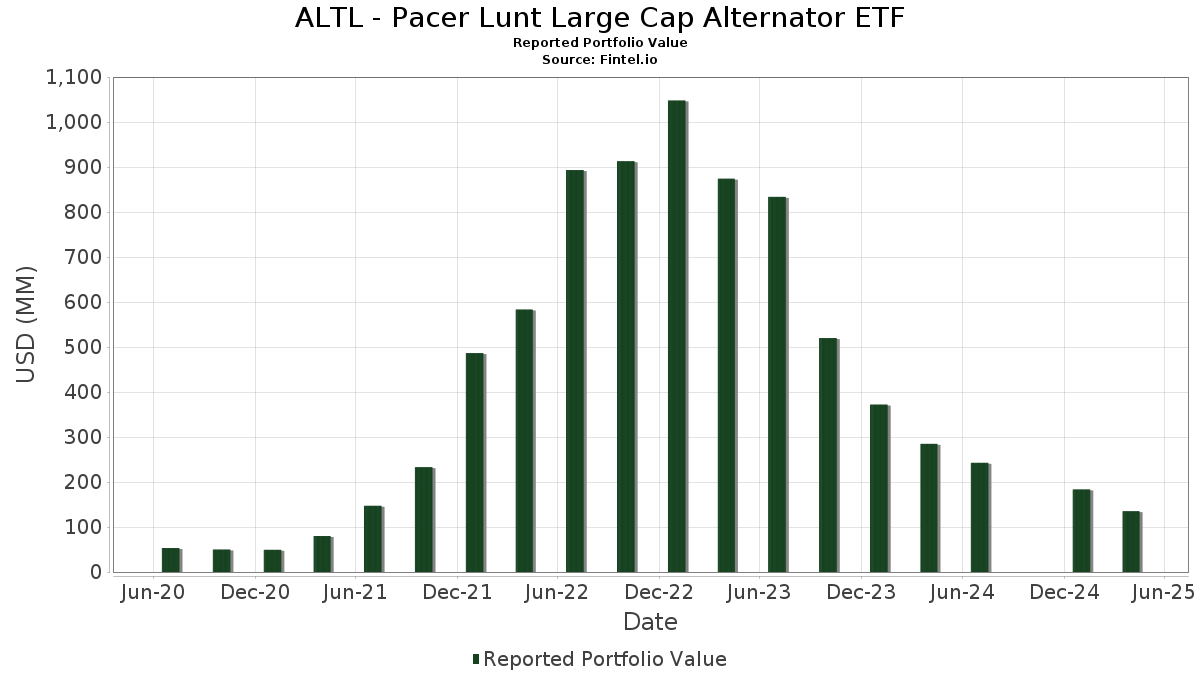
| Nilai Portofolio | $ 135,038,675 |
| Posisi Saat Ini | 102 |
Kepemilikan Terbaru, Kinerja, AUM (dari 13F, 13D)
ALTL - Pacer Lunt Large Cap Alternator ETF telah mengungkapkan total kepemilikan 102 dalam pengajuan SEC terbaru mereka. Nilai portofolio terbaru dihitung sebesar $ 135,038,675 USD. Aset yang Dikelola (AUM) sebenarnya adalah nilai ini ditambah kas (yang tidak diungkapkan). Aset-aset utama ALTL - Pacer Lunt Large Cap Alternator ETF adalah The Coca-Cola Company (US:KO) , Berkshire Hathaway Inc. (US:BRK.B) , Republic Services, Inc. (US:RSG) , Marsh & McLennan Companies, Inc. (US:MMC) , and Atmos Energy Corporation (US:ATO) . Posisi baru ALTL - Pacer Lunt Large Cap Alternator ETF meliputi: Regency Centers Corporation (US:REG) , Exxon Mobil Corporation (US:XOM) , Veralto Corporation (US:VLTO) , Stryker Corporation (IT:1SYK) , and BlackRock, Inc. (US:BLK) .
Peningkatan Tertinggi Kuartal Ini
Kami menggunakan perubahan dalam alokasi portofolio karena ini adalah metrik yang paling bermakna. Perubahan dapat disebabkan oleh perdagangan atau perubahan harga saham.
| Keamanan | Saham (MM) |
Nilai (Juta Dolar AS) |
Portfolio % | ΔPorsyento ng Portfolio |
|---|---|---|---|---|
| 5.91 | 5.91 | 4.5724 | 4.5724 | |
| 0.02 | 1.77 | 1.3715 | 1.3715 | |
| 0.02 | 1.52 | 1.1773 | 1.1773 | |
| 0.01 | 1.35 | 1.0461 | 1.0461 | |
| 0.03 | 1.35 | 1.0455 | 1.0455 | |
| 0.01 | 1.32 | 1.0242 | 1.0242 | |
| 0.01 | 1.31 | 1.0129 | 1.0129 | |
| 0.01 | 1.29 | 0.9954 | 0.9954 | |
| 0.01 | 1.28 | 0.9901 | 0.9901 | |
| 0.04 | 1.26 | 0.9781 | 0.9781 |
Penurunan Tertinggi Kuartal Ini
Kami menggunakan perubahan dalam alokasi portofolio karena ini adalah metrik yang paling bermakna. Perubahan dapat disebabkan oleh perdagangan atau perubahan harga saham.
| Keamanan | Saham (MM) |
Nilai (Juta Dolar AS) |
Portfolio % | ΔPorsyento ng Portfolio |
|---|---|---|---|---|
| 0.00 | 0.00 | -2.8003 | ||
| 0.00 | 0.00 | -2.3175 | ||
| 0.00 | 0.00 | -1.5183 | ||
| 0.00 | 0.00 | -1.4460 | ||
| 0.00 | 0.00 | -1.3748 | ||
| 0.00 | 0.00 | -1.0689 | ||
| 0.00 | 0.00 | -1.0532 | ||
| 0.00 | 0.00 | -0.9718 | ||
| 0.00 | 0.00 | -0.8885 | ||
| 0.00 | 0.00 | -0.8488 |
Pengajuan 13F dan Dana
Formulir ini diajukan pada 2025-06-30 untuk periode pelaporan 2025-04-30. Klik ikon tautan untuk melihat riwayat transaksi selengkapnya.
Tingkatkan ke versi premium untuk membuka data premium dan ekspor ke Excel. ![]() .
.
| Keamanan | Ketik | Harga Saham Rata-rata | Saham (MM) |
ΔSaham (%) |
ΔSaham (%) |
Nilai ($MM) |
Portpolyo (%) |
ΔPortofolio (%) |
|
|---|---|---|---|---|---|---|---|---|---|
| Mount Vernon Liquid Assets Portfolio, LLC / STIV (N/A) | 5.91 | 5.91 | 4.5724 | 4.5724 | |||||
| KO / The Coca-Cola Company | 0.02 | 1.77 | 1.3715 | 1.3715 | |||||
| BRK.B / Berkshire Hathaway Inc. | 0.00 | -56.96 | 1.75 | -47.66 | 1.3520 | -0.1050 | |||
| RSG / Republic Services, Inc. | 0.01 | -58.32 | 1.70 | -46.22 | 1.3156 | -0.0641 | |||
| MMC / Marsh & McLennan Companies, Inc. | 0.01 | -43.44 | 1.63 | -42.73 | 1.2596 | 0.0197 | |||
| ATO / Atmos Energy Corporation | 0.01 | -45.91 | 1.61 | -32.06 | 1.2492 | 0.2123 | |||
| ED / Consolidated Edison, Inc. | 0.01 | -37.82 | 1.56 | -28.10 | 1.2063 | 0.2600 | |||
| FE / FirstEnergy Corp. | 0.04 | -28.68 | 1.54 | -27.04 | 1.1950 | 0.2714 | |||
| CME / CME Group Inc. | 0.01 | -46.63 | 1.53 | -23.66 | 1.1843 | 0.3093 | |||
| EVRG / Evergy, Inc. | 0.02 | 1.52 | 1.1773 | 1.1773 | |||||
| LIN / Linde plc | 0.00 | -38.55 | 1.51 | -38.59 | 1.1709 | 0.0957 | |||
| CL / Colgate-Palmolive Company | 0.02 | -43.84 | 1.49 | -47.82 | 1.1563 | -0.0932 | |||
| COR / Cencora, Inc. | 0.01 | -54.89 | 1.49 | -44.51 | 1.1538 | -0.0188 | |||
| VRSN / VeriSign, Inc. | 0.01 | -57.89 | 1.48 | -36.48 | 1.1449 | 0.1286 | |||
| CMS / CMS Energy Corporation | 0.02 | -37.12 | 1.47 | -28.54 | 1.1401 | 0.2404 | |||
| PPL / PPL Corporation | 0.04 | -45.98 | 1.47 | -33.66 | 1.1368 | 0.1705 | |||
| DUK / Duke Energy Corporation | 0.01 | -44.87 | 1.44 | -38.46 | 1.1178 | 0.0937 | |||
| PG / The Procter & Gamble Company | 0.01 | -45.47 | 1.44 | -44.85 | 1.1157 | -0.0254 | |||
| ADP / Automatic Data Processing, Inc. | 0.00 | -43.28 | 1.44 | -35.08 | 1.1152 | 0.1464 | |||
| MDLZ / Mondelez International, Inc. | 0.02 | -33.83 | 1.43 | -34.04 | 1.1073 | 0.1605 | |||
| WEC / WEC Energy Group, Inc. | 0.01 | -44.04 | 1.41 | -28.77 | 1.0950 | 0.2279 | |||
| KDP / Keurig Dr Pepper Inc. | 0.04 | -32.65 | 1.41 | -32.03 | 1.0926 | 0.1858 | |||
| YUM / Yum! Brands, Inc. | 0.01 | -46.11 | 1.41 | -38.96 | 1.0919 | 0.0829 | |||
| JNJ / Johnson & Johnson | 0.01 | -46.88 | 1.41 | -47.38 | 1.0894 | -0.0785 | |||
| NI / NiSource Inc. | 0.04 | -46.45 | 1.41 | -33.00 | 1.0884 | 0.1725 | |||
| TJX / The TJX Companies, Inc. | 0.01 | -56.35 | 1.39 | -50.32 | 1.0750 | -0.1451 | |||
| O / Realty Income Corporation | 0.02 | -32.03 | 1.38 | -31.55 | 1.0703 | 0.1888 | |||
| GD / General Dynamics Corporation | 0.01 | -31.54 | 1.37 | -37.64 | 1.0626 | 0.1016 | |||
| L / Loews Corporation | 0.02 | -52.91 | 1.37 | -48.86 | 1.0618 | -0.1091 | |||
| ICE / Intercontinental Exchange, Inc. | 0.01 | -53.15 | 1.37 | -48.09 | 1.0609 | -0.0915 | |||
| DTE / DTE Energy Company | 0.01 | -42.10 | 1.36 | -34.22 | 1.0529 | 0.1506 | |||
| CB / Chubb Limited | 0.00 | -45.88 | 1.36 | -43.85 | 1.0494 | -0.0044 | |||
| SO / The Southern Company | 0.01 | -45.55 | 1.35 | -40.08 | 1.0475 | 0.0613 | |||
| PNW / Pinnacle West Capital Corporation | 0.01 | 1.35 | 1.0461 | 1.0461 | |||||
| EXC / Exelon Corporation | 0.03 | 1.35 | 1.0455 | 1.0455 | |||||
| ITW / Illinois Tool Works Inc. | 0.01 | -36.91 | 1.35 | -38.81 | 1.0442 | 0.0821 | |||
| BRO / Brown & Brown, Inc. | 0.01 | -50.86 | 1.34 | -45.35 | 1.0341 | -0.0329 | |||
| MO / Altria Group, Inc. | 0.02 | -51.00 | 1.33 | -40.86 | 1.0323 | 0.0478 | |||
| MCD / McDonald's Corporation | 0.00 | -57.96 | 1.33 | -49.37 | 1.0275 | -0.1171 | |||
| MA / Mastercard Incorporated | 0.00 | -53.28 | 1.32 | -44.76 | 1.0243 | -0.0219 | |||
| JKHY / Jack Henry & Associates, Inc. | 0.01 | 1.32 | 1.0242 | 1.0242 | |||||
| NOC / Northrop Grumman Corporation | 0.00 | -75.95 | 1.32 | -68.37 | 1.0192 | 0.1039 | |||
| V / Visa Inc. | 0.00 | -59.52 | 1.32 | -47.36 | 1.0191 | -0.0728 | |||
| AEE / Ameren Corporation | 0.01 | 1.31 | 1.0129 | 1.0129 | |||||
| SPGI / S&P Global Inc. | 0.00 | -41.78 | 1.31 | -39.97 | 1.0108 | 0.0616 | |||
| HON / Honeywell International Inc. | 0.01 | -47.06 | 1.29 | -45.58 | 1.0022 | -0.0364 | |||
| ORLY / O'Reilly Automotive, Inc. | 0.00 | -57.60 | 1.29 | -40.80 | 0.9992 | 0.1555 | |||
| AEP / American Electric Power Company, Inc. | 0.01 | 1.29 | 0.9954 | 0.9954 | |||||
| AJG / Arthur J. Gallagher & Co. | 0.00 | -55.12 | 1.28 | -49.25 | 0.9924 | -0.1099 | |||
| KMB / Kimberly-Clark Corporation | 0.01 | -43.80 | 1.28 | -45.18 | 0.9917 | -0.0282 | |||
| BSX / Boston Scientific Corporation | 0.01 | 1.28 | 0.9901 | 0.9901 | |||||
| LHX / L3Harris Technologies, Inc. | 0.01 | -73.67 | 1.28 | -75.06 | 0.9880 | 0.0651 | |||
| LNT / Alliant Energy Corporation | 0.02 | -46.85 | 1.26 | -41.75 | 0.9792 | 0.0318 | |||
| VICI / VICI Properties Inc. | 0.04 | 1.26 | 0.9781 | 0.9781 | |||||
| REG / Regency Centers Corporation | 0.02 | 1.26 | 0.9761 | 0.9761 | |||||
| CHD / Church & Dwight Co., Inc. | 0.01 | -39.62 | 1.26 | -38.83 | 0.9761 | 0.0765 | |||
| LMT / Lockheed Martin Corporation | 0.00 | -44.25 | 1.26 | -50.86 | 0.9750 | -0.1438 | |||
| WELL / Welltower Inc. | 0.01 | 1.25 | 0.9673 | 0.9673 | |||||
| VZ / Verizon Communications Inc. | 0.03 | 1.25 | 0.9671 | 0.9671 | |||||
| RTX / RTX Corporation | 0.01 | -86.93 | 1.25 | -82.31 | 0.9648 | 0.0713 | |||
| PEP / PepsiCo, Inc. | 0.01 | -29.81 | 1.24 | -44.91 | 0.9637 | -0.0225 | |||
| BR / Broadridge Financial Solutions, Inc. | 0.01 | -53.28 | 1.24 | -47.10 | 0.9612 | -0.0633 | |||
| FIS / Fidelity National Information Services, Inc. | 0.02 | 1.24 | 0.9599 | 0.9599 | |||||
| WTW / Willis Towers Watson Public Limited Company | 0.00 | 1.24 | 0.9572 | 0.9572 | |||||
| OTIS / Otis Worldwide Corporation | 0.01 | -45.50 | 1.23 | -44.49 | 0.9558 | -0.0151 | |||
| MSI / Motorola Solutions, Inc. | 0.00 | -54.50 | 1.23 | -49.80 | 0.9506 | -0.1168 | |||
| SYY / Sysco Corporation | 0.02 | -40.30 | 1.22 | -44.40 | 0.9417 | -0.0133 | |||
| WM / Waste Management, Inc. | 0.01 | -56.61 | 1.22 | -50.04 | 0.9416 | -0.1214 | |||
| PAYX / Paychex, Inc. | 0.01 | -49.90 | 1.21 | -42.44 | 0.9378 | 0.0191 | |||
| ROP / Roper Technologies, Inc. | 0.00 | -56.55 | 1.21 | -55.34 | 0.9331 | -0.2450 | |||
| WMT / Walmart Inc. | 0.01 | -70.02 | 1.20 | -57.55 | 0.9297 | -0.3047 | |||
| ABT / Abbott Laboratories | 0.01 | -54.59 | 1.19 | -43.99 | 0.9242 | -0.0059 | |||
| AVB / AvalonBay Communities, Inc. | 0.01 | 1.19 | 0.9206 | 0.9206 | |||||
| VRSK / Verisk Analytics, Inc. | 0.00 | -53.24 | 1.18 | -47.06 | 0.9132 | -0.0593 | |||
| BDX / Becton, Dickinson and Company | 0.01 | -41.82 | 1.18 | -48.67 | 0.9110 | 0.0240 | |||
| TMUS / T-Mobile US, Inc. | 0.00 | -67.36 | 1.18 | -55.81 | 0.9102 | -0.2508 | |||
| HOLX / Hologic, Inc. | 0.02 | -23.30 | 1.17 | -45.33 | 0.9064 | -0.0282 | |||
| NDAQ / Nasdaq, Inc. | 0.02 | -68.67 | 1.17 | -86.81 | 0.9041 | -0.2182 | |||
| XOM / Exxon Mobil Corporation | 0.01 | 1.17 | 0.9028 | 0.9028 | |||||
| UDR / UDR, Inc. | 0.03 | -81.35 | 1.16 | -83.87 | 0.8956 | -0.0134 | |||
| GIS / General Mills, Inc. | 0.02 | -32.04 | 1.15 | -42.55 | 0.8929 | 0.0161 | |||
| VLTO / Veralto Corporation | 0.01 | 1.15 | 0.8918 | 0.8918 | |||||
| EXPD / Expeditors International of Washington, Inc. | 0.01 | -69.25 | 1.15 | -70.48 | 0.8882 | 0.0333 | |||
| 1SYK / Stryker Corporation | 0.00 | 1.14 | 0.8855 | 0.8855 | |||||
| AVY / Avery Dennison Corporation | 0.01 | -23.86 | 1.14 | -39.93 | 0.8846 | 0.0543 | |||
| MDT / Medtronic plc | 0.01 | -46.09 | 1.13 | -43.10 | 0.8783 | 0.0076 | |||
| BLK / BlackRock, Inc. | 0.00 | 1.13 | 0.8734 | 0.8734 | |||||
| ECL / Ecolab Inc. | 0.00 | -48.88 | 1.13 | -44.32 | 0.8732 | -0.0108 | |||
| CSCO / Cisco Systems, Inc. | 0.02 | -53.61 | 1.13 | -44.75 | 0.8732 | -0.0177 | |||
| COST / Costco Wholesale Corporation | 0.00 | -58.56 | 1.12 | -49.89 | 0.8708 | -0.1087 | |||
| PPG / PPG Industries, Inc. | 0.01 | -41.59 | 1.12 | -54.93 | 0.8673 | 0.1009 | |||
| BK / The Bank of New York Mellon Corporation | 0.01 | 1.12 | 0.8639 | 0.8639 | |||||
| AON / Aon plc | 0.00 | -61.03 | 1.07 | -50.96 | 0.8270 | -0.0164 | |||
| AIZ / Assurant, Inc. | 0.01 | -87.06 | 1.06 | -85.82 | 0.8204 | -0.1270 | |||
| FRT / Federal Realty Investment Trust | 0.01 | 1.05 | 0.8167 | 0.8167 | |||||
| CVX / Chevron Corporation | 0.01 | 1.04 | 0.8037 | 0.8037 | |||||
| FI / Fiserv, Inc. | 0.01 | -62.69 | 1.01 | -57.92 | 0.7840 | -0.2662 | |||
| HLT / Hilton Worldwide Holdings Inc. | 0.00 | 1.00 | 0.7772 | 0.7772 | |||||
| UNP / Union Pacific Corporation | 0.00 | -40.99 | 1.00 | -48.42 | 0.7714 | -0.0721 | |||
| CTSH / Cognizant Technology Solutions Corporation | 0.01 | 0.95 | 0.7359 | 0.7359 | |||||
| LYB / LyondellBasell Industries N.V. | 0.02 | 0.90 | 0.7001 | 0.7001 | |||||
| U.S. Bank Money Market Deposit Account / STIV (8AMMF0A84) | 0.11 | 213.93 | 0.11 | 214.71 | 0.0831 | 0.0622 | |||
| IR / Ingersoll Rand Inc. | 0.00 | -100.00 | 0.00 | -100.00 | -0.7039 | ||||
| CARR / Carrier Global Corporation | 0.00 | -100.00 | 0.00 | -100.00 | -0.7012 | ||||
| PANW / Palo Alto Networks, Inc. | 0.00 | -100.00 | 0.00 | -100.00 | -0.7576 | ||||
| BXP / Boston Properties, Inc. | 0.00 | -100.00 | 0.00 | -100.00 | -0.7937 | ||||
| FSLR / First Solar, Inc. | 0.00 | -100.00 | 0.00 | -100.00 | -0.8488 | ||||
| VST / Vistra Corp. | 0.00 | -100.00 | 0.00 | -100.00 | -1.5183 | ||||
| CAT / Caterpillar Inc. | 0.00 | -100.00 | 0.00 | -100.00 | -0.6723 | ||||
| DECK / Deckers Outdoor Corporation | 0.00 | -100.00 | 0.00 | -100.00 | -1.0532 | ||||
| UBER / Uber Technologies, Inc. | 0.00 | -100.00 | 0.00 | -100.00 | -0.8885 | ||||
| DELL / Dell Technologies Inc. | 0.00 | -100.00 | 0.00 | -100.00 | -0.9718 | ||||
| SMCI / Super Micro Computer, Inc. | 0.00 | -100.00 | 0.00 | -100.00 | -2.8003 | ||||
| PLTR / Palantir Technologies Inc. | 0.00 | -100.00 | 0.00 | -100.00 | -2.3175 | ||||
| NVDA / NVIDIA Corporation | 0.00 | -100.00 | 0.00 | -100.00 | -1.4460 | ||||
| NCLH / Norwegian Cruise Line Holdings Ltd. | 0.00 | -100.00 | 0.00 | -100.00 | -1.0689 | ||||
| CRWD / CrowdStrike Holdings, Inc. | 0.00 | -100.00 | 0.00 | -100.00 | -1.3748 | ||||
| LW / Lamb Weston Holdings, Inc. | 0.00 | -100.00 | 0.00 | -100.00 | -0.5722 | ||||
| TECH / Bio-Techne Corporation | 0.00 | -100.00 | 0.00 | -100.00 | -0.7394 | ||||
| MHK / Mohawk Industries, Inc. | 0.00 | -100.00 | 0.00 | -100.00 | -0.6658 | ||||
| HUBB / Hubbell Incorporated | 0.00 | -100.00 | 0.00 | -100.00 | -0.7707 |