Mga Batayang Estadistika
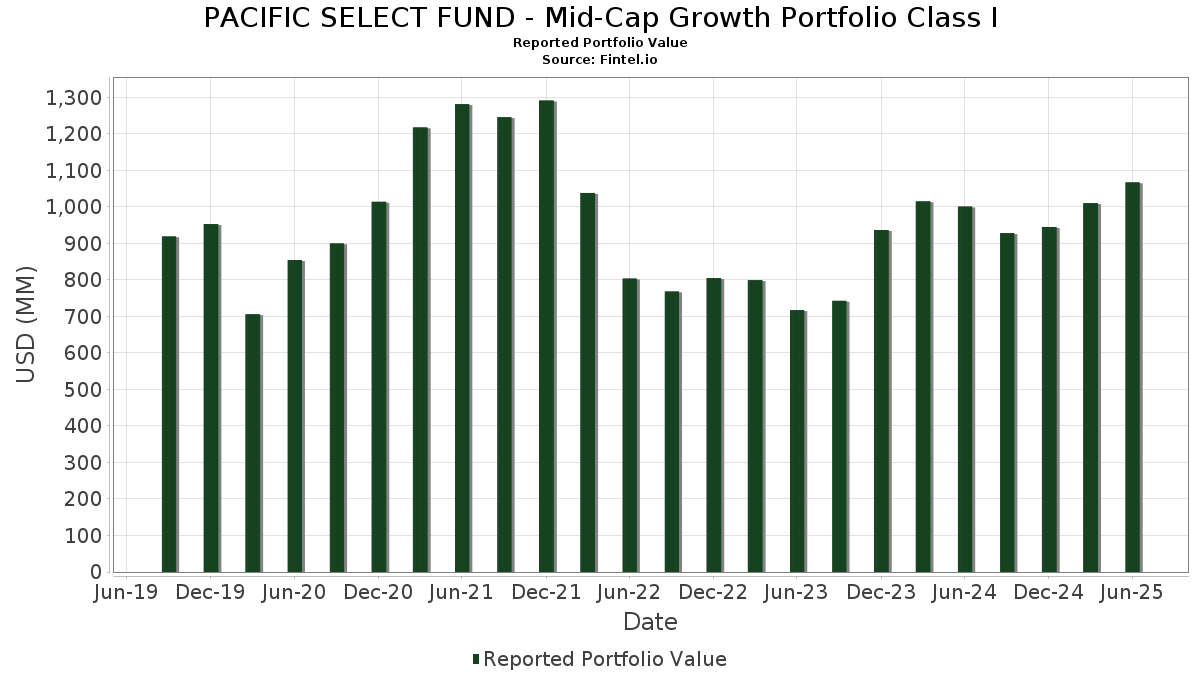
| Nilai Portofolio | $ 1,067,222,098 |
| Posisi Saat Ini | 125 |
Kepemilikan Terbaru, Kinerja, AUM (dari 13F, 13D)
PACIFIC SELECT FUND - Mid-Cap Growth Portfolio Class I telah mengungkapkan total kepemilikan 125 dalam pengajuan SEC terbaru mereka. Nilai portofolio terbaru dihitung sebesar $ 1,067,222,098 USD. Aset yang Dikelola (AUM) sebenarnya adalah nilai ini ditambah kas (yang tidak diungkapkan). Aset-aset utama PACIFIC SELECT FUND - Mid-Cap Growth Portfolio Class I adalah Palantir Technologies Inc. (US:PLTR) , Zscaler, Inc. (US:ZS) , Ameriprise Financial, Inc. (US:AMP) , Roblox Corporation (US:RBLX) , and DexCom, Inc. (US:DXCM) . Posisi baru PACIFIC SELECT FUND - Mid-Cap Growth Portfolio Class I meliputi: Palantir Technologies Inc. (US:PLTR) , Zscaler, Inc. (US:ZS) , Ameriprise Financial, Inc. (US:AMP) , Roblox Corporation (US:RBLX) , and Allison Transmission Holdings, Inc. (US:ALSN) .
Peningkatan Tertinggi Kuartal Ini
Kami menggunakan perubahan dalam alokasi portofolio karena ini adalah metrik yang paling bermakna. Perubahan dapat disebabkan oleh perdagangan atau perubahan harga saham.
| Keamanan | Saham (MM) |
Nilai (Juta Dolar AS) |
Portfolio % | ΔPorsyento ng Portfolio |
|---|---|---|---|---|
| 0.60 | 81.28 | 7.6902 | 7.6902 | |
| 0.12 | 38.08 | 3.6033 | 3.6033 | |
| 0.07 | 37.25 | 3.5240 | 3.5240 | |
| 0.29 | 30.33 | 2.8696 | 2.8696 | |
| 0.22 | 21.09 | 1.9957 | 1.9957 | |
| 0.04 | 20.71 | 1.9592 | 1.9592 | |
| 0.45 | 19.96 | 1.8882 | 1.8882 | |
| 0.19 | 19.22 | 1.8187 | 1.8187 | |
| 0.31 | 17.14 | 1.6213 | 1.6213 | |
| 0.30 | 16.98 | 1.6064 | 1.6064 |
Penurunan Tertinggi Kuartal Ini
Kami menggunakan perubahan dalam alokasi portofolio karena ini adalah metrik yang paling bermakna. Perubahan dapat disebabkan oleh perdagangan atau perubahan harga saham.
| Keamanan | Saham (MM) |
Nilai (Juta Dolar AS) |
Portfolio % | ΔPorsyento ng Portfolio |
|---|---|---|---|---|
| 0.00 | 0.58 | 0.0552 | -1.7717 | |
| 0.04 | 1.99 | 0.1883 | -1.6226 | |
| 0.04 | 6.70 | 0.6340 | -1.4216 | |
| 0.11 | 5.95 | 0.5631 | -1.4031 | |
| 0.03 | 9.12 | 0.8625 | -1.3211 | |
| 0.02 | 2.24 | 0.2115 | -1.0503 | |
| 0.03 | 0.97 | 0.0915 | -0.9465 | |
| 0.06 | 17.35 | 1.6416 | -0.8919 | |
| 0.02 | 2.27 | 0.2150 | -0.7397 | |
| 0.19 | 2.85 | 0.2700 | -0.7187 |
Pengajuan 13F dan Dana
Formulir ini diajukan pada 2025-08-18 untuk periode pelaporan 2025-06-30. Klik ikon tautan untuk melihat riwayat transaksi selengkapnya.
Tingkatkan ke versi premium untuk membuka data premium dan ekspor ke Excel. ![]() .
.
| Keamanan | Ketik | Harga Saham Rata-rata | Saham (MM) |
ΔSaham (%) |
ΔSaham (%) |
Nilai ($MM) |
Portpolyo (%) |
ΔPortofolio (%) |
|
|---|---|---|---|---|---|---|---|---|---|
| PLTR / Palantir Technologies Inc. | 0.60 | 81.28 | 7.6902 | 7.6902 | |||||
| ZS / Zscaler, Inc. | 0.12 | 38.08 | 3.6033 | 3.6033 | |||||
| AMP / Ameriprise Financial, Inc. | 0.07 | 37.25 | 3.5240 | 3.5240 | |||||
| RBLX / Roblox Corporation | 0.29 | 30.33 | 2.8696 | 2.8696 | |||||
| DXCM / DexCom, Inc. | 0.31 | 112.49 | 26.70 | 176.69 | 2.5265 | 1.4862 | |||
| APP / AppLovin Corporation | 0.07 | -9.19 | 24.39 | 19.97 | 2.3075 | 0.3208 | |||
| ALSN / Allison Transmission Holdings, Inc. | 0.22 | 21.09 | 1.9957 | 1.9957 | |||||
| EME / EMCOR Group, Inc. | 0.04 | 20.71 | 1.9592 | 1.9592 | |||||
| TER / Teradyne, Inc. | 0.22 | 53.35 | 20.06 | 66.93 | 1.8982 | 0.7236 | |||
| TOST / Toast, Inc. | 0.45 | 19.96 | 1.8882 | 1.8882 | |||||
| COR / Cencora, Inc. | 0.07 | -10.94 | 19.89 | -3.98 | 1.8821 | -0.1425 | |||
| DECK / Deckers Outdoor Corporation | 0.19 | 19.22 | 1.8187 | 1.8187 | |||||
| PODD / Insulet Corporation | 0.06 | -44.06 | 17.35 | -33.07 | 1.6416 | -0.8919 | |||
| CE / Celanese Corporation | 0.31 | 17.14 | 1.6213 | 1.6213 | |||||
| EQH / Equitable Holdings, Inc. | 0.30 | 16.98 | 1.6064 | 1.6064 | |||||
| HUBS / HubSpot, Inc. | 0.03 | -8.62 | 16.88 | -10.96 | 1.5973 | -0.2558 | |||
| VST / Vistra Corp. | 0.09 | 16.75 | 1.5846 | 1.5846 | |||||
| GNRC / Generac Holdings Inc. | 0.11 | -12.18 | 16.05 | -0.69 | 1.5183 | -0.0610 | |||
| PATH / UiPath Inc. | 1.25 | 15.99 | 1.5132 | 1.5132 | |||||
| PAYC / Paycom Software, Inc. | 0.07 | 13.06 | 15.82 | 26.55 | 1.4968 | 0.1613 | |||
| ALNY / Alnylam Pharmaceuticals, Inc. | 0.05 | 15.40 | 1.4573 | 1.4573 | |||||
| TDG / TransDigm Group Incorporated | 0.01 | 15.10 | 1.4287 | 1.4287 | |||||
| ALGN / Align Technology, Inc. | 0.08 | -1.18 | 14.88 | 17.78 | 1.4081 | 0.1731 | |||
| NRG / NRG Energy, Inc. | 0.09 | 14.82 | 1.4026 | 1.4026 | |||||
| LYV / Live Nation Entertainment, Inc. | 0.10 | 14.67 | 1.3877 | 1.3877 | |||||
| CAH / Cardinal Health, Inc. | 0.09 | 14.29 | 1.3517 | 1.3517 | |||||
| CLEAR STREET / RA (000000000) | 13.95 | 1.3199 | 1.3199 | ||||||
| LNG / Cheniere Energy, Inc. | 0.06 | 13.68 | 1.2946 | 1.2946 | |||||
| NTNX / Nutanix, Inc. | 0.18 | 13.64 | 1.2905 | 1.2905 | |||||
| FIVE / Five Below, Inc. | 0.10 | 120.26 | 12.59 | 227.01 | 1.1913 | 0.7763 | |||
| COIN / Coinbase Global, Inc. | 0.04 | 12.57 | 1.1889 | 1.1889 | |||||
| NET / Cloudflare, Inc. | 0.06 | -47.72 | 12.17 | -9.15 | 1.1511 | -0.1577 | |||
| TRGP / Targa Resources Corp. | 0.07 | 11.93 | 1.1287 | 1.1287 | |||||
| GWRE / Guidewire Software, Inc. | 0.05 | -61.50 | 11.86 | 27.70 | 1.1224 | -0.0344 | |||
| DASH / DoorDash, Inc. | 0.05 | 11.68 | 1.1052 | 1.1052 | |||||
| ULTA / Ulta Beauty, Inc. | 0.02 | -6.95 | 11.20 | 8.50 | 1.0599 | -0.2847 | |||
| ALS / The Allstate Corporation | 0.05 | 10.83 | 1.0246 | 1.0246 | |||||
| TXRH / Texas Roadhouse, Inc. | 0.05 | 10.17 | 0.9619 | 0.9619 | |||||
| CART / Maplebear Inc. | 0.22 | 10.04 | 0.9495 | 0.9495 | |||||
| PSTG / Pure Storage, Inc. | 0.17 | 10.02 | 0.9482 | 0.9482 | |||||
| DUOL / Duolingo, Inc. | 0.02 | 9.89 | 0.9355 | 0.9355 | |||||
| VEEV / Veeva Systems Inc. | 0.03 | -67.18 | 9.12 | -59.20 | 0.8625 | -1.3211 | |||
| VLTO / Veralto Corporation | 0.09 | 8.93 | 0.8449 | 0.8449 | |||||
| DT / Dynatrace, Inc. | 0.15 | 8.41 | 0.7953 | 0.7953 | |||||
| BWXT / BWX Technologies, Inc. | 0.06 | -43.27 | 8.03 | -17.15 | 0.7594 | -0.1874 | |||
| EXPE / Expedia Group, Inc. | 0.05 | -46.89 | 7.91 | -46.71 | 0.7488 | -0.7026 | |||
| RYAN / Ryan Specialty Holdings, Inc. | 0.12 | 7.86 | 0.7433 | 0.7433 | |||||
| NTAP / NetApp, Inc. | 0.07 | 7.48 | 0.7080 | 0.7080 | |||||
| BAH / Booz Allen Hamilton Holding Corporation | 0.07 | -32.27 | 7.43 | -32.57 | 0.7033 | -0.3740 | |||
| AXON / Axon Enterprise, Inc. | 0.01 | 7.12 | 0.6741 | 0.6741 | |||||
| SPF / Spotify Technology S.A. | 0.01 | 6.94 | 0.6569 | 0.6569 | |||||
| HWM / Howmet Aerospace Inc. | 0.04 | -77.80 | 6.70 | -68.14 | 0.6340 | -1.4216 | |||
| CPNG / Coupang, Inc. | 0.22 | 6.55 | 0.6202 | 0.6202 | |||||
| DPZ / Domino's Pizza, Inc. | 0.01 | 6.49 | 0.6136 | 0.6136 | |||||
| EPAM / EPAM Systems, Inc. | 0.04 | 6.41 | 0.6065 | 0.6065 | |||||
| CLX / The Clorox Company | 0.05 | 6.40 | 0.6057 | 0.6057 | |||||
| ACGL / Arch Capital Group Ltd. | 0.07 | 6.21 | 0.5878 | 0.5878 | |||||
| BILL / BILL Holdings, Inc. | 0.13 | 6.10 | 0.5776 | 0.5776 | |||||
| ROL / Rollins, Inc. | 0.11 | -71.67 | 5.95 | -70.42 | 0.5631 | -1.4031 | |||
| VRSK / Verisk Analytics, Inc. | 0.02 | 5.81 | 0.5494 | 0.5494 | |||||
| WFRD / Weatherford International plc | 0.11 | 5.72 | 0.5415 | 0.5415 | |||||
| MKSI / MKS Inc. | 0.06 | 5.59 | 0.5290 | 0.5290 | |||||
| FICO / Fair Isaac Corporation | 0.00 | 5.58 | 0.5282 | 0.5282 | |||||
| IT / Gartner, Inc. | 0.01 | 5.54 | 0.5244 | 0.5244 | |||||
| CVNA / Carvana Co. | 0.02 | 5.34 | 0.5055 | 0.5055 | |||||
| PWR / Quanta Services, Inc. | 0.01 | 5.26 | 0.4976 | 0.4976 | |||||
| EXEL / Exelixis, Inc. | 0.12 | 5.16 | 0.4884 | 0.4884 | |||||
| GTLB / GitLab Inc. | 0.11 | 5.09 | 0.4818 | 0.4818 | |||||
| YUM / Yum! Brands, Inc. | 0.03 | 4.95 | 0.4688 | 0.4688 | |||||
| LYFT / Lyft, Inc. | 0.30 | 4.71 | 0.4456 | 0.4456 | |||||
| NCLH / Norwegian Cruise Line Holdings Ltd. | 0.23 | 4.70 | 0.4446 | 0.4446 | |||||
| TRIP / Tripadvisor, Inc. | 0.33 | 4.37 | 0.4133 | 0.4133 | |||||
| ACI / Albertsons Companies, Inc. | 0.19 | 4.18 | 0.3953 | 0.3953 | |||||
| LOAR / Loar Holdings Inc. | 0.05 | 4.12 | 0.3896 | 0.3896 | |||||
| CGNX / Cognex Corporation | 0.12 | 3.90 | 0.3692 | 0.3692 | |||||
| NTRA / Natera, Inc. | 0.02 | 3.90 | 0.3689 | 0.3689 | |||||
| FIVN / Five9, Inc. | 0.14 | 3.78 | 0.3572 | 0.3572 | |||||
| AAL / American Airlines Group Inc. | 0.33 | 3.67 | 0.3471 | 0.3471 | |||||
| ENPH / Enphase Energy, Inc. | 0.09 | 3.65 | 0.3453 | 0.3453 | |||||
| TXG / 10x Genomics, Inc. | 0.31 | 3.61 | 0.3412 | 0.3412 | |||||
| GDDY / GoDaddy Inc. | 0.02 | 3.48 | 0.3294 | 0.3294 | |||||
| AZO / AutoZone, Inc. | 0.00 | 3.42 | 0.3238 | 0.3238 | |||||
| FIX / Comfort Systems USA, Inc. | 0.01 | 3.07 | 0.2902 | 0.2902 | |||||
| TOU / Tourmaline Oil Corp. | 0.19 | -33.23 | 2.85 | -71.58 | 0.2700 | -0.7187 | |||
| LII / Lennox International Inc. | 0.00 | 2.73 | 0.2582 | 0.2582 | |||||
| MSCI / MSCI Inc. | 0.00 | 2.71 | 0.2566 | 0.2566 | |||||
| LNW / Light & Wonder, Inc. | 0.03 | 2.66 | 0.2516 | 0.2516 | |||||
| CELH / Celsius Holdings, Inc. | 0.06 | 2.65 | 0.2508 | 0.2508 | |||||
| ONTO / Onto Innovation Inc. | 0.03 | -65.54 | 2.64 | -71.34 | 0.2499 | -0.6505 | |||
| TT / Trane Technologies plc | 0.01 | 2.59 | 0.2453 | 0.2453 | |||||
| XP / XP Inc. | 0.13 | 2.56 | 0.2419 | 0.2419 | |||||
| GWW / W.W. Grainger, Inc. | 0.00 | 2.55 | 0.2409 | 0.2409 | |||||
| SRPT / Sarepta Therapeutics, Inc. | 0.14 | 2.39 | 0.2261 | 0.2261 | |||||
| PCOR / Procore Technologies, Inc. | 0.03 | 2.31 | 0.2184 | 0.2184 | |||||
| ILMN / Illumina, Inc. | 0.02 | -64.94 | 2.27 | -74.97 | 0.2150 | -0.7397 | |||
| BRO / Brown & Brown, Inc. | 0.02 | -80.57 | 2.24 | -82.69 | 0.2115 | -1.0503 | |||
| MEDP / Medpace Holdings, Inc. | 0.01 | 2.01 | 0.1903 | 0.1903 | |||||
| OKTA / Okta, Inc. | 0.02 | 2.00 | 0.1894 | 0.1894 | |||||
| HUBB / Hubbell Incorporated | 0.00 | 1.99 | 0.1883 | 0.1883 | |||||
| TSCO / Tractor Supply Company | 0.04 | -88.78 | 1.99 | -89.26 | 0.1883 | -1.6226 | |||
| WEX / WEX Inc. | 0.01 | 1.98 | 0.1876 | 0.1876 | |||||
| BR / Broadridge Financial Solutions, Inc. | 0.01 | 1.90 | 0.1802 | 0.1802 | |||||
| WSM / Williams-Sonoma, Inc. | 0.01 | 1.89 | 0.1793 | 0.1793 | |||||
| SPG / Simon Property Group, Inc. | 0.01 | 1.84 | 0.1739 | 0.1739 | |||||
| TTEK / Tetra Tech, Inc. | 0.05 | 1.79 | 0.1697 | 0.1697 | |||||
| BROS / Dutch Bros Inc. | 0.03 | 1.73 | 0.1641 | 0.1641 | |||||
| Pacific Life U.S. Government Fund Direct / STIV (000000000) | 1.71 | 1.71 | 0.1620 | 0.1620 | |||||
| HRB / H&R Block, Inc. | 0.03 | 1.68 | 0.1594 | 0.1594 | |||||
| DKS / DICK'S Sporting Goods, Inc. | 0.01 | 1.52 | 0.1437 | 0.1437 | |||||
| WU / The Western Union Company | 0.16 | 1.38 | 0.1302 | 0.1302 | |||||
| CTAS / Cintas Corporation | 0.01 | 1.37 | 0.1301 | 0.1301 | |||||
| PLNT / Planet Fitness, Inc. | 0.01 | 1.37 | 0.1300 | 0.1300 | |||||
| VRT / Vertiv Holdings Co | 0.01 | 1.17 | 0.1105 | 0.1105 | |||||
| MUSA / Murphy USA Inc. | 0.00 | 1.00 | 0.0951 | 0.0951 | |||||
| HLT / Hilton Worldwide Holdings Inc. | 0.00 | 0.99 | 0.0939 | 0.0939 | |||||
| AXTA / Axalta Coating Systems Ltd. | 0.03 | -92.33 | 0.97 | -86.81 | 0.0915 | -0.9465 | |||
| FTRE / Fortrea Holdings Inc. | 0.19 | 0.94 | 0.0893 | 0.0893 | |||||
| RLI / RLI Corp. | 0.01 | 0.89 | 0.0840 | 0.0840 | |||||
| INCY / Incyte Corporation | 0.01 | 0.85 | 0.0808 | 0.0808 | |||||
| IRM / Iron Mountain Incorporated | 0.01 | 0.63 | 0.0597 | 0.0597 | |||||
| DOCS / Doximity, Inc. | 0.01 | 0.61 | 0.0579 | 0.0579 | |||||
| DDOG / Datadog, Inc. | 0.00 | -97.69 | 0.58 | -96.88 | 0.0552 | -1.7717 | |||
| BLD / TopBuild Corp. | 0.00 | 0.56 | 0.0531 | 0.0531 | |||||
| RCL / Royal Caribbean Cruises Ltd. | 0.00 | 0.40 | 0.0380 | 0.0380 | |||||
| VKTX / Viking Therapeutics, Inc. | 0.01 | 0.33 | 0.0313 | 0.0313 | |||||
| MTSI / MACOM Technology Solutions Holdings, Inc. | 0.00 | -100.00 | 0.00 | -100.00 | -0.6749 | ||||
| AAON / AAON, Inc. | 0.00 | -100.00 | 0.00 | -100.00 | -0.2480 | ||||
| CWAN / Clearwater Analytics Holdings, Inc. | 0.00 | -100.00 | 0.00 | -100.00 | -0.6890 | ||||
| ITRI / Itron, Inc. | 0.00 | -100.00 | 0.00 | -100.00 | -0.6698 |