Mga Batayang Estadistika
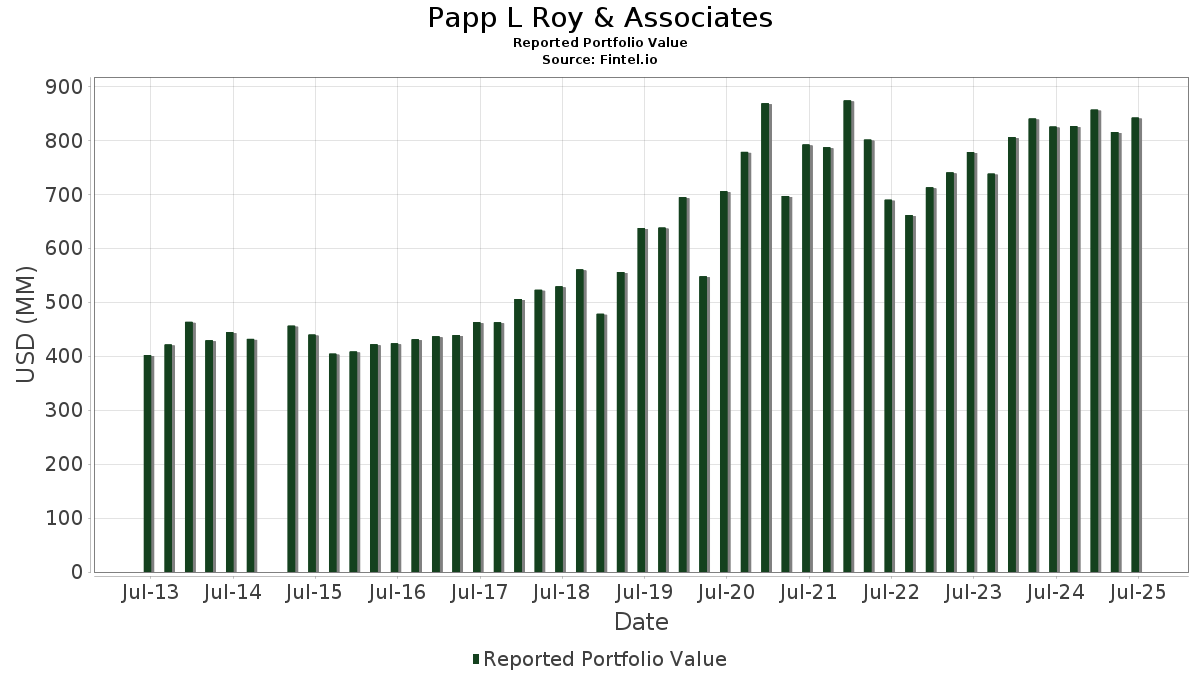
| Nilai Portofolio | $ 841,849,577 |
| Posisi Saat Ini | 180 |
Kepemilikan Terbaru, Kinerja, AUM (dari 13F, 13D)
Papp L Roy & Associates telah mengungkapkan total kepemilikan 180 dalam pengajuan SEC terbaru mereka. Nilai portofolio terbaru dihitung sebesar $ 841,849,577 USD. Aset yang Dikelola (AUM) sebenarnya adalah nilai ini ditambah kas (yang tidak diungkapkan). Aset-aset utama Papp L Roy & Associates adalah Microsoft Corporation (US:MSFT) , Apple Inc. (US:AAPL) , BlackRock, Inc. (US:BLK) , Visa Inc. (US:V) , and Accenture plc (US:ACN) . Posisi baru Papp L Roy & Associates meliputi: GE Vernova Inc. (US:GEV) , Eaton Corporation plc (US:ETN) , Capital One Financial Corporation (US:COF) , .
Peningkatan Tertinggi Kuartal Ini
Kami menggunakan perubahan dalam alokasi portofolio karena ini adalah metrik yang paling bermakna. Perubahan dapat disebabkan oleh perdagangan atau perubahan harga saham.
| Keamanan | Saham (MM) |
Nilai (Juta Dolar AS) |
Portfolio % | ΔPorsyento ng Portfolio |
|---|---|---|---|---|
| 0.12 | 59.82 | 7.1058 | 1.5521 | |
| 0.17 | 31.02 | 3.6845 | 0.3793 | |
| 0.04 | 39.22 | 4.6587 | 0.3307 | |
| 0.12 | 9.28 | 1.1024 | 0.2680 | |
| 0.02 | 6.99 | 0.8298 | 0.2450 | |
| 0.11 | 19.66 | 2.3353 | 0.2110 | |
| 0.04 | 5.68 | 0.6751 | 0.1975 | |
| 0.04 | 9.11 | 1.0826 | 0.1556 | |
| 0.03 | 7.64 | 0.9077 | 0.1439 | |
| 0.01 | 5.99 | 0.7121 | 0.1275 |
Penurunan Tertinggi Kuartal Ini
Kami menggunakan perubahan dalam alokasi portofolio karena ini adalah metrik yang paling bermakna. Perubahan dapat disebabkan oleh perdagangan atau perubahan harga saham.
| Keamanan | Saham (MM) |
Nilai (Juta Dolar AS) |
Portfolio % | ΔPorsyento ng Portfolio |
|---|---|---|---|---|
| 0.24 | 49.42 | 5.8705 | -0.7381 | |
| 0.01 | 2.05 | 0.2430 | -0.5610 | |
| 0.05 | 20.33 | 2.4154 | -0.5461 | |
| 0.36 | 32.28 | 3.8348 | -0.4558 | |
| 0.13 | 12.14 | 1.4423 | -0.4270 | |
| 0.12 | 17.92 | 2.1292 | -0.2777 | |
| 0.11 | 33.10 | 3.9319 | -0.2698 | |
| 0.19 | 22.58 | 2.6826 | -0.2608 | |
| 0.07 | 11.57 | 1.3748 | -0.2496 | |
| 0.09 | 10.17 | 1.2079 | -0.1854 |
Pengajuan 13F dan Dana
Formulir ini diajukan pada 2025-07-24 untuk periode pelaporan 2025-06-30. Klik ikon tautan untuk melihat riwayat transaksi selengkapnya.
Tingkatkan ke versi premium untuk membuka data premium dan ekspor ke Excel. ![]() .
.
| Keamanan | Ketik | Harga Saham Rata-rata | Saham (MM) |
ΔSaham (%) |
ΔSaham (%) |
Nilai ($MM) |
Portpolyo (%) |
ΔPortofolio (%) |
|
|---|---|---|---|---|---|---|---|---|---|
| MSFT / Microsoft Corporation | 0.12 | -0.28 | 59.82 | 32.13 | 7.1058 | 1.5521 | |||
| AAPL / Apple Inc. | 0.24 | -0.68 | 49.42 | -8.26 | 5.8705 | -0.7381 | |||
| BLK / BlackRock, Inc. | 0.04 | 0.27 | 39.22 | 11.16 | 4.6587 | 0.3307 | |||
| V / Visa Inc. | 0.10 | -0.89 | 36.11 | 0.41 | 4.2891 | -0.1223 | |||
| ACN / Accenture plc | 0.11 | 0.89 | 33.10 | -3.36 | 3.9319 | -0.2698 | |||
| ORLY / O'Reilly Automotive, Inc. | 0.36 | 1,367.05 | 32.28 | -7.70 | 3.8348 | -0.4558 | |||
| GOOGL / Alphabet Inc. | 0.17 | 1.39 | 31.02 | 15.12 | 3.6845 | 0.3793 | |||
| COST / Costco Wholesale Corporation | 0.03 | -2.68 | 26.11 | 1.87 | 3.1012 | -0.0426 | |||
| SYK / Stryker Corporation | 0.06 | 1.17 | 24.89 | 7.52 | 2.9565 | 0.1169 | |||
| EOG / EOG Resources, Inc. | 0.19 | 0.91 | 22.58 | -5.88 | 2.6826 | -0.2608 | |||
| HD / The Home Depot, Inc. | 0.06 | 1.28 | 22.10 | 1.32 | 2.6257 | -0.0505 | |||
| TMO / Thermo Fisher Scientific Inc. | 0.05 | 3.37 | 20.33 | -15.77 | 2.4154 | -0.5461 | |||
| GOOGL / Alphabet Inc. | 0.11 | -0.38 | 19.66 | 13.52 | 2.3353 | 0.2110 | |||
| EXPD / Expeditors International of Washington, Inc. | 0.16 | 1.00 | 18.79 | -4.04 | 2.2321 | -0.1701 | |||
| JNJ / Johnson & Johnson | 0.12 | -0.82 | 17.92 | -8.65 | 2.1292 | -0.2777 | |||
| CNI / Canadian National Railway Company | 0.14 | 0.70 | 14.38 | 7.49 | 1.7079 | 0.0671 | |||
| MA / Mastercard Incorporated | 0.03 | -1.25 | 14.25 | 1.24 | 1.6930 | -0.0339 | |||
| TROW / T. Rowe Price Group, Inc. | 0.13 | -24.14 | 12.14 | -20.32 | 1.4423 | -0.4270 | |||
| MTD / Mettler-Toledo International Inc. | 0.01 | 3.63 | 12.03 | 3.09 | 1.4292 | -0.0025 | |||
| XBI / SPDR Series Trust - SPDR S&P Biotech ETF | 0.14 | -2.21 | 11.88 | -0.01 | 1.4111 | -0.0462 | |||
| RSP / Invesco Exchange-Traded Fund Trust - Invesco S&P 500 Equal Weight ETF | 0.06 | 1.86 | 11.74 | 6.86 | 1.3946 | 0.0469 | |||
| FI / Fiserv, Inc. | 0.07 | 11.95 | 11.57 | -12.60 | 1.3748 | -0.2496 | |||
| PG / The Procter & Gamble Company | 0.07 | 1.07 | 10.36 | -5.51 | 1.2307 | -0.1143 | |||
| XOM / Exxon Mobil Corporation | 0.09 | -1.23 | 10.17 | -10.47 | 1.2079 | -0.1854 | |||
| ECL / Ecolab Inc. | 0.04 | 1.90 | 9.75 | 8.31 | 1.1587 | 0.0538 | |||
| MRVL / Marvell Technology, Inc. | 0.12 | 8.54 | 9.28 | 36.45 | 1.1024 | 0.2680 | |||
| ADI / Analog Devices, Inc. | 0.04 | 2.19 | 9.11 | 20.61 | 1.0826 | 0.1556 | |||
| FDS / FactSet Research Systems Inc. | 0.02 | 2.64 | 8.40 | 0.97 | 0.9984 | -0.0227 | |||
| XLK / The Select Sector SPDR Trust - The Technology Select Sector SPDR Fund | 0.03 | 0.07 | 7.64 | 22.73 | 0.9077 | 0.1439 | |||
| JPM / JPMorgan Chase & Co. | 0.03 | 0.00 | 7.46 | 18.20 | 0.8857 | 0.1118 | |||
| USMV / iShares Trust - iShares MSCI USA Min Vol Factor ETF | 0.08 | 0.02 | 7.38 | 0.24 | 0.8765 | -0.0264 | |||
| EMR / Emerson Electric Co. | 0.05 | -6.59 | 7.31 | 13.59 | 0.8688 | 0.0789 | |||
| WY / Weyerhaeuser Company | 0.27 | 0.00 | 7.01 | -12.26 | 0.8328 | -0.1474 | |||
| ROK / Rockwell Automation, Inc. | 0.02 | 13.98 | 6.99 | 46.53 | 0.8298 | 0.2450 | |||
| AME / AMETEK, Inc. | 0.04 | 16.18 | 6.71 | 22.14 | 0.7976 | 0.1232 | |||
| PEP / PepsiCo, Inc. | 0.05 | 5.18 | 6.35 | -7.37 | 0.7538 | -0.0866 | |||
| INTU / Intuit Inc. | 0.01 | -1.95 | 5.99 | 25.79 | 0.7121 | 0.1275 | |||
| TRMB / Trimble Inc. | 0.08 | 1.81 | 5.91 | 17.84 | 0.7024 | 0.0868 | |||
| NVDA / NVIDIA Corporation | 0.04 | 0.14 | 5.68 | 45.98 | 0.6751 | 0.1975 | |||
| BRK.B / Berkshire Hathaway Inc. | 0.01 | 3.34 | 5.53 | -5.76 | 0.6571 | -0.0628 | |||
| CVX / Chevron Corporation | 0.04 | 4.31 | 5.37 | -10.71 | 0.6376 | -0.0999 | |||
| WCN / Waste Connections, Inc. | 0.03 | 0.00 | 5.07 | -4.34 | 0.6028 | -0.0479 | |||
| RBC / RBC Bearings Incorporated | 0.01 | 4.56 | 4.75 | 25.03 | 0.5639 | 0.0982 | |||
| NXPI / NXP Semiconductors N.V. | 0.02 | 3.67 | 4.65 | 19.19 | 0.5528 | 0.0738 | |||
| VMI / Valmont Industries, Inc. | 0.01 | 0.24 | 4.55 | 14.72 | 0.5408 | 0.0540 | |||
| SCHB / Schwab Strategic Trust - Schwab U.S. Broad Market ETF | 0.15 | 0.26 | 3.48 | 10.97 | 0.4135 | 0.0287 | |||
| VIG / Vanguard Specialized Funds - Vanguard Dividend Appreciation ETF | 0.02 | -0.05 | 3.45 | 5.47 | 0.4103 | 0.0085 | |||
| VUG / Vanguard Index Funds - Vanguard Growth ETF | 0.01 | -1.90 | 3.16 | 15.99 | 0.3758 | 0.0412 | |||
| ANSS / ANSYS, Inc. | 0.01 | 1.01 | 3.12 | 12.09 | 0.3701 | 0.0291 | |||
| ADBE / Adobe Inc. | 0.01 | 0.00 | 3.05 | 0.86 | 0.3618 | -0.0086 | |||
| ADP / Automatic Data Processing, Inc. | 0.01 | 0.00 | 2.96 | 0.95 | 0.3518 | -0.0081 | |||
| WM / Waste Management, Inc. | 0.01 | 3.63 | 2.94 | 2.40 | 0.3493 | -0.0029 | |||
| VGT / Vanguard World Fund - Vanguard Information Technology ETF | 0.00 | 0.00 | 2.90 | 22.30 | 0.3446 | 0.0536 | |||
| MKC / McCormick & Company, Incorporated | 0.04 | 1.49 | 2.88 | -6.52 | 0.3422 | -0.0358 | |||
| RMD / ResMed Inc. | 0.01 | 41.74 | 2.80 | 63.35 | 0.3321 | 0.1222 | |||
| AMZN / Amazon.com, Inc. | 0.01 | -1.22 | 2.75 | 13.88 | 0.3265 | 0.0305 | |||
| CSGP / CoStar Group, Inc. | 0.03 | 1.78 | 2.72 | 3.26 | 0.3232 | 0.0000 | |||
| SHW / The Sherwin-Williams Company | 0.01 | 0.00 | 2.56 | -1.65 | 0.3043 | -0.0153 | |||
| PEGA / Pegasystems Inc. | 0.05 | 104.02 | 2.47 | 58.85 | 0.2931 | 0.1025 | |||
| NKE / NIKE, Inc. | 0.03 | -32.19 | 2.46 | -24.13 | 0.2926 | -0.1056 | |||
| MCD / McDonald's Corporation | 0.01 | 0.46 | 2.42 | -6.05 | 0.2878 | -0.0285 | |||
| VTI / Vanguard Index Funds - Vanguard Total Stock Market ETF | 0.01 | 20.79 | 2.42 | 33.61 | 0.2876 | 0.0653 | |||
| IEX / IDEX Corporation | 0.01 | 2.14 | 2.42 | -0.90 | 0.2872 | -0.0121 | |||
| CSCO / Cisco Systems, Inc. | 0.03 | 0.00 | 2.16 | 12.42 | 0.2571 | 0.0209 | |||
| ORCL / Oracle Corporation | 0.01 | 7.22 | 2.13 | 67.67 | 0.2526 | 0.0970 | |||
| MCHP / Microchip Technology Incorporated | 0.03 | -3.47 | 2.09 | 40.28 | 0.2479 | 0.0654 | |||
| KO / The Coca-Cola Company | 0.03 | 0.05 | 2.05 | -1.16 | 0.2432 | -0.0109 | |||
| BDX / Becton, Dickinson and Company | 0.01 | -58.50 | 2.05 | -68.79 | 0.2430 | -0.5610 | |||
| CHD / Church & Dwight Co., Inc. | 0.02 | 2.14 | 2.05 | -10.82 | 0.2429 | -0.0384 | |||
| RTX / RTX Corporation | 0.01 | -3.80 | 2.00 | 6.05 | 0.2373 | 0.0062 | |||
| CAT / Caterpillar Inc. | 0.00 | 0.00 | 1.93 | 17.71 | 0.2297 | 0.0282 | |||
| SYY / Sysco Corporation | 0.02 | -0.38 | 1.86 | 0.54 | 0.2211 | -0.0060 | |||
| AMGN / Amgen Inc. | 0.01 | 0.00 | 1.80 | -10.34 | 0.2142 | -0.0326 | |||
| CL / Colgate-Palmolive Company | 0.02 | -3.31 | 1.78 | -6.22 | 0.2114 | -0.0213 | |||
| VTIP / Vanguard Malvern Funds - Vanguard Short-Term Inflation-Protected Securities ETF | 0.03 | 0.00 | 1.75 | 0.75 | 0.2084 | -0.0052 | |||
| CLX / The Clorox Company | 0.01 | -9.41 | 1.68 | -26.14 | 0.1994 | -0.0794 | |||
| WMT / Walmart Inc. | 0.02 | -1.17 | 1.65 | 10.11 | 0.1954 | 0.0121 | |||
| IBM / International Business Machines Corporation | 0.01 | 0.00 | 1.64 | 18.52 | 0.1946 | 0.0251 | |||
| LLY / Eli Lilly and Company | 0.00 | -1.04 | 1.63 | -6.63 | 0.1942 | -0.0205 | |||
| EPD / Enterprise Products Partners L.P. - Limited Partnership | 0.05 | 11.42 | 1.61 | 1.26 | 0.1910 | -0.0039 | |||
| YETI / YETI Holdings, Inc. | 0.05 | 22.61 | 1.59 | 16.83 | 0.1889 | 0.0218 | |||
| AXP / American Express Company | 0.00 | 0.00 | 1.44 | 18.60 | 0.1705 | 0.0220 | |||
| ABBV / AbbVie Inc. | 0.01 | 0.00 | 1.32 | -11.45 | 0.1573 | -0.0261 | |||
| SPY / SPDR S&P 500 ETF | 0.00 | 5.01 | 1.32 | 15.99 | 0.1569 | 0.0172 | |||
| SLAB / Silicon Laboratories Inc. | 0.01 | 2.13 | 1.31 | 33.71 | 0.1555 | 0.0354 | |||
| STT / State Street Corporation | 0.01 | -5.01 | 1.30 | 12.85 | 0.1545 | 0.0131 | |||
| INFA / Informatica Inc. | 0.05 | 3.84 | 1.29 | 44.93 | 0.1529 | 0.0439 | |||
| META / Meta Platforms, Inc. | 0.00 | -8.23 | 1.26 | 17.55 | 0.1496 | 0.0181 | |||
| TECH / Bio-Techne Corporation | 0.02 | 5.27 | 1.25 | -7.61 | 0.1487 | -0.0175 | |||
| PR / Permian Resources Corporation | 0.08 | 44.98 | 1.15 | 42.48 | 0.1363 | 0.0376 | |||
| LIN / Linde plc | 0.00 | 0.00 | 1.10 | 0.73 | 0.1304 | -0.0032 | |||
| ABT / Abbott Laboratories | 0.01 | -1.86 | 1.08 | 0.65 | 0.1281 | -0.0034 | |||
| XLE / The Select Sector SPDR Trust - The Energy Select Sector SPDR Fund | 0.01 | -1.55 | 1.07 | -10.72 | 0.1277 | -0.0199 | |||
| EGP / EastGroup Properties, Inc. | 0.01 | 0.31 | 1.07 | -4.83 | 0.1266 | -0.0108 | |||
| VCSH / Vanguard Scottsdale Funds - Vanguard Short-Term Corporate Bond ETF | 0.01 | 0.00 | 1.00 | 0.71 | 0.1186 | -0.0030 | |||
| STIP / iShares Trust - iShares 0-5 Year TIPS Bond ETF | 0.01 | 0.00 | 0.97 | -0.51 | 0.1149 | -0.0044 | |||
| TSLA / Tesla, Inc. | 0.00 | 2.55 | 0.83 | 25.76 | 0.0986 | 0.0176 | |||
| WFC / Wells Fargo & Company | 0.01 | -5.99 | 0.80 | 4.98 | 0.0952 | 0.0015 | |||
| VO / Vanguard Index Funds - Vanguard Mid-Cap ETF | 0.00 | 6.73 | 0.76 | 15.37 | 0.0901 | 0.0095 | |||
| KMI / Kinder Morgan, Inc. | 0.03 | 0.22 | 0.74 | 3.20 | 0.0881 | 0.0000 | |||
| UPS / United Parcel Service, Inc. | 0.01 | -35.08 | 0.71 | -40.44 | 0.0844 | -0.0619 | |||
| WAB / Westinghouse Air Brake Technologies Corporation | 0.00 | 4.65 | 0.71 | 20.68 | 0.0840 | 0.0122 | |||
| MRK / Merck & Co., Inc. | 0.01 | 0.01 | 0.71 | -11.86 | 0.0840 | -0.0143 | |||
| IWP / iShares Trust - iShares Russell Mid-Cap Growth ETF | 0.01 | 0.02 | 0.71 | 18.09 | 0.0839 | 0.0105 | |||
| KR / The Kroger Co. | 0.01 | 0.00 | 0.70 | 6.02 | 0.0837 | 0.0021 | |||
| SCHX / Schwab Strategic Trust - Schwab U.S. Large-Cap ETF | 0.03 | -1.68 | 0.70 | 8.85 | 0.0834 | 0.0043 | |||
| VVV / Valvoline Inc. | 0.02 | 1.99 | 0.70 | 10.97 | 0.0830 | 0.0057 | |||
| DT / Dynatrace, Inc. | 0.01 | 2.28 | 0.69 | 19.93 | 0.0822 | 0.0113 | |||
| IVV / iShares Trust - iShares Core S&P 500 ETF | 0.00 | 18.80 | 0.69 | 31.17 | 0.0816 | 0.0174 | |||
| HON / Honeywell International Inc. | 0.00 | -2.77 | 0.68 | 6.93 | 0.0807 | 0.0028 | |||
| ICLR / ICON Public Limited Company | 0.00 | -41.85 | 0.67 | -51.68 | 0.0801 | -0.0911 | |||
| VXF / Vanguard Index Funds - Vanguard Extended Market ETF | 0.00 | 0.00 | 0.66 | 11.95 | 0.0780 | 0.0060 | |||
| SCHG / Schwab Strategic Trust - Schwab U.S. Large-Cap Growth ETF | 0.02 | -2.27 | 0.65 | 13.94 | 0.0778 | 0.0073 | |||
| GMF / SPDR Index Shares Funds - SPDR S&P Emerging Asia Pacific ETF | 0.01 | 0.00 | 0.65 | 9.24 | 0.0773 | 0.0043 | |||
| NSC / Norfolk Southern Corporation | 0.00 | 0.00 | 0.64 | 8.14 | 0.0758 | 0.0034 | |||
| VTV / Vanguard Index Funds - Vanguard Value ETF | 0.00 | 0.06 | 0.63 | 2.44 | 0.0749 | -0.0007 | |||
| VOT / Vanguard Index Funds - Vanguard Mid-Cap Growth ETF | 0.00 | 0.41 | 0.63 | 16.60 | 0.0743 | 0.0086 | |||
| SLV / iShares Silver Trust | 0.02 | 0.00 | 0.62 | 5.95 | 0.0741 | 0.0018 | |||
| POOL / Pool Corporation | 0.00 | 11.55 | 0.62 | 2.13 | 0.0739 | -0.0008 | |||
| GLD / SPDR Gold Trust | 0.00 | 0.00 | 0.62 | 5.79 | 0.0738 | 0.0018 | |||
| IQV / IQVIA Holdings Inc. | 0.00 | -16.52 | 0.62 | -25.45 | 0.0735 | -0.0282 | |||
| MDT / Medtronic plc | 0.01 | 32.07 | 0.59 | 28.17 | 0.0697 | 0.0135 | |||
| DIS / The Walt Disney Company | 0.00 | -8.34 | 0.58 | 15.20 | 0.0685 | 0.0071 | |||
| GWW / W.W. Grainger, Inc. | 0.00 | 0.00 | 0.52 | 5.50 | 0.0615 | 0.0012 | |||
| ROST / Ross Stores, Inc. | 0.00 | 0.00 | 0.51 | -0.20 | 0.0606 | -0.0021 | |||
| FHN / First Horizon Corporation | 0.02 | 0.00 | 0.49 | 9.05 | 0.0588 | 0.0032 | |||
| VT / Vanguard International Equity Index Funds - Vanguard Total World Stock ETF | 0.00 | 0.03 | 0.48 | 10.78 | 0.0575 | 0.0039 | |||
| SUB / iShares Trust - iShares Short-Term National Muni Bond ETF | 0.00 | 0.00 | 0.46 | 0.65 | 0.0549 | -0.0014 | |||
| GE / General Electric Company | 0.00 | 0.00 | 0.46 | 28.81 | 0.0542 | 0.0107 | |||
| QUAL / iShares Trust - iShares MSCI USA Quality Factor ETF | 0.00 | 2.50 | 0.45 | 9.51 | 0.0534 | 0.0031 | |||
| SBUX / Starbucks Corporation | 0.00 | -12.18 | 0.45 | -17.92 | 0.0533 | -0.0138 | |||
| MTUM / iShares Trust - iShares MSCI USA Momentum Factor ETF | 0.00 | 0.38 | 0.45 | 19.62 | 0.0529 | 0.0071 | |||
| SCHD / Schwab Strategic Trust - Schwab U.S. Dividend Equity ETF | 0.02 | 0.00 | 0.43 | -5.12 | 0.0506 | -0.0045 | |||
| UMBF / UMB Financial Corporation | 0.00 | 0.00 | 0.42 | 3.93 | 0.0503 | 0.0004 | |||
| ITOT / iShares Trust - iShares Core S&P Total U.S. Stock Market ETF | 0.00 | 6.20 | 0.40 | 17.44 | 0.0481 | 0.0058 | |||
| BMY / Bristol-Myers Squibb Company | 0.01 | 0.00 | 0.40 | -24.20 | 0.0477 | -0.0172 | |||
| DGRO / iShares Trust - iShares Core Dividend Growth ETF | 0.01 | 13.16 | 0.40 | 17.06 | 0.0473 | 0.0056 | |||
| VYM / Vanguard Whitehall Funds - Vanguard High Dividend Yield ETF | 0.00 | -9.40 | 0.39 | -6.33 | 0.0458 | -0.0047 | |||
| FAD / First Trust Exchange-Traded AlphaDEX Fund - First Trust Multi Cap Growth AlphaDEX Fund | 0.00 | 0.00 | 0.38 | 13.73 | 0.0453 | 0.0041 | |||
| FANG / Diamondback Energy, Inc. | 0.00 | -23.00 | 0.38 | -33.86 | 0.0451 | -0.0253 | |||
| PFE / Pfizer Inc. | 0.02 | 0.00 | 0.38 | -4.29 | 0.0450 | -0.0036 | |||
| FSLR / First Solar, Inc. | 0.00 | 18.65 | 0.37 | 55.19 | 0.0445 | 0.0149 | |||
| AMAT / Applied Materials, Inc. | 0.00 | 0.00 | 0.37 | 26.19 | 0.0442 | 0.0080 | |||
| DVN / Devon Energy Corporation | 0.01 | -21.00 | 0.37 | -32.78 | 0.0434 | -0.0233 | |||
| ZTS / Zoetis Inc. | 0.00 | 0.00 | 0.35 | -5.21 | 0.0411 | -0.0037 | |||
| VB / Vanguard Index Funds - Vanguard Small-Cap ETF | 0.00 | 0.07 | 0.35 | 7.14 | 0.0410 | 0.0014 | |||
| QQQ / Invesco QQQ Trust, Series 1 | 0.00 | 19.42 | 0.34 | 40.66 | 0.0403 | 0.0107 | |||
| INTC / Intel Corporation | 0.01 | -3.23 | 0.34 | -4.56 | 0.0398 | -0.0033 | |||
| ANET / Arista Networks Inc | 0.00 | 0.00 | 0.33 | 32.39 | 0.0389 | 0.0085 | |||
| SCHO / Schwab Strategic Trust - Schwab Short-Term U.S. Treasury ETF | 0.01 | 5.45 | 0.31 | 5.78 | 0.0370 | 0.0008 | |||
| VOO / Vanguard Index Funds - Vanguard S&P 500 ETF | 0.00 | -19.85 | 0.31 | -11.27 | 0.0365 | -0.0060 | |||
| IDXX / IDEXX Laboratories, Inc. | 0.00 | -8.06 | 0.31 | 17.31 | 0.0363 | 0.0044 | |||
| FTCS / First Trust Exchange-Traded Fund - First Trust Capital Strength ETF | 0.00 | 0.00 | 0.30 | 1.37 | 0.0352 | -0.0007 | |||
| FXL / First Trust Exchange-Traded AlphaDEX Fund - First Trust Technology AlphaDEX Fund | 0.00 | 0.00 | 0.29 | 19.34 | 0.0344 | 0.0046 | |||
| IEV / iShares Trust - iShares Europe ETF | 0.00 | 0.00 | 0.28 | 8.81 | 0.0338 | 0.0017 | |||
| LOW / Lowe's Companies, Inc. | 0.00 | -8.11 | 0.28 | -12.73 | 0.0334 | -0.0061 | |||
| AZO / AutoZone, Inc. | 0.00 | 0.00 | 0.28 | -2.46 | 0.0331 | -0.0020 | |||
| EWJ / iShares, Inc. - iShares MSCI Japan ETF | 0.00 | 0.00 | 0.27 | 9.50 | 0.0315 | 0.0018 | |||
| DUK / Duke Energy Corporation | 0.00 | -1.15 | 0.26 | -4.35 | 0.0314 | -0.0025 | |||
| BBSI / Barrett Business Services, Inc. | 0.01 | 0.00 | 0.26 | 1.16 | 0.0311 | -0.0006 | |||
| MELI / MercadoLibre, Inc. | 0.00 | 0.26 | 0.0310 | 0.0310 | |||||
| VXUS / Vanguard STAR Funds - Vanguard Total International Stock ETF | 0.00 | 0.91 | 0.26 | 12.55 | 0.0309 | 0.0025 | |||
| TJX / The TJX Companies, Inc. | 0.00 | -9.70 | 0.26 | -8.48 | 0.0309 | -0.0039 | |||
| CRH / CRH plc | 0.00 | 0.00 | 0.26 | 4.51 | 0.0303 | 0.0003 | |||
| CINF / Cincinnati Financial Corporation | 0.00 | 0.00 | 0.25 | 0.80 | 0.0299 | -0.0007 | |||
| KMB / Kimberly-Clark Corporation | 0.00 | -2.03 | 0.25 | -11.07 | 0.0296 | -0.0048 | |||
| SKYY / First Trust Exchange-Traded Fund II - First Trust Cloud Computing ETF | 0.00 | 0.00 | 0.24 | 19.12 | 0.0290 | 0.0038 | |||
| VBR / Vanguard Index Funds - Vanguard Small-Cap Value ETF | 0.00 | 0.00 | 0.24 | 4.44 | 0.0280 | 0.0004 | |||
| UNP / Union Pacific Corporation | 0.00 | 0.00 | 0.24 | -2.49 | 0.0280 | -0.0017 | |||
| CSX / CSX Corporation | 0.01 | 0.00 | 0.23 | 10.90 | 0.0279 | 0.0019 | |||
| ZBRA / Zebra Technologies Corporation | 0.00 | 0.00 | 0.23 | 8.96 | 0.0275 | 0.0015 | |||
| SCHW / The Charles Schwab Corporation | 0.00 | 0.23 | 0.0273 | 0.0273 | |||||
| FUL / H.B. Fuller Company | 0.00 | 0.00 | 0.22 | 7.18 | 0.0267 | 0.0010 | |||
| NTRS / Northern Trust Corporation | 0.00 | 0.22 | 0.0260 | 0.0260 | |||||
| GEV / GE Vernova Inc. | 0.00 | 0.21 | 0.0255 | 0.0255 | |||||
| ETN / Eaton Corporation plc | 0.00 | 0.21 | 0.0248 | 0.0248 | |||||
| APD / Air Products and Chemicals, Inc. | 0.00 | 0.00 | 0.21 | -4.15 | 0.0248 | -0.0020 | |||
| AMD / Advanced Micro Devices, Inc. | 0.00 | 0.20 | 0.0241 | 0.0241 | |||||
| COF / Capital One Financial Corporation | 0.00 | 0.20 | 0.0241 | 0.0241 | |||||
| OMEX / Odyssey Marine Exploration, Inc. | 0.15 | 0.00 | 0.18 | 193.44 | 0.0214 | 0.0139 | |||
| OMC / Omnicom Group Inc. | 0.00 | -100.00 | 0.00 | 0.0000 |