Mga Batayang Estadistika
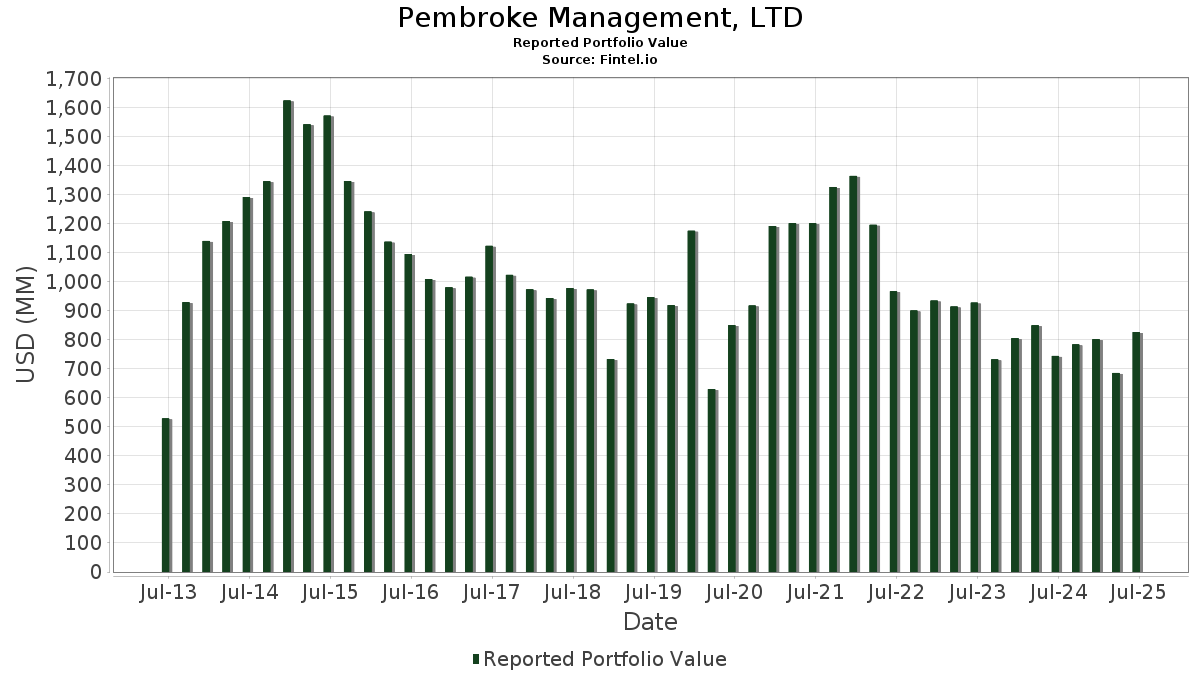
| Nilai Portofolio | $ 826,658,709 |
| Posisi Saat Ini | 78 |
Kepemilikan Terbaru, Kinerja, AUM (dari 13F, 13D)
Pembroke Management, LTD telah mengungkapkan total kepemilikan 78 dalam pengajuan SEC terbaru mereka. Nilai portofolio terbaru dihitung sebesar $ 826,658,709 USD. Aset yang Dikelola (AUM) sebenarnya adalah nilai ini ditambah kas (yang tidak diungkapkan). Aset-aset utama Pembroke Management, LTD adalah Core & Main, Inc. (US:CNM) , Pure Storage, Inc. (US:PSTG) , Monolithic Power Systems, Inc. (US:MPWR) , Installed Building Products, Inc. (US:IBP) , and Federal Signal Corporation (US:FSS) . Posisi baru Pembroke Management, LTD meliputi: Microsoft Corporation (US:MSFT) , Meta Platforms, Inc. (US:META) , Ferguson Enterprises Inc. (US:FERG) , Boston Scientific Corporation (US:BSX) , and The Progressive Corporation (US:PGR) .
Peningkatan Tertinggi Kuartal Ini
Kami menggunakan perubahan dalam alokasi portofolio karena ini adalah metrik yang paling bermakna. Perubahan dapat disebabkan oleh perdagangan atau perubahan harga saham.
| Keamanan | Saham (MM) |
Nilai (Juta Dolar AS) |
Portfolio % | ΔPorsyento ng Portfolio |
|---|---|---|---|---|
| 0.72 | 41.46 | 5.0159 | 1.4955 | |
| 0.36 | 37.84 | 4.5773 | 1.3838 | |
| 0.05 | 40.20 | 4.8633 | 1.2928 | |
| 1.16 | 25.62 | 3.0987 | 1.1569 | |
| 0.12 | 24.24 | 2.9328 | 1.0584 | |
| 0.72 | 43.35 | 5.2442 | 0.9977 | |
| 1.15 | 28.01 | 3.3882 | 0.6521 | |
| 0.17 | 11.02 | 1.3325 | 0.5747 | |
| 0.25 | 23.39 | 2.8292 | 0.5359 | |
| 0.40 | 16.52 | 1.9980 | 0.4897 |
Penurunan Tertinggi Kuartal Ini
Kami menggunakan perubahan dalam alokasi portofolio karena ini adalah metrik yang paling bermakna. Perubahan dapat disebabkan oleh perdagangan atau perubahan harga saham.
| Keamanan | Saham (MM) |
Nilai (Juta Dolar AS) |
Portfolio % | ΔPorsyento ng Portfolio |
|---|---|---|---|---|
| 1.43 | 22.82 | 2.7610 | -2.3946 | |
| 0.60 | 35.47 | 4.2904 | -1.4034 | |
| 0.28 | 19.17 | 2.3187 | -0.8006 | |
| 0.17 | 20.43 | 2.4715 | -0.5275 | |
| 0.09 | 12.14 | 1.4685 | -0.5071 | |
| 0.44 | 12.20 | 1.4760 | -0.2695 | |
| 0.08 | 14.90 | 1.8021 | -0.2433 | |
| 1.07 | 10.05 | 1.2151 | -0.2263 | |
| 0.27 | 11.70 | 1.4156 | -0.2242 | |
| 0.24 | 11.54 | 1.3965 | -0.2073 |
Pengajuan 13F dan Dana
Formulir ini diajukan pada 2025-08-07 untuk periode pelaporan 2025-06-30. Klik ikon tautan untuk melihat riwayat transaksi selengkapnya.
Tingkatkan ke versi premium untuk membuka data premium dan ekspor ke Excel. ![]() .
.
| Keamanan | Ketik | Harga Saham Rata-rata | Saham (MM) |
ΔSaham (%) |
ΔSaham (%) |
Nilai ($MM) |
Portpolyo (%) |
ΔPortofolio (%) |
|
|---|---|---|---|---|---|---|---|---|---|
| CNM / Core & Main, Inc. | 0.72 | 19.17 | 43.35 | 48.87 | 5.2442 | 0.9977 | |||
| PSTG / Pure Storage, Inc. | 0.72 | 32.05 | 41.46 | 71.76 | 5.0159 | 1.4955 | |||
| MPWR / Monolithic Power Systems, Inc. | 0.05 | 30.20 | 40.20 | 64.19 | 4.8633 | 1.2928 | |||
| IBP / Installed Building Products, Inc. | 0.21 | 22.49 | 38.04 | 28.82 | 4.6017 | 0.2957 | |||
| FSS / Federal Signal Corporation | 0.36 | 19.41 | 37.84 | 72.78 | 4.5773 | 1.3838 | |||
| GMED / Globus Medical, Inc. | 0.60 | 12.66 | 35.47 | -9.17 | 4.2904 | -1.4034 | |||
| SITE / SiteOne Landscape Supply, Inc. | 0.27 | 30.21 | 32.54 | 29.67 | 3.9369 | 0.2772 | |||
| AAON / AAON, Inc. | 0.43 | 39.82 | 31.73 | 31.99 | 3.8381 | 0.3327 | |||
| STVN / Stevanato Group S.p.A. | 1.15 | 24.77 | 28.01 | 49.28 | 3.3882 | 0.6521 | |||
| VERX / Vertex, Inc. | 0.76 | 12.39 | 26.77 | 13.45 | 3.2384 | -0.2024 | |||
| REZI / Resideo Technologies, Inc. | 1.16 | 54.34 | 25.62 | 92.36 | 3.0987 | 1.1569 | |||
| MANH / Manhattan Associates, Inc. | 0.12 | 65.27 | 24.24 | 88.61 | 2.9328 | 1.0584 | |||
| WSO / Watsco, Inc. | 0.05 | 51.75 | 23.56 | 31.84 | 2.8505 | 0.2443 | |||
| QTWO / Q2 Holdings, Inc. | 0.25 | 27.14 | 23.39 | 48.72 | 2.8292 | 0.5359 | |||
| TREX / Trex Company, Inc. | 0.43 | 23.74 | 23.23 | 15.82 | 2.8105 | -0.1147 | |||
| CLBT / Cellebrite DI Ltd. | 1.43 | -21.61 | 22.82 | -35.45 | 2.7610 | -2.3946 | |||
| DORM / Dorman Products, Inc. | 0.17 | -2.39 | 20.43 | -0.66 | 2.4715 | -0.5275 | |||
| AX / Axos Financial, Inc. | 0.27 | -2.76 | 20.30 | 14.60 | 2.4558 | -0.1274 | |||
| RYAN / Ryan Specialty Holdings, Inc. | 0.28 | -2.65 | 19.17 | -10.40 | 2.3187 | -0.8006 | |||
| TECH / Bio-Techne Corporation | 0.34 | 34.90 | 17.48 | 18.39 | 2.1148 | -0.0386 | |||
| IVV / iShares Trust - iShares Core S&P 500 ETF | 0.03 | 12.67 | 17.31 | 24.50 | 2.0942 | 0.0666 | |||
| BRKR / Bruker Corporation | 0.40 | 61.77 | 16.52 | 59.68 | 1.9980 | 0.4897 | |||
| CRAI / CRA International, Inc. | 0.08 | -1.83 | 14.90 | 6.21 | 1.8021 | -0.2433 | |||
| BWMN / Bowman Consulting Group Ltd. | 0.51 | -1.74 | 14.70 | 29.41 | 1.7788 | 0.1219 | |||
| DSGX / The Descartes Systems Group Inc. | 0.10 | 18.05 | 13.80 | 12.72 | 1.6697 | -0.1159 | |||
| IMAX / IMAX Corporation | 0.44 | -3.94 | 12.20 | 1.93 | 1.4760 | -0.2695 | |||
| OLLI / Ollie's Bargain Outlet Holdings, Inc. | 0.09 | -20.88 | 12.14 | -10.40 | 1.4685 | -0.5071 | |||
| CHWY / Chewy, Inc. | 0.27 | -20.62 | 11.70 | 4.06 | 1.4156 | -0.2242 | |||
| KBR / KBR, Inc. | 0.24 | 9.06 | 11.54 | 4.96 | 1.3965 | -0.2073 | |||
| RDVT / Red Violet, Inc. | 0.23 | -9.02 | 11.30 | 19.08 | 1.3672 | -0.0168 | |||
| WNS / WNS (Holdings) Limited | 0.17 | 106.09 | 11.02 | 111.99 | 1.3325 | 0.5747 | |||
| UTI / Universal Technical Institute, Inc. | 0.31 | -3.74 | 10.46 | 27.03 | 1.2657 | 0.0647 | |||
| CCCS / CCC Intelligent Solutions Holdings Inc. | 1.07 | -2.48 | 10.05 | 1.63 | 1.2151 | -0.2263 | |||
| HGTY / Hagerty, Inc. | 0.99 | 5.95 | 10.04 | 18.49 | 1.2150 | -0.0211 | |||
| VCTR / Victory Capital Holdings, Inc. | 0.15 | -2.10 | 9.85 | 7.72 | 1.1915 | -0.1420 | |||
| GIL / Gildan Activewear Inc. | 0.12 | 67.52 | 8.33 | 76.70 | 1.0075 | 0.3201 | |||
| VBNK / VersaBank | 0.43 | 27.35 | 6.70 | 33.89 | 0.8102 | 0.0807 | |||
| CDRE / Cadre Holdings, Inc. | 0.17 | -2.47 | 5.29 | 4.92 | 0.6395 | -0.0953 | |||
| IEFA / iShares Trust - iShares Core MSCI EAFE ETF | 0.05 | 9.34 | 4.55 | 20.68 | 0.5499 | 0.0005 | |||
| LCII / LCI Industries | 0.05 | -2.51 | 4.21 | 1.69 | 0.5097 | -0.0946 | |||
| MAIN / Main Street Capital Corporation | 0.07 | 1.37 | 4.13 | 5.92 | 0.5000 | -0.0690 | |||
| IEMG / iShares, Inc. - iShares Core MSCI Emerging Markets ETF | 0.06 | 3.43 | 3.46 | 15.04 | 0.4184 | -0.0200 | |||
| GIB / CGI Inc. | 0.02 | 28.96 | 2.83 | 28.38 | 0.3421 | 0.0209 | |||
| SHOP / Shopify Inc. | 0.01 | 42.82 | 2.19 | 135.05 | 0.2653 | 0.1292 | |||
| CNI / Canadian National Railway Company | 0.01 | 17.04 | 1.77 | 18.58 | 0.2146 | -0.0035 | |||
| RY N / Royal Bank of Canada | 0.01 | 0.00 | 1.69 | 10.69 | 0.2043 | -0.0181 | |||
| FSV / FirstService Corporation | 0.01 | 0.00 | 1.55 | -0.38 | 0.1880 | -0.0396 | |||
| CAE / CAE Inc. | 0.04 | 0.00 | 1.42 | 12.85 | 0.1722 | -0.0118 | |||
| PMTS / CPI Card Group Inc. | 0.05 | 37.71 | 1.26 | 11.94 | 0.1521 | -0.0116 | |||
| BN / Brookfield Corporation | 0.01 | 32.72 | 1.20 | 48.45 | 0.1450 | 0.0273 | |||
| STN / Stantec Inc. | 0.01 | 0.00 | 1.03 | 24.33 | 0.1243 | 0.0037 | |||
| WPM / Wheaton Precious Metals Corp. | 0.01 | -42.14 | 0.91 | -36.55 | 0.1105 | -0.0994 | |||
| AEM / Agnico Eagle Mines Limited | 0.01 | -55.88 | 0.86 | -33.97 | 0.1044 | -0.0862 | |||
| AGI / Alamos Gold Inc. | 0.02 | -43.03 | 0.80 | -46.37 | 0.0966 | -0.1204 | |||
| CIGI / Colliers International Group Inc. | 0.00 | 0.00 | 0.68 | 2.26 | 0.0821 | -0.0146 | |||
| AMZN / Amazon.com, Inc. | 0.00 | 150.04 | 0.64 | 188.74 | 0.0776 | 0.0451 | |||
| VEEV / Veeva Systems Inc. | 0.00 | 0.55 | 0.0661 | 0.0661 | |||||
| MSFT / Microsoft Corporation | 0.00 | 0.54 | 0.0649 | 0.0649 | |||||
| META / Meta Platforms, Inc. | 0.00 | 0.49 | 0.0594 | 0.0594 | |||||
| FERG / Ferguson Enterprises Inc. | 0.00 | 0.47 | 0.0564 | 0.0564 | |||||
| AAPL / Apple Inc. | 0.00 | 139.96 | 0.45 | 121.67 | 0.0546 | 0.0249 | |||
| BSX / Boston Scientific Corporation | 0.00 | 0.43 | 0.0515 | 0.0515 | |||||
| PGR / The Progressive Corporation | 0.00 | 0.42 | 0.0513 | 0.0513 | |||||
| NVDA / NVIDIA Corporation | 0.00 | 0.42 | 0.0511 | 0.0511 | |||||
| CXDO / Crexendo, Inc. | 0.06 | 0.38 | 0.0464 | 0.0464 | |||||
| ORLY / O'Reilly Automotive, Inc. | 0.00 | 0.36 | 0.0440 | 0.0440 | |||||
| MA / Mastercard Incorporated | 0.00 | 0.36 | 0.0436 | 0.0436 | |||||
| CSGP / CoStar Group, Inc. | 0.00 | 0.35 | 0.0424 | 0.0424 | |||||
| SPOT / Spotify Technology S.A. | 0.00 | 0.31 | 0.0374 | 0.0374 | |||||
| TDG / TransDigm Group Incorporated | 0.00 | 0.31 | 0.0373 | 0.0373 | |||||
| TT / Trane Technologies plc | 0.00 | 0.30 | 0.0367 | 0.0367 | |||||
| LIN / Linde plc | 0.00 | 0.30 | 0.0363 | 0.0363 | |||||
| GOOGL / Alphabet Inc. | 0.00 | 0.27 | 0.0332 | 0.0332 | |||||
| PSA / Public Storage | 0.00 | 0.27 | 0.0329 | 0.0329 | |||||
| ASML / ASML Holding N.V. - Depositary Receipt (Common Stock) | 0.00 | 0.26 | 0.0318 | 0.0318 | |||||
| IDXX / IDEXX Laboratories, Inc. | 0.00 | 0.24 | 0.0289 | 0.0289 | |||||
| MDB / MongoDB, Inc. | 0.00 | 0.24 | 0.0289 | 0.0289 | |||||
| ISRG / Intuitive Surgical, Inc. | 0.00 | 0.22 | 0.0261 | 0.0261 | |||||
| BASE / Couchbase, Inc. | 0.00 | -100.00 | 0.00 | 0.0000 | |||||
| NCNO / nCino, Inc. | 0.00 | -100.00 | 0.00 | 0.0000 |