Mga Batayang Estadistika
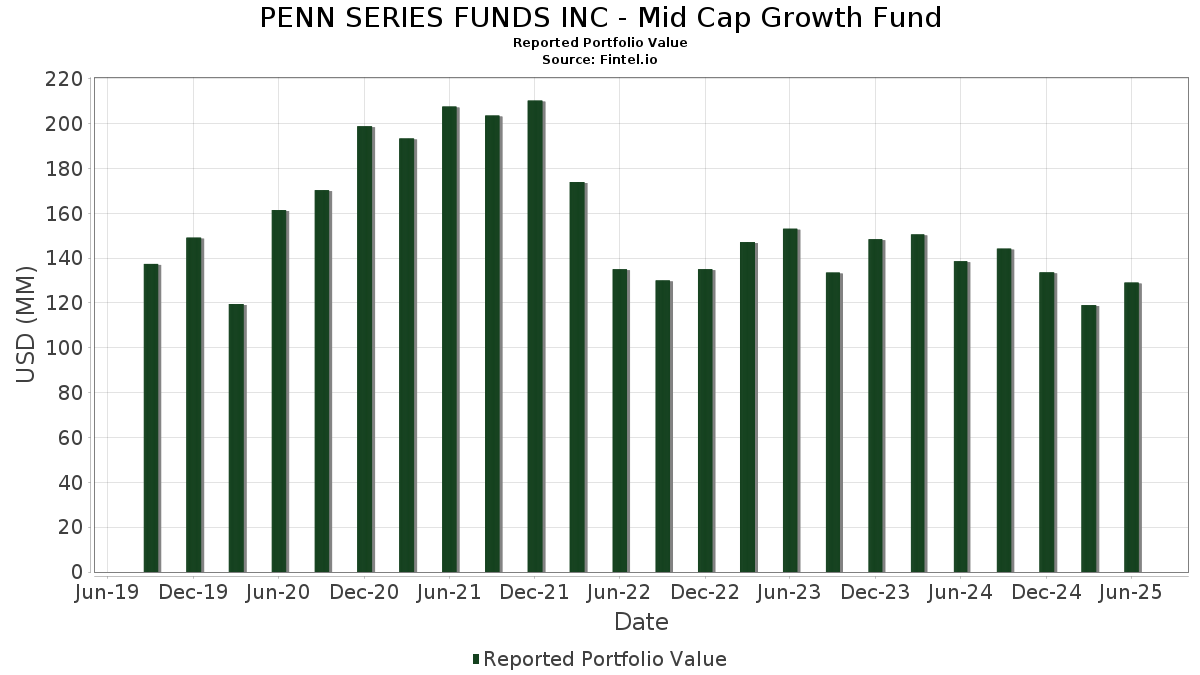
| Nilai Portofolio | $ 129,078,603 |
| Posisi Saat Ini | 64 |
Kepemilikan Terbaru, Kinerja, AUM (dari 13F, 13D)
PENN SERIES FUNDS INC - Mid Cap Growth Fund telah mengungkapkan total kepemilikan 64 dalam pengajuan SEC terbaru mereka. Nilai portofolio terbaru dihitung sebesar $ 129,078,603 USD. Aset yang Dikelola (AUM) sebenarnya adalah nilai ini ditambah kas (yang tidak diungkapkan). Aset-aset utama PENN SERIES FUNDS INC - Mid Cap Growth Fund adalah IDEXX Laboratories, Inc. (US:IDXX) , CoStar Group, Inc. (US:CSGP) , Royal Caribbean Cruises Ltd. (US:RCL) , Insulet Corporation (US:PODD) , and Cloudflare, Inc. (US:NET) . Posisi baru PENN SERIES FUNDS INC - Mid Cap Growth Fund meliputi: Royal Caribbean Cruises Ltd. (US:RCL) , Alnylam Pharmaceuticals, Inc. (US:ALNY) , Tapestry, Inc. (US:TPR) , Toast, Inc. (US:TOST) , and Dutch Bros Inc. (US:BROS) .
Peningkatan Tertinggi Kuartal Ini
Kami menggunakan perubahan dalam alokasi portofolio karena ini adalah metrik yang paling bermakna. Perubahan dapat disebabkan oleh perdagangan atau perubahan harga saham.
| Keamanan | Saham (MM) |
Nilai (Juta Dolar AS) |
Portfolio % | ΔPorsyento ng Portfolio |
|---|---|---|---|---|
| 0.01 | 3.97 | 3.0739 | 3.0739 | |
| 0.01 | 2.11 | 1.6368 | 1.6368 | |
| 0.02 | 1.65 | 1.2755 | 1.2755 | |
| 0.02 | 3.32 | 2.5704 | 1.2561 | |
| 0.03 | 1.51 | 1.1693 | 1.1693 | |
| 0.01 | 2.58 | 1.9969 | 1.1258 | |
| 0.02 | 1.23 | 0.9546 | 0.9546 | |
| 0.01 | 4.52 | 3.5015 | 0.7737 | |
| 0.01 | 2.63 | 2.0375 | 0.7523 | |
| 0.01 | 1.61 | 1.2461 | 0.5683 |
Penurunan Tertinggi Kuartal Ini
Kami menggunakan perubahan dalam alokasi portofolio karena ini adalah metrik yang paling bermakna. Perubahan dapat disebabkan oleh perdagangan atau perubahan harga saham.
| Keamanan | Saham (MM) |
Nilai (Juta Dolar AS) |
Portfolio % | ΔPorsyento ng Portfolio |
|---|---|---|---|---|
| 0.05 | 4.35 | 3.3708 | -0.9509 | |
| 0.00 | 1.42 | 1.0995 | -0.8905 | |
| 0.02 | 1.46 | 1.1314 | -0.5086 | |
| 0.00 | 0.69 | 0.5372 | -0.3517 | |
| 0.01 | 2.31 | 1.7878 | -0.2782 | |
| 0.01 | 2.50 | 1.9332 | -0.2607 | |
| 0.04 | 2.14 | 1.6575 | -0.2589 | |
| 0.00 | 0.00 | -0.2491 | ||
| 0.00 | 0.00 | -0.2491 | ||
| 0.04 | 2.05 | 1.5905 | -0.2369 |
Pengajuan 13F dan Dana
Formulir ini diajukan pada 2025-08-26 untuk periode pelaporan 2025-06-30. Klik ikon tautan untuk melihat riwayat transaksi selengkapnya.
Tingkatkan ke versi premium untuk membuka data premium dan ekspor ke Excel. ![]() .
.
| Keamanan | Ketik | Harga Saham Rata-rata | Saham (MM) |
ΔSaham (%) |
ΔSaham (%) |
Nilai ($MM) |
Portpolyo (%) |
ΔPortofolio (%) |
|
|---|---|---|---|---|---|---|---|---|---|
| IDXX / IDEXX Laboratories, Inc. | 0.01 | 9.26 | 4.52 | 39.52 | 3.5015 | 0.7737 | |||
| CSGP / CoStar Group, Inc. | 0.05 | -16.45 | 4.35 | -15.20 | 3.3708 | -0.9509 | |||
| RCL / Royal Caribbean Cruises Ltd. | 0.01 | 3.97 | 3.0739 | 3.0739 | |||||
| PODD / Insulet Corporation | 0.01 | -7.97 | 3.33 | 10.09 | 2.5781 | 0.0328 | |||
| NET / Cloudflare, Inc. | 0.02 | 22.34 | 3.32 | 112.63 | 2.5704 | 1.2561 | |||
| FAST / Fastenal Company | 0.08 | 96.94 | 3.25 | 6.66 | 2.5205 | -0.0483 | |||
| DDOG / Datadog, Inc. | 0.02 | 2.95 | 3.07 | 39.38 | 2.3749 | 0.5229 | |||
| HWM / Howmet Aerospace Inc. | 0.02 | -15.69 | 2.96 | 20.95 | 2.2953 | 0.2325 | |||
| HEIA / Heico Corp. - Class A | 0.01 | -20.05 | 2.73 | -1.97 | 2.1186 | -0.2302 | |||
| LPLA / LPL Financial Holdings Inc. | 0.01 | 50.35 | 2.63 | 72.35 | 2.0375 | 0.7523 | |||
| MPWR / Monolithic Power Systems, Inc. | 0.00 | 3.94 | 2.60 | 31.05 | 2.0177 | 0.3443 | |||
| SNOW / Snowflake Inc. | 0.01 | 62.77 | 2.58 | 149.23 | 1.9969 | 1.1258 | |||
| VEEV / Veeva Systems Inc. | 0.01 | -22.96 | 2.50 | -4.22 | 1.9332 | -0.2607 | |||
| CPAY / Corpay, Inc. | 0.01 | 5.84 | 2.46 | 0.74 | 1.9092 | -0.1515 | |||
| FND / Floor & Decor Holdings, Inc. | 0.03 | 18.02 | 2.43 | 11.40 | 1.8860 | 0.0457 | |||
| POOL / Pool Corporation | 0.01 | 2.74 | 2.31 | -5.95 | 1.7878 | -0.2782 | |||
| HUBS / HubSpot, Inc. | 0.00 | 6.50 | 2.31 | 3.78 | 1.7870 | -0.0850 | |||
| CH1134540470 / On Holding AG | 0.04 | 2.78 | 2.27 | 21.82 | 1.7602 | 0.1893 | |||
| MLM / Martin Marietta Materials, Inc. | 0.00 | 2.55 | 2.23 | 17.76 | 1.7262 | 0.1325 | |||
| LECO / Lincoln Electric Holdings, Inc. | 0.01 | 0.00 | 2.18 | 9.62 | 1.6866 | 0.0138 | |||
| GNRC / Generac Holdings Inc. | 0.02 | 0.40 | 2.16 | 13.51 | 1.6730 | 0.0711 | |||
| ROL / Rollins, Inc. | 0.04 | -9.96 | 2.14 | -5.98 | 1.6575 | -0.2589 | |||
| SN / SharkNinja, Inc. | 0.02 | 6.03 | 2.14 | 25.85 | 1.6557 | 0.2253 | |||
| ODFL / Old Dominion Freight Line, Inc. | 0.01 | 10.02 | 2.12 | 7.89 | 1.6431 | -0.0119 | |||
| ALNY / Alnylam Pharmaceuticals, Inc. | 0.01 | 2.11 | 1.6368 | 1.6368 | |||||
| TSCO / Tractor Supply Company | 0.04 | -1.21 | 2.05 | -5.35 | 1.5905 | -0.2369 | |||
| COHR / Coherent Corp. | 0.02 | -21.00 | 2.05 | 8.52 | 1.5890 | -0.0027 | |||
| KNSL / Kinsale Capital Group, Inc. | 0.00 | 0.15 | 1.98 | -0.45 | 1.5366 | -0.1410 | |||
| PINS / Pinterest, Inc. | 0.05 | 4.29 | 1.97 | 20.64 | 1.5267 | 0.1510 | |||
| TYL / Tyler Technologies, Inc. | 0.00 | 1.72 | 1.96 | 3.76 | 1.5179 | -0.0728 | |||
| OWL / Blue Owl Capital Inc. | 0.10 | 26.84 | 1.95 | 21.61 | 1.5132 | 0.1603 | |||
| NOVT / Novanta Inc. | 0.02 | 12.14 | 1.93 | 13.10 | 1.4984 | 0.0578 | |||
| EXPE / Expedia Group, Inc. | 0.01 | 11.03 | 1.93 | 11.44 | 1.4944 | 0.0363 | |||
| TTD / The Trade Desk, Inc. | 0.03 | -1.25 | 1.91 | 29.94 | 1.4834 | 0.2421 | |||
| BRO / Brown & Brown, Inc. | 0.02 | 41.53 | 1.89 | 26.15 | 1.4657 | 0.2025 | |||
| ALGN / Align Technology, Inc. | 0.01 | 5.47 | 1.86 | 25.78 | 1.4402 | 0.1947 | |||
| BOOT / Boot Barn Holdings, Inc. | 0.01 | 2.52 | 1.77 | 45.09 | 1.3740 | 0.3443 | |||
| TECH / Bio-Techne Corporation | 0.03 | 8.31 | 1.73 | -4.99 | 1.3440 | -0.1931 | |||
| TREX / Trex Company, Inc. | 0.03 | 13.51 | 1.72 | 6.29 | 1.3350 | -0.0310 | |||
| BWXT / BWX Technologies, Inc. | 0.01 | 1.39 | 1.67 | 48.05 | 1.2917 | 0.3434 | |||
| CYBR / CyberArk Software Ltd. | 0.00 | 7.47 | 1.66 | 29.35 | 1.2842 | 0.2051 | |||
| TPR / Tapestry, Inc. | 0.02 | 1.65 | 1.2755 | 1.2755 | |||||
| TFDXX / Blackrock Liquidity Funds - BlackRock Liquidity Funds FedFund Portfolio Institutional Class | 1.62 | 53.30 | 1.62 | 53.42 | 1.2529 | 0.3644 | |||
| PCTY / Paylocity Holding Corporation | 0.01 | 10.54 | 1.62 | 6.88 | 1.2525 | -0.0210 | |||
| 1MA / MACOM Technology Solutions Holdings, Inc. | 0.01 | 40.01 | 1.61 | 100.00 | 1.2461 | 0.5683 | |||
| 6B6 / monday.com Ltd. | 0.01 | 3.10 | 1.58 | 33.33 | 1.2247 | 0.2262 | |||
| CDW / CDW Corporation | 0.01 | 8.86 | 1.54 | 21.36 | 1.1935 | 0.1240 | |||
| TOST / Toast, Inc. | 0.03 | 1.51 | 1.1693 | 1.1693 | |||||
| WAY / Waystar Holding Corp. | 0.04 | 40.64 | 1.50 | 53.89 | 1.1636 | 0.3415 | |||
| CASY / Casey's General Stores, Inc. | 0.00 | -19.22 | 1.50 | -5.07 | 1.1610 | -0.1680 | |||
| ITRI / Itron, Inc. | 0.01 | 46.48 | 1.47 | 83.98 | 1.1393 | 0.4664 | |||
| EW / Edwards Lifesciences Corporation | 0.02 | -24.14 | 1.46 | -35.77 | 1.1314 | -0.5086 | |||
| CPRT / Copart, Inc. | 0.03 | 3.45 | 1.43 | -10.29 | 1.1082 | -0.2347 | |||
| APP / AppLovin Corporation | 0.00 | -54.54 | 1.42 | -39.95 | 1.0995 | -0.8905 | |||
| BSY / Bentley Systems, Incorporated | 0.03 | 67.09 | 1.38 | 129.45 | 1.0684 | 0.5617 | |||
| BAH / Booz Allen Hamilton Holding Corporation | 0.01 | 1.78 | 1.30 | 1.32 | 1.0090 | -0.0733 | |||
| BROS / Dutch Bros Inc. | 0.02 | 1.23 | 0.9546 | 0.9546 | |||||
| LSCC / Lattice Semiconductor Corporation | 0.03 | 7.48 | 1.23 | 0.41 | 0.9501 | -0.0787 | |||
| INSP / Inspire Medical Systems, Inc. | 0.01 | 13.20 | 1.13 | -7.82 | 0.8775 | -0.1567 | |||
| CWAN / Clearwater Analytics Holdings, Inc. | 0.05 | 61.57 | 1.09 | 32.16 | 0.8410 | 0.1495 | |||
| IONS / Ionis Pharmaceuticals, Inc. | 0.03 | 0.00 | 1.05 | 30.91 | 0.8109 | 0.1378 | |||
| APPF / AppFolio, Inc. | 0.00 | -37.27 | 0.69 | -34.31 | 0.5372 | -0.3517 | |||
| KTOS / Kratos Defense & Security Solutions, Inc. | 0.01 | 0.69 | 0.5324 | 0.5324 | |||||
| MANH / Manhattan Associates, Inc. | 0.00 | 0.67 | 0.5168 | 0.5168 | |||||
| AAON / AAON, Inc. | 0.00 | -100.00 | 0.00 | -100.00 | -0.2491 | ||||
| AAON / AAON, Inc. | 0.00 | -100.00 | 0.00 | -100.00 | -0.2491 |