Mga Batayang Estadistika
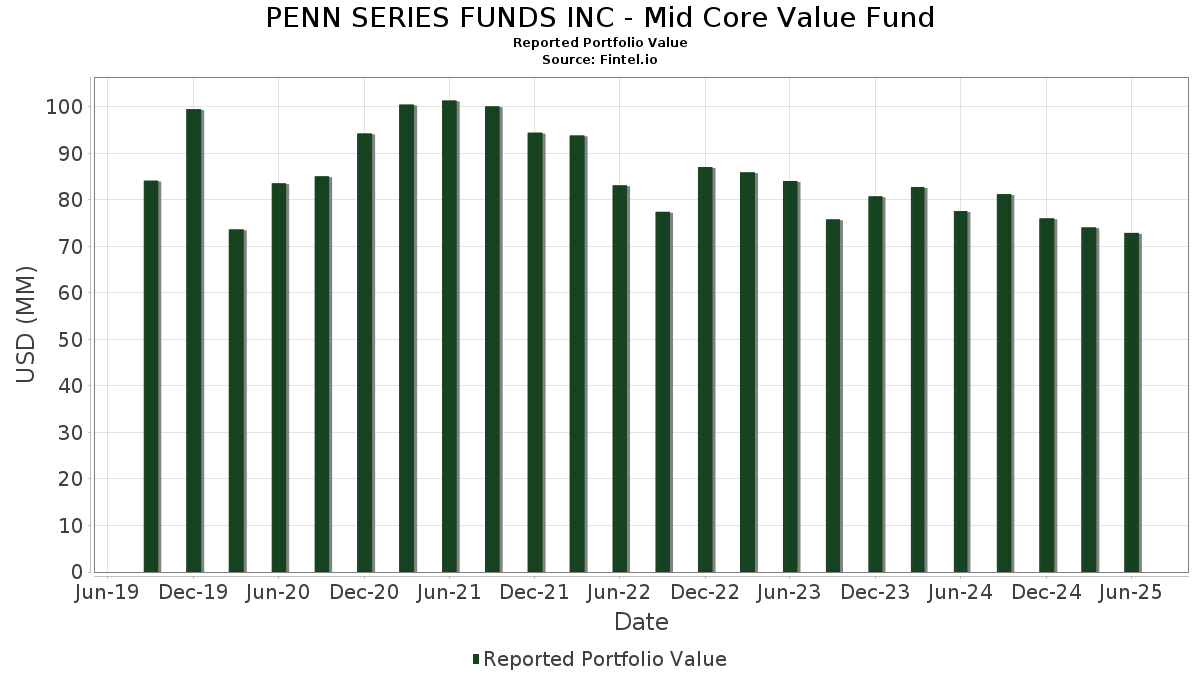
| Nilai Portofolio | $ 72,876,098 |
| Posisi Saat Ini | 116 |
Kepemilikan Terbaru, Kinerja, AUM (dari 13F, 13D)
PENN SERIES FUNDS INC - Mid Core Value Fund telah mengungkapkan total kepemilikan 116 dalam pengajuan SEC terbaru mereka. Nilai portofolio terbaru dihitung sebesar $ 72,876,098 USD. Aset yang Dikelola (AUM) sebenarnya adalah nilai ini ditambah kas (yang tidak diungkapkan). Aset-aset utama PENN SERIES FUNDS INC - Mid Core Value Fund adalah Zimmer Biomet Holdings, Inc. (US:ZBH) , Enterprise Products Partners L.P. - Limited Partnership (US:EPD) , Henry Schein, Inc. (US:HSIC) , Truist Financial Corporation (US:TFC) , and U.S. Bancorp (US:USB) . Posisi baru PENN SERIES FUNDS INC - Mid Core Value Fund meliputi: Hexcel Corporation (US:HXL) , The Toro Company (US:TTC) , NXP Semiconductors N.V. (DE:VNX) , Raymond James Financial, Inc. (US:RJF) , and Ashtead Group plc (GB:AHT) .
Peningkatan Tertinggi Kuartal Ini
Kami menggunakan perubahan dalam alokasi portofolio karena ini adalah metrik yang paling bermakna. Perubahan dapat disebabkan oleh perdagangan atau perubahan harga saham.
| Keamanan | Saham (MM) |
Nilai (Juta Dolar AS) |
Portfolio % | ΔPorsyento ng Portfolio |
|---|---|---|---|---|
| 0.00 | 0.80 | 1.0947 | 0.9338 | |
| 0.01 | 1.00 | 1.3724 | 0.7299 | |
| 0.01 | 0.71 | 0.9740 | 0.6293 | |
| 0.01 | 0.45 | 0.6237 | 0.6237 | |
| 0.00 | 0.84 | 1.1594 | 0.6112 | |
| 0.01 | 0.41 | 0.5695 | 0.5695 | |
| 0.00 | 0.41 | 0.5588 | 0.5588 | |
| 0.00 | 0.39 | 0.5371 | 0.5371 | |
| 0.03 | 1.04 | 1.4246 | 0.5285 | |
| 0.01 | 0.34 | 0.4720 | 0.4720 |
Penurunan Tertinggi Kuartal Ini
Kami menggunakan perubahan dalam alokasi portofolio karena ini adalah metrik yang paling bermakna. Perubahan dapat disebabkan oleh perdagangan atau perubahan harga saham.
| Keamanan | Saham (MM) |
Nilai (Juta Dolar AS) |
Portfolio % | ΔPorsyento ng Portfolio |
|---|---|---|---|---|
| 0.00 | 0.28 | 0.3865 | -0.7510 | |
| 0.01 | 0.18 | 0.2531 | -0.6401 | |
| 0.00 | 0.42 | 0.5715 | -0.5801 | |
| 0.00 | 0.36 | 0.4917 | -0.4446 | |
| 0.01 | 0.49 | 0.6739 | -0.4373 | |
| 0.01 | 0.55 | 0.7486 | -0.4120 | |
| 0.01 | 0.36 | 0.4932 | -0.4057 | |
| 0.00 | 0.15 | 0.2017 | -0.3717 | |
| 0.02 | 1.94 | 2.6607 | -0.3624 | |
| 0.00 | 0.58 | 0.8014 | -0.3439 |
Pengajuan 13F dan Dana
Formulir ini diajukan pada 2025-08-26 untuk periode pelaporan 2025-06-30. Klik ikon tautan untuk melihat riwayat transaksi selengkapnya.
Tingkatkan ke versi premium untuk membuka data premium dan ekspor ke Excel. ![]() .
.
| Keamanan | Ketik | Harga Saham Rata-rata | Saham (MM) |
ΔSaham (%) |
ΔSaham (%) |
Nilai ($MM) |
Portpolyo (%) |
ΔPortofolio (%) |
|
|---|---|---|---|---|---|---|---|---|---|
| ZBH / Zimmer Biomet Holdings, Inc. | 0.02 | 6.87 | 1.94 | -13.87 | 2.6607 | -0.3624 | |||
| EPD / Enterprise Products Partners L.P. - Limited Partnership | 0.05 | 4.68 | 1.52 | -4.93 | 2.0925 | -0.0612 | |||
| HSIC / Henry Schein, Inc. | 0.02 | -4.06 | 1.49 | 2.34 | 2.0457 | 0.0894 | |||
| TFC / Truist Financial Corporation | 0.03 | 3.48 | 1.46 | 8.12 | 2.0106 | 0.1906 | |||
| USB / U.S. Bancorp | 0.03 | -7.04 | 1.44 | -0.42 | 1.9738 | 0.0351 | |||
| WTY / Willis Towers Watson Public Limited Company | 0.00 | 20.90 | 1.34 | 9.69 | 1.8348 | 0.1973 | |||
| NTRS / Northern Trust Corporation | 0.01 | -9.22 | 1.30 | 16.64 | 1.7906 | 0.2888 | |||
| LH / Labcorp Holdings Inc. | 0.00 | -11.06 | 1.25 | 0.32 | 1.7210 | 0.0421 | |||
| KVUE / Kenvue Inc. | 0.06 | 35.46 | 1.22 | 18.26 | 1.6813 | 0.2897 | |||
| NSC / Norfolk Southern Corporation | 0.00 | -20.50 | 1.17 | -14.08 | 1.6009 | -0.2225 | |||
| MSM / MSC Industrial Direct Co., Inc. | 0.01 | -6.52 | 1.16 | 2.29 | 1.5960 | 0.0697 | |||
| OSK / Oshkosh Corporation | 0.01 | -2.32 | 1.16 | 17.92 | 1.5902 | 0.2702 | |||
| O / Realty Income Corporation | 0.02 | 2.54 | 1.14 | 1.88 | 1.5639 | 0.0610 | |||
| CBSH / Commerce Bancshares, Inc. | 0.02 | -1.47 | 1.14 | -1.56 | 1.5628 | 0.0092 | |||
| CSX / CSX Corporation | 0.03 | 24.88 | 1.14 | 38.54 | 1.5600 | 0.4575 | |||
| VICI / VICI Properties Inc. | 0.03 | -7.97 | 1.08 | -8.01 | 1.4835 | -0.0948 | |||
| ES / Eversource Energy | 0.02 | 14.99 | 1.05 | 17.79 | 1.4467 | 0.2447 | |||
| BKR / Baker Hughes Company | 0.03 | 78.34 | 1.04 | 55.47 | 1.4246 | 0.5285 | |||
| LHX / L3Harris Technologies, Inc. | 0.00 | -21.02 | 1.03 | -5.40 | 1.4193 | -0.0481 | |||
| BDX / Becton, Dickinson and Company | 0.01 | 19.89 | 1.03 | -9.78 | 1.4182 | -0.1212 | |||
| BNZL / Bunzl plc | 0.03 | 55.08 | 1.03 | 28.39 | 1.4165 | 0.3375 | |||
| RGA / Reinsurance Group of America, Incorporated | 0.01 | 40.30 | 1.03 | 41.48 | 1.4143 | 0.4351 | |||
| EVRG / Evergy, Inc. | 0.01 | -15.57 | 1.03 | -15.61 | 1.4108 | -0.2248 | |||
| XEL / Xcel Energy Inc. | 0.01 | 17.49 | 1.01 | 12.99 | 1.3861 | 0.1860 | |||
| KMB / Kimberly-Clark Corporation | 0.01 | 21.78 | 1.01 | 10.41 | 1.3841 | 0.1572 | |||
| PNC / The PNC Financial Services Group, Inc. | 0.01 | 97.10 | 1.00 | 109.00 | 1.3724 | 0.7299 | |||
| EQR / Equity Residential | 0.01 | 5.49 | 0.99 | -0.50 | 1.3597 | 0.0219 | |||
| GPK / Graphic Packaging Holding Company | 0.05 | 12.38 | 0.99 | -8.88 | 1.3535 | -0.0987 | |||
| NWE / NorthWestern Energy Group, Inc. | 0.02 | -5.15 | 0.96 | -15.97 | 1.3230 | -0.2168 | |||
| TFDXX / Blackrock Liquidity Funds - BlackRock Liquidity Funds FedFund Portfolio Institutional Class | 0.95 | 8.55 | 0.95 | 8.45 | 1.3054 | 0.1286 | |||
| PKG / Packaging Corporation of America | 0.00 | 117.47 | 0.84 | 106.86 | 1.1594 | 0.6112 | |||
| PSA / Public Storage | 0.00 | 1.28 | 0.81 | -0.73 | 1.1185 | 0.0161 | |||
| CMI / Cummins Inc. | 0.00 | 537.43 | 0.80 | 569.75 | 1.0947 | 0.9338 | |||
| AOS / Amdocs Limited | 0.01 | -24.52 | 0.78 | -24.74 | 1.0736 | -0.3222 | |||
| GEHC / GE HealthCare Technologies Inc. | 0.01 | 55.25 | 0.77 | 42.57 | 1.0534 | 0.3299 | |||
| EL / The Estée Lauder Companies Inc. | 0.01 | 6.56 | 0.76 | 30.46 | 1.0416 | 0.2603 | |||
| SR / Spire Inc. | 0.01 | -9.92 | 0.75 | -15.96 | 1.0343 | -0.1703 | |||
| HPQ / HP Inc. | 0.03 | -0.28 | 0.74 | -11.92 | 1.0146 | -0.1125 | |||
| AMT / American Tower Corporation | 0.00 | -6.26 | 0.72 | -4.77 | 0.9866 | -0.0274 | |||
| MDT / Medtronic plc | 0.01 | 3.73 | 0.72 | 0.56 | 0.9852 | 0.0271 | |||
| RS / Reliance, Inc. | 0.00 | 4.37 | 0.71 | 13.56 | 0.9777 | 0.1344 | |||
| TER / Teradyne, Inc. | 0.01 | 153.97 | 0.71 | 176.95 | 0.9740 | 0.6293 | |||
| RB N / Reckitt Benckiser Group plc | 0.01 | 3.81 | 0.71 | 4.58 | 0.9727 | 0.0626 | |||
| LUV / Southwest Airlines Co. | 0.02 | 3.52 | 0.71 | 0.00 | 0.9726 | 0.0209 | |||
| CAG / Conagra Brands, Inc. | 0.03 | -4.43 | 0.69 | -26.71 | 0.9425 | -0.3149 | |||
| OGS / ONE Gas, Inc. | 0.01 | -14.02 | 0.67 | -18.32 | 0.9190 | -0.1812 | |||
| RI / Pernod Ricard SA | 0.01 | -9.26 | 0.64 | -8.36 | 0.8738 | -0.0595 | |||
| PB / Prosperity Bancshares, Inc. | 0.01 | 75.11 | 0.63 | 81.84 | 0.8670 | 0.4388 | |||
| CTSH / Cognizant Technology Solutions Corporation | 0.01 | 34.91 | 0.62 | 37.50 | 0.8468 | 0.2446 | |||
| CTRA / Coterra Energy Inc. | 0.02 | 0.00 | 0.61 | -12.20 | 0.8408 | -0.0961 | |||
| DOC / Healthpeak Properties, Inc. | 0.03 | 18.25 | 0.61 | 2.35 | 0.8369 | 0.0371 | |||
| TE Connectivity PLC / EC (IE000IVNQZ81) | 0.00 | -27.44 | 0.61 | -13.37 | 0.8368 | -0.1088 | |||
| IQV / IQVIA Holdings Inc. | 0.00 | 16.98 | 0.61 | 4.47 | 0.8359 | 0.0536 | |||
| HOLX / Hologic, Inc. | 0.01 | 6.01 | 0.59 | 11.91 | 0.8132 | 0.1015 | |||
| DGX / Quest Diagnostics Incorporated | 0.00 | -35.50 | 0.58 | -31.57 | 0.8014 | -0.3439 | |||
| TROW / T. Rowe Price Group, Inc. | 0.01 | -25.00 | 0.58 | -21.22 | 0.8006 | -0.1939 | |||
| TKR / The Timken Company | 0.01 | 6.79 | 0.57 | 7.82 | 0.7766 | 0.0716 | |||
| CNC / Centene Corporation | 0.01 | -4.84 | 0.56 | -14.96 | 0.7652 | -0.1149 | |||
| VTR / Ventas, Inc. | 0.01 | -12.49 | 0.56 | -19.62 | 0.7650 | -0.1665 | |||
| AD / Koninklijke Ahold Delhaize N.V. | 0.01 | -43.54 | 0.55 | -36.85 | 0.7486 | -0.4120 | |||
| HEN3 / Henkel AG & Co. KGaA - Preferred Stock | 0.01 | -5.38 | 0.54 | -6.53 | 0.7476 | -0.0353 | |||
| MHK / Mohawk Industries, Inc. | 0.01 | 2.15 | 0.54 | -6.22 | 0.7462 | -0.0324 | |||
| GIS / General Mills, Inc. | 0.01 | -7.97 | 0.54 | -20.18 | 0.7442 | -0.1690 | |||
| EXP / Eagle Materials Inc. | 0.00 | 102.35 | 0.54 | 84.59 | 0.7405 | 0.3473 | |||
| IPG / The Interpublic Group of Companies, Inc. | 0.02 | 0.00 | 0.53 | -9.83 | 0.7311 | -0.0627 | |||
| OMC / Omnicom Group Inc. | 0.01 | 6.46 | 0.52 | -7.69 | 0.7091 | -0.0421 | |||
| HEIA / Heineken N.V. | 0.01 | -7.99 | 0.51 | -1.55 | 0.6988 | 0.0041 | |||
| PPG / PPG Industries, Inc. | 0.00 | 7.78 | 0.51 | 12.20 | 0.6947 | 0.0883 | |||
| NVST / Envista Holdings Corporation | 0.03 | -10.89 | 0.50 | 0.81 | 0.6815 | 0.0204 | |||
| BK / The Bank of New York Mellon Corporation | 0.01 | -45.37 | 0.49 | -40.75 | 0.6739 | -0.4373 | |||
| ABM / ABM Industries Incorporated | 0.01 | -6.79 | 0.47 | -7.07 | 0.6499 | -0.0345 | |||
| EMR / Emerson Electric Co. | 0.00 | -29.78 | 0.47 | -14.55 | 0.6455 | -0.0943 | |||
| OXY / Occidental Petroleum Corporation | 0.01 | 4.58 | 0.46 | -10.96 | 0.6360 | -0.0632 | |||
| BWA / BorgWarner Inc. | 0.01 | -7.39 | 0.46 | 8.33 | 0.6247 | 0.0599 | |||
| HXL / Hexcel Corporation | 0.01 | 0.45 | 0.6237 | 0.6237 | |||||
| FANG / Diamondback Energy, Inc. | 0.00 | 40.03 | 0.44 | 20.17 | 0.5985 | 0.1118 | |||
| AOS / A. O. Smith Corporation | 0.01 | 12.08 | 0.43 | 12.53 | 0.5921 | 0.0768 | |||
| UHS / Universal Health Services, Inc. | 0.00 | -17.16 | 0.42 | -20.08 | 0.5796 | -0.1306 | |||
| ALL / The Allstate Corporation | 0.00 | -50.05 | 0.42 | -51.46 | 0.5715 | -0.5801 | |||
| TTC / The Toro Company | 0.01 | 0.41 | 0.5695 | 0.5695 | |||||
| THG / The Hanover Insurance Group, Inc. | 0.00 | -13.13 | 0.41 | -15.16 | 0.5692 | -0.0874 | |||
| VNX / NXP Semiconductors N.V. | 0.00 | 0.41 | 0.5588 | 0.5588 | |||||
| WABC / Westamerica Bancorporation | 0.01 | 9.55 | 0.40 | 4.71 | 0.5498 | 0.0365 | |||
| ML / Compagnie Générale des Établissements Michelin Société en commandite par actions | 0.01 | 41.95 | 0.40 | 37.98 | 0.5446 | 0.1965 | |||
| RJF / Raymond James Financial, Inc. | 0.00 | 0.39 | 0.5371 | 0.5371 | |||||
| SW / Sodexo S.A. | 0.01 | 111.86 | 0.39 | 44.98 | 0.5356 | 0.1885 | |||
| LR / Legrand SA | 0.00 | 53.92 | 0.39 | 95.48 | 0.5341 | 0.2658 | |||
| AKZA / Akzo Nobel N.V. | 0.01 | -39.79 | 0.38 | -31.45 | 0.5185 | -0.2212 | |||
| FFIV / F5, Inc. | 0.00 | -2.21 | 0.36 | 8.01 | 0.5002 | 0.0473 | |||
| MDLZ / Mondelez International, Inc. | 0.01 | -45.98 | 0.36 | -46.34 | 0.4932 | -0.4057 | |||
| DG / Vinci SA | 0.00 | -56.07 | 0.36 | -48.56 | 0.4917 | -0.4446 | |||
| IJF / ICON Public Limited Company | 0.00 | 0.00 | 0.35 | -16.79 | 0.4766 | -0.0845 | |||
| AHT / Ashtead Group plc | 0.01 | 0.34 | 0.4720 | 0.4720 | |||||
| GNTX / Gentex Corporation | 0.02 | 18.48 | 0.33 | 11.86 | 0.4532 | 0.0566 | |||
| COR / Cencora, Inc. | 0.00 | -69.16 | 0.28 | -66.78 | 0.3865 | -0.7510 | |||
| ADC / Agree Realty Corporation | 0.00 | -38.01 | 0.26 | -41.23 | 0.3543 | -0.2366 | |||
| ESS / Essex Property Trust, Inc. | 0.00 | -37.02 | 0.26 | -41.86 | 0.3540 | -0.2411 | |||
| PHM / PulteGroup, Inc. | 0.00 | 0.22 | 0.2992 | 0.2992 | |||||
| REG / Regency Centers Corporation | 0.00 | -5.54 | 0.20 | -8.64 | 0.2766 | -0.0201 | |||
| DOV / Dover Corporation | 0.00 | -43.39 | 0.19 | -40.98 | 0.2659 | -0.1747 | |||
| 1JL / Gates Industrial Corporation plc | 0.01 | 19.69 | 0.19 | 50.00 | 0.2600 | 0.0901 | |||
| FHB / First Hawaiian, Inc. | 0.01 | -51.67 | 0.19 | -50.79 | 0.2563 | -0.2518 | |||
| PPL / PPL Corporation | 0.01 | -70.45 | 0.18 | -72.29 | 0.2531 | -0.6401 | |||
| QGEN / Qiagen N.V. | 0.00 | 0.17 | 0.2306 | 0.2306 | |||||
| FTV / Fortive Corporation | 0.00 | 0.16 | 0.2180 | 0.2180 | |||||
| DUK / Duke Energy Corporation | 0.00 | -69.28 | 0.15 | -66.51 | 0.2017 | -0.3717 | |||
| ADI / Analog Devices, Inc. | 0.00 | 0.15 | 0.2006 | 0.2006 | |||||
| RSG / Republic Services, Inc. | 0.00 | -67.43 | 0.11 | -66.87 | 0.1486 | -0.2899 | |||
| RAL / Ralliant Corporation | 0.00 | 0.05 | 0.0676 | 0.0676 | |||||
| WEIR / The Weir Group PLC | 0.00 | -100.00 | 0.00 | -100.00 | -0.2995 | ||||
| GBP/USD FORWARD / DFE (000000000) | -0.01 | -0.0194 | -0.0194 | ||||||
| GBP/USD FORWARD / DFE (000000000) | -0.01 | -0.0195 | -0.0195 | ||||||
| BA.C / Bank of America Corporation - Depositary Receipt (Common Stock) | -0.01 | -0.0196 | -0.0196 | ||||||
| DE000C4SA6R6 / EURO STOXX 50 Index | -0.02 | -0.0247 | -0.0247 | ||||||
| USD/EUR FORWARD / DFE (000000000) | -0.02 | -0.0252 | -0.0252 | ||||||
| EUR/USD FORWARD / DFE (000000000) | -0.02 | -0.0253 | -0.0253 | ||||||
| EUR/USD FORWARD / DFE (000000000) | -0.02 | -0.0262 | -0.0262 |