Mga Batayang Estadistika
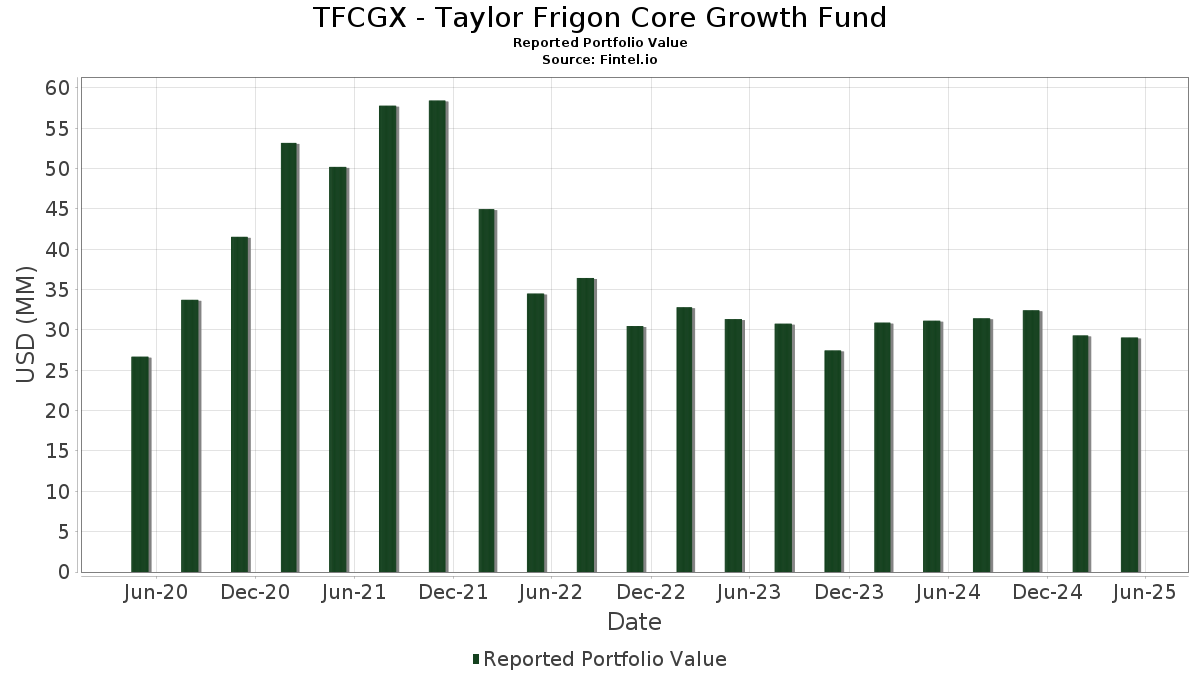
| Nilai Portofolio | $ 29,056,817 |
| Posisi Saat Ini | 49 |
Kepemilikan Terbaru, Kinerja, AUM (dari 13F, 13D)
TFCGX - Taylor Frigon Core Growth Fund telah mengungkapkan total kepemilikan 49 dalam pengajuan SEC terbaru mereka. Nilai portofolio terbaru dihitung sebesar $ 29,056,817 USD. Aset yang Dikelola (AUM) sebenarnya adalah nilai ini ditambah kas (yang tidak diungkapkan). Aset-aset utama TFCGX - Taylor Frigon Core Growth Fund adalah Carvana Co. (US:CVNA) , Monolithic Power Systems, Inc. (US:MPWR) , Procore Technologies, Inc. (US:PCOR) , Fiverr International Ltd. (US:FVRR) , and Boot Barn Holdings, Inc. (US:BOOT) .
Peningkatan Tertinggi Kuartal Ini
Kami menggunakan perubahan dalam alokasi portofolio karena ini adalah metrik yang paling bermakna. Perubahan dapat disebabkan oleh perdagangan atau perubahan harga saham.
| Keamanan | Saham (MM) |
Nilai (Juta Dolar AS) |
Portfolio % | ΔPorsyento ng Portfolio |
|---|---|---|---|---|
| 0.80 | 0.80 | 2.7700 | 1.8600 | |
| 0.01 | 0.72 | 2.4700 | 1.5200 | |
| 0.01 | 0.74 | 2.5600 | 1.0900 | |
| 0.02 | 0.67 | 2.3000 | 0.8500 | |
| 0.01 | 0.81 | 2.7800 | 0.6700 | |
| 0.01 | 0.47 | 1.6200 | 0.6100 | |
| 0.01 | 0.45 | 1.5600 | 0.6100 | |
| 0.01 | 0.79 | 2.7100 | 0.5700 | |
| 0.00 | 1.02 | 3.5200 | 0.5000 | |
| 0.03 | 0.82 | 2.8100 | 0.5000 |
Penurunan Tertinggi Kuartal Ini
Kami menggunakan perubahan dalam alokasi portofolio karena ini adalah metrik yang paling bermakna. Perubahan dapat disebabkan oleh perdagangan atau perubahan harga saham.
| Keamanan | Saham (MM) |
Nilai (Juta Dolar AS) |
Portfolio % | ΔPorsyento ng Portfolio |
|---|---|---|---|---|
| 0.00 | 0.60 | 2.0800 | -1.5000 | |
| 0.00 | 0.62 | 2.1200 | -0.6600 | |
| 0.03 | 0.49 | 1.6800 | -0.5800 | |
| 0.03 | 0.35 | 1.2000 | -0.5800 | |
| 0.00 | 0.42 | 1.4300 | -0.4900 | |
| 0.05 | 0.55 | 1.9000 | -0.4200 | |
| 0.01 | 0.85 | 2.9300 | -0.3800 | |
| 0.24 | 0.36 | 1.2300 | -0.3600 | |
| 0.00 | 0.57 | 1.9600 | -0.3300 | |
| 0.05 | 0.42 | 1.4600 | -0.3300 |
Pengajuan 13F dan Dana
Formulir ini diajukan pada 2025-07-08 untuk periode pelaporan 2025-05-31. Klik ikon tautan untuk melihat riwayat transaksi selengkapnya.
Tingkatkan ke versi premium untuk membuka data premium dan ekspor ke Excel. ![]() .
.
| Keamanan | Ketik | Harga Saham Rata-rata | Saham (MM) |
ΔSaham (%) |
ΔSaham (%) |
Nilai ($MM) |
Portpolyo (%) |
ΔPortofolio (%) |
|
|---|---|---|---|---|---|---|---|---|---|
| CVNA / Carvana Co. | 0.00 | -17.64 | 1.02 | 15.61 | 3.5200 | 0.5000 | |||
| MPWR / Monolithic Power Systems, Inc. | 0.00 | -12.53 | 0.86 | -5.19 | 2.9600 | -0.1400 | |||
| PCOR / Procore Technologies, Inc. | 0.01 | 0.00 | 0.85 | -12.09 | 2.9300 | -0.3800 | |||
| FVRR / Fiverr International Ltd. | 0.03 | 0.00 | 0.82 | 20.53 | 2.8100 | 0.5000 | |||
| BOOT / Boot Barn Holdings, Inc. | 0.01 | 0.00 | 0.81 | 31.01 | 2.7800 | 0.6700 | |||
| GOIXX / Federated Hermes Money Market Obligations Trust - Federated Hermes Gov Oblig Fd Inst Shs USD | 0.80 | 203.01 | 0.80 | 203.40 | 2.7700 | 1.8600 | |||
| NET / Cloudflare, Inc. | 0.00 | 0.00 | 0.79 | 14.20 | 2.7200 | 0.3600 | |||
| GKOS / Glaukos Corporation | 0.01 | 60.31 | 0.79 | 25.92 | 2.7100 | 0.5700 | |||
| CRDO / Credo Technology Group Holding Ltd | 0.01 | 56.15 | 0.74 | 72.56 | 2.5600 | 1.0900 | |||
| PI / Impinj, Inc. | 0.01 | 0.00 | 0.72 | 18.09 | 2.4700 | 0.3900 | |||
| ALAB / Astera Labs, Inc. | 0.01 | 110.56 | 0.72 | 157.35 | 2.4700 | 1.5200 | |||
| ALKT / Alkami Technology, Inc. | 0.03 | 25.11 | 0.72 | 16.18 | 2.4700 | 0.3600 | |||
| IDXX / IDEXX Laboratories, Inc. | 0.00 | 0.00 | 0.70 | 17.36 | 2.4200 | 0.3700 | |||
| DXCM / DexCom, Inc. | 0.01 | 0.00 | 0.70 | -2.90 | 2.4200 | -0.0500 | |||
| MBLY / Mobileye Global Inc. | 0.04 | 0.00 | 0.70 | 3.09 | 2.4200 | 0.1000 | |||
| TMDX / TransMedics Group, Inc. | 0.01 | -33.87 | 0.68 | 10.10 | 2.3300 | 0.2300 | |||
| TOST / Toast, Inc. | 0.02 | 43.86 | 0.67 | 57.18 | 2.3000 | 0.8500 | |||
| MNDY / monday.com Ltd. | 0.00 | 0.00 | 0.66 | 0.30 | 2.2700 | 0.0200 | |||
| NICE / NICE Ltd. - Depositary Receipt (Common Stock) | 0.00 | 0.00 | 0.65 | 19.19 | 2.2300 | 0.3800 | |||
| BROS / Dutch Bros Inc. | 0.01 | 17.42 | 0.64 | 7.05 | 2.2000 | 0.1600 | |||
| TW / Tradeweb Markets Inc. | 0.00 | -29.01 | 0.62 | -24.23 | 2.1200 | -0.6600 | |||
| PSTG / Pure Storage, Inc. | 0.01 | 0.00 | 0.60 | 2.03 | 2.0800 | 0.0600 | |||
| CYBR / CyberArk Software Ltd. | 0.00 | -45.33 | 0.60 | -42.46 | 2.0800 | -1.5000 | |||
| TSEM / Tower Semiconductor Ltd. | 0.02 | 0.00 | 0.60 | -7.10 | 2.0700 | -0.1500 | |||
| EW / Edwards Lifesciences Corporation | 0.01 | 0.00 | 0.58 | 9.18 | 2.0100 | 0.1900 | |||
| SYM / Symbotic Inc. | 0.02 | 0.00 | 0.58 | 26.36 | 2.0000 | 0.4300 | |||
| KLAC / KLA Corporation | 0.00 | 12.46 | 0.58 | 20.08 | 2.0000 | 0.3500 | |||
| PRCT / PROCEPT BioRobotics Corporation | 0.01 | 0.00 | 0.57 | -9.91 | 1.9800 | -0.1900 | |||
| CBZ / CBIZ, Inc. | 0.01 | 0.00 | 0.57 | -7.58 | 1.9800 | -0.1400 | |||
| EPAM / EPAM Systems, Inc. | 0.00 | 0.00 | 0.57 | -15.48 | 1.9600 | -0.3300 | |||
| TTAN / ServiceTitan, Inc. | 0.01 | -22.50 | 0.57 | -9.71 | 1.9600 | -0.1900 | |||
| KRNT / Kornit Digital Ltd. | 0.03 | 0.00 | 0.56 | -11.99 | 1.9200 | -0.2500 | |||
| CLPT / ClearPoint Neuro, Inc. | 0.05 | 0.00 | 0.55 | -18.70 | 1.9000 | -0.4200 | |||
| MDB / MongoDB, Inc. | 0.00 | 27.14 | 0.54 | -10.32 | 1.8600 | -0.1900 | |||
| BILL / BILL Holdings, Inc. | 0.01 | 64.68 | 0.50 | 30.31 | 1.7300 | 0.4100 | |||
| NSSC / Napco Security Technologies, Inc. | 0.02 | 0.00 | 0.50 | 13.76 | 1.7100 | 0.2200 | |||
| NVCR / NovoCure Limited | 0.03 | -26.24 | 0.49 | -26.06 | 1.6800 | -0.5800 | |||
| GTLB / GitLab Inc. | 0.01 | 111.26 | 0.47 | 59.86 | 1.6200 | 0.6100 | |||
| MRVL / Marvell Technology, Inc. | 0.01 | 147.72 | 0.45 | 62.23 | 1.5600 | 0.6100 | |||
| CAMT / Camtek Ltd. | 0.01 | 0.00 | 0.44 | -10.71 | 1.5200 | -0.1700 | |||
| LUCK / Lucky Strike Entertainment Corporation | 0.05 | 0.00 | 0.42 | -19.31 | 1.4600 | -0.3300 | |||
| WIX / Wix.com Ltd. | 0.00 | 0.00 | 0.42 | -25.71 | 1.4300 | -0.4900 | |||
| ONTO / Onto Innovation Inc. | 0.00 | 37.83 | 0.37 | -13.02 | 1.2900 | -0.1800 | |||
| CGEN / Compugen Ltd. | 0.24 | 0.00 | 0.36 | -23.39 | 1.2300 | -0.3600 | |||
| INMD / InMode Ltd. | 0.02 | 0.00 | 0.35 | -21.73 | 1.2200 | -0.3200 | |||
| GDYN / Grid Dynamics Holdings, Inc. | 0.03 | 0.00 | 0.35 | -33.52 | 1.2000 | -0.5800 | |||
| QUIK / QuickLogic Corporation | 0.07 | 0.00 | 0.34 | -15.89 | 1.1900 | -0.2100 | |||
| VUZI / Vuzix Corporation | 0.08 | 0.00 | 0.24 | -1.23 | 0.8300 | -0.0100 | |||
| APYX / Apyx Medical Corporation | 0.13 | 0.00 | 0.21 | 7.85 | 0.7100 | 0.0600 |