Mga Batayang Estadistika
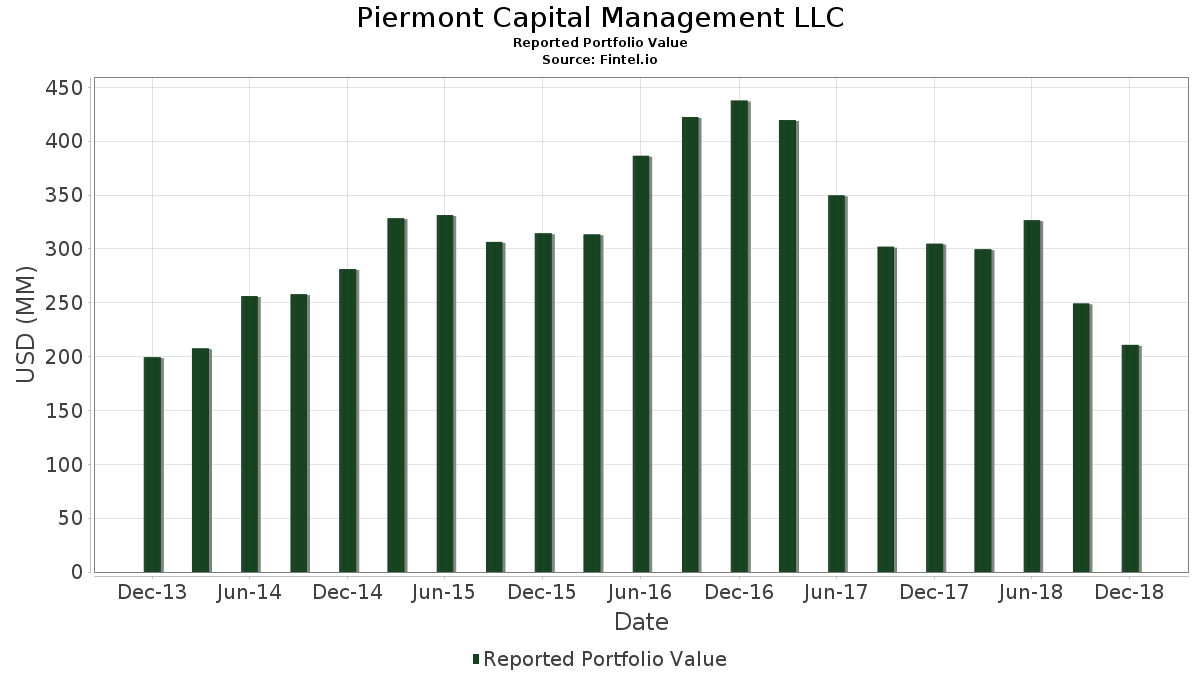
| Nilai Portofolio | $ 210,876,000 |
| Posisi Saat Ini | 108 |
Kepemilikan Terbaru, Kinerja, AUM (dari 13F, 13D)
Piermont Capital Management LLC telah mengungkapkan total kepemilikan 108 dalam pengajuan SEC terbaru mereka. Nilai portofolio terbaru dihitung sebesar $ 210,876,000 USD. Aset yang Dikelola (AUM) sebenarnya adalah nilai ini ditambah kas (yang tidak diungkapkan). Aset-aset utama Piermont Capital Management LLC adalah Portland General Electric Company (US:POR) , Tech Data Corp. (US:TECD) , First Citizens BancShares, Inc. (US:FCNCA) , Ciena Corporation (US:CIEN) , and American Equity Investment Life Holding Company (US:AEL) . Posisi baru Piermont Capital Management LLC meliputi: Jabil Inc. (US:JBL) , Assured Guaranty Ltd. (US:AGO) , Ladder Capital Corp (US:LADR) , Hancock Whitney Corporation (US:HWC) , and Diodes Incorporated (US:DIOD) .
Peningkatan Tertinggi Kuartal Ini
Kami menggunakan perubahan dalam alokasi portofolio karena ini adalah metrik yang paling bermakna. Perubahan dapat disebabkan oleh perdagangan atau perubahan harga saham.
| Keamanan | Saham (MM) |
Nilai (Juta Dolar AS) |
Portfolio % | ΔPorsyento ng Portfolio |
|---|---|---|---|---|
| 0.07 | 3.10 | 1.4710 | 1.4710 | |
| 0.04 | 3.04 | 1.4430 | 1.4430 | |
| 0.09 | 3.00 | 1.4212 | 1.4212 | |
| 0.11 | 2.82 | 1.3373 | 1.3373 | |
| 0.00 | 2.76 | 1.3088 | 1.3088 | |
| 0.20 | 2.60 | 1.2320 | 1.2320 | |
| 0.10 | 2.57 | 1.2183 | 1.2183 | |
| 0.03 | 2.53 | 1.2017 | 1.2017 | |
| 0.05 | 2.52 | 1.1926 | 1.1926 | |
| 0.07 | 2.44 | 1.1580 | 1.1580 |
Penurunan Tertinggi Kuartal Ini
Kami menggunakan perubahan dalam alokasi portofolio karena ini adalah metrik yang paling bermakna. Perubahan dapat disebabkan oleh perdagangan atau perubahan harga saham.
| Keamanan | Saham (MM) |
Nilai (Juta Dolar AS) |
Portfolio % | ΔPorsyento ng Portfolio |
|---|---|---|---|---|
| 0.00 | 0.00 | -1.3813 | ||
| 0.00 | 0.00 | -1.2349 | ||
| 0.00 | 0.00 | -1.0705 | ||
| 0.00 | 0.00 | -1.0476 | ||
| 0.00 | 0.00 | -0.9277 | ||
| 0.00 | 0.00 | -0.7468 | ||
| 0.00 | 0.00 | -0.6738 | ||
| 0.00 | 0.00 | -0.5479 | ||
| 0.29 | 1.55 | 0.7374 | -0.3776 | |
| 0.10 | 1.45 | 0.6862 | -0.3606 |
Pengajuan 13F dan Dana
Formulir ini diajukan pada 2019-02-13 untuk periode pelaporan 2018-12-31. Klik ikon tautan untuk melihat riwayat transaksi selengkapnya.
Tingkatkan ke versi premium untuk membuka data premium dan ekspor ke Excel. ![]() .
.
| Keamanan | Ketik | Harga Saham Rata-rata | Saham (MM) |
ΔSaham (%) |
ΔSaham (%) |
Nilai ($MM) |
Portpolyo (%) |
ΔPortofolio (%) |
|
|---|---|---|---|---|---|---|---|---|---|
| POR / Portland General Electric Company | 0.07 | 0.79 | 3.10 | 1.31 | 1.4710 | 1.4710 | |||
| TECD / Tech Data Corp. | 0.04 | 1.36 | 3.04 | 15.84 | 1.4430 | 1.4430 | |||
| FCNCA / First Citizens BancShares, Inc. | 0.01 | 1.91 | 3.02 | -15.06 | 1.4312 | 0.0061 | |||
| CIEN / Ciena Corporation | 0.09 | 1.96 | 3.00 | 10.67 | 1.4212 | 1.4212 | |||
| AEL / American Equity Investment Life Holding Company | 0.11 | -1.16 | 2.99 | -21.89 | 1.4160 | -0.1174 | |||
| PNM / PNM Resources, Inc. | 0.07 | 20.41 | 2.95 | 25.45 | 1.4003 | 0.4562 | |||
| SR / Spire Inc. | 0.04 | 31.29 | 2.87 | 32.23 | 1.3619 | 0.4908 | |||
| NSA / National Storage Affiliates Trust | 0.11 | 13.91 | 2.82 | 18.49 | 1.3373 | 1.3373 | |||
| ENS / EnerSys | 0.04 | 3.13 | 2.81 | -8.13 | 1.3335 | 0.1058 | |||
| SWX / Southwest Gas Holdings, Inc. | 0.04 | 4.79 | 2.79 | 1.42 | 1.3254 | 0.2200 | |||
| LRN / Stride, Inc. | 0.11 | 4.94 | 2.79 | 47.00 | 1.3245 | 0.5624 | |||
| GHC / Graham Holdings Company | 0.00 | 1.77 | 2.76 | 12.52 | 1.3088 | 1.3088 | |||
| AAN / The Aaron's Company, Inc. | 0.07 | -1.35 | 2.76 | -23.85 | 1.3069 | -0.1446 | |||
| REXR / Rexford Industrial Realty, Inc. | 0.09 | -0.69 | 2.75 | -8.45 | 1.3055 | 0.0994 | |||
| BDN / Brandywine Realty Trust | 0.20 | 12.72 | 2.60 | -7.71 | 1.2320 | 1.2320 | |||
| BANR / Banner Corporation | 0.05 | 1.04 | 2.60 | -13.07 | 1.2306 | 0.0333 | |||
| ITT / ITT Inc. | 0.05 | 2.11 | 2.57 | -19.54 | 1.2201 | -0.0625 | |||
| JBL / Jabil Inc. | 0.10 | 2.57 | 1.2183 | 1.2183 | |||||
| MOG.A / Moog Inc. | 0.03 | 1.55 | 2.53 | -8.49 | 1.2017 | 1.2017 | |||
| TCBI / Texas Capital Bancshares, Inc. | 0.05 | 2.52 | 1.1926 | 1.1926 | |||||
| SAFM / Sanderson Farms, Inc. | 0.03 | -2.98 | 2.49 | -6.81 | 1.1813 | 0.1092 | |||
| UMBF / UMB Financial Corporation | 0.04 | -0.63 | 2.49 | -14.55 | 1.1808 | 0.0120 | |||
| ARCB / ArcBest Corporation | 0.07 | -0.97 | 2.44 | -30.13 | 1.1580 | 1.1580 | |||
| FCN / FTI Consulting, Inc. | 0.04 | 1.40 | 2.41 | -7.67 | 1.1410 | 0.0957 | |||
| CLDT / Chatham Lodging Trust | 0.14 | 2.29 | 2.40 | -13.43 | 1.1400 | 1.1400 | |||
| IBOC / International Bancshares Corporation | 0.07 | 0.94 | 2.40 | -22.84 | 1.1372 | 1.1372 | |||
| PRGS / Progress Software Corporation | 0.07 | -0.07 | 2.39 | 0.46 | 1.1329 | 0.1791 | |||
| RYN / Rayonier Inc. | 0.09 | 0.00 | 2.38 | -18.12 | 1.1272 | 1.1272 | |||
| STAG / STAG Industrial, Inc. | 0.10 | 0.84 | 2.38 | -8.75 | 1.1272 | 0.0824 | |||
| GTN / Gray Media, Inc. | 0.16 | 3.27 | 2.37 | -13.02 | 1.1244 | 1.1244 | |||
| KN / Knowles Corporation | 0.18 | 22.60 | 2.37 | -1.82 | 1.1234 | 1.1234 | |||
| ARI / Apollo Commercial Real Estate Finance, Inc. | 0.14 | 0.86 | 2.35 | -10.94 | 1.1158 | 1.1158 | |||
| AGO / Assured Guaranty Ltd. | 0.06 | 2.35 | 1.1130 | 1.1130 | |||||
| LADR / Ladder Capital Corp | 0.15 | 2.34 | 1.1101 | 1.1101 | |||||
| WTFC / Wintrust Financial Corporation | 0.04 | 1.73 | 2.34 | -20.38 | 1.1097 | -0.0691 | |||
| PIPR / Piper Sandler Companies | 0.04 | 33.25 | 2.34 | 14.89 | 1.1087 | 1.1087 | |||
| ITGR / Integer Holdings Corporation | 0.03 | 2.33 | 1.1035 | 1.1035 | |||||
| WD / Walker & Dunlop, Inc. | 0.05 | 22.98 | 2.32 | 0.56 | 1.0983 | 1.0983 | |||
| LXP / LXP Industrial Trust | 0.28 | 2.30 | 1.0912 | 1.0912 | |||||
| TMHC / Taylor Morrison Home Corporation | 0.14 | 19.13 | 2.30 | 4.98 | 1.0897 | 1.0897 | |||
| BKU / BankUnited, Inc. | 0.08 | 2.00 | 2.29 | -13.74 | 1.0864 | 1.0864 | |||
| SCL / Stepan Company | 0.03 | 3.77 | 2.24 | -11.74 | 1.0627 | 0.0444 | |||
| US7587501039 / Regal-Beloit Corp. | 0.03 | 1.60 | 2.22 | -13.70 | 1.0546 | 0.0210 | |||
| USM / United States Cellular Corporation | 0.04 | 6.38 | 2.21 | 23.42 | 1.0471 | 1.0471 | |||
| ESNT / Essent Group Ltd. | 0.06 | 68.22 | 2.19 | 29.96 | 1.0409 | 1.0409 | |||
| SBRA / Sabra Health Care REIT, Inc. | 0.13 | 1.45 | 2.19 | -27.69 | 1.0404 | 1.0404 | |||
| EFII / Electronics For Imaging, Inc. | 0.09 | 1.96 | 2.19 | -25.81 | 1.0376 | -0.1452 | |||
| ENR / Energizer Holdings, Inc. | 0.05 | -1.77 | 2.19 | -24.39 | 1.0362 | -0.1230 | |||
| HWC / Hancock Whitney Corporation | 0.06 | 2.15 | 1.0215 | 1.0215 | |||||
| DIOD / Diodes Incorporated | 0.07 | 2.11 | 0.9996 | 0.9996 | |||||
| IBKC / IBERIABANK Corp. | 0.03 | 2.10 | 0.9958 | 0.9958 | |||||
| SLGN / Silgan Holdings Inc. | 0.09 | 0.00 | 2.09 | -15.03 | 0.9916 | 0.9916 | |||
| FBC / Flagstar Bancorp, Inc. | 0.08 | 0.00 | 2.08 | -16.11 | 0.9878 | 0.9878 | |||
| SFNC / Simmons First National Corporation | 0.09 | 1.43 | 2.06 | -16.92 | 0.9755 | -0.0176 | |||
| MSTR / Strategy Inc | 0.02 | 28.07 | 2.05 | 16.39 | 0.9731 | 0.9731 | |||
| SANM / Sanmina Corporation | 0.09 | 1.31 | 2.05 | -11.71 | 0.9726 | 0.9726 | |||
| OFC / Corporate Office Properties Trust | 0.10 | 1.31 | 2.03 | -28.60 | 0.9627 | -0.1776 | |||
| MCS / The Marcus Corporation | 0.05 | 18.84 | 2.02 | 11.63 | 0.9560 | 0.9560 | |||
| RXN / Rexnord Corp | 0.09 | 0.00 | 1.99 | -25.49 | 0.9413 | 0.9413 | |||
| WSFS / WSFS Financial Corporation | 0.05 | 1.96 | 0.9295 | 0.9295 | |||||
| FIBK / First Interstate BancSystem, Inc. | 0.05 | 0.00 | 1.94 | -18.39 | 0.9219 | -0.0335 | |||
| UCBI / United Community Banks, Inc. | 0.09 | -2.90 | 1.93 | -25.28 | 0.9167 | -0.1210 | |||
| HTLF / Heartland Financial USA, Inc. | 0.04 | 0.00 | 1.92 | -24.28 | 0.9110 | 0.9110 | |||
| GNL / Global Net Lease, Inc. | 0.11 | 1.89 | 0.8939 | 0.8939 | |||||
| NR / NPK International Inc. | 0.27 | 1.95 | 1.87 | -32.32 | 0.8849 | -0.2209 | |||
| WLL / Whiting Petroleum Corp (New) | 0.08 | 1.82 | 0.8635 | 0.8635 | |||||
| SCHN / Schnitzer Steel Industries, Inc. - Class A | 0.08 | 1.61 | 1.77 | -19.07 | 0.8394 | 0.8394 | |||
| ECHO / Echo Global Logistics Inc | 0.09 | -1.08 | 1.76 | -35.02 | 0.8351 | -0.2519 | |||
| TILE / Interface, Inc. | 0.12 | 32.87 | 1.76 | -18.92 | 0.8332 | 0.8332 | |||
| GCI / Gannett Co., Inc. | 0.20 | 3.14 | 1.71 | -12.10 | 0.8095 | 0.8095 | |||
| DENN / Denny's Corporation | 0.10 | 65.56 | 1.66 | 82.42 | 0.7872 | 0.7872 | |||
| HZO / MarineMax, Inc. | 0.09 | 1.96 | 1.62 | -12.15 | 0.7677 | 0.7677 | |||
| HLX / Helix Energy Solutions Group, Inc. | 0.29 | 2.13 | 1.55 | -44.06 | 0.7374 | -0.3776 | |||
| US7438151026 / Providence Service Corp. (The) | 0.03 | 3.72 | 1.51 | -7.43 | 0.7146 | 0.7146 | |||
| SJW / SJW Group | 0.03 | 1.50 | 0.7113 | 0.7113 | |||||
| TOWR / Tower International, Inc. | 0.06 | 21.59 | 1.49 | -4.36 | 0.7071 | 0.7071 | |||
| EXTN / Exterran Corp | 0.08 | 0.00 | 1.46 | -33.27 | 0.6942 | 0.6942 | |||
| MTX / Minerals Technologies Inc. | 0.03 | 4.03 | 1.46 | -20.98 | 0.6914 | -0.0486 | |||
| / UNIT Corporation | 0.10 | 1.20 | 1.45 | -44.56 | 0.6862 | -0.3606 | |||
| MANT / Mantech International Corp - Class A | 0.03 | 1.38 | 0.6530 | 0.6530 | |||||
| US00163U1060 / AMAG Pharmaceuticals, Inc. | 0.09 | 2.28 | 1.37 | -22.30 | 0.6478 | -0.0573 | |||
| TCBK / TriCo Bancshares | 0.04 | 2.55 | 1.36 | -10.23 | 0.6449 | 0.0373 | |||
| ETD / Ethan Allen Interiors Inc. | 0.08 | 0.00 | 1.35 | -15.24 | 0.6383 | 0.6383 | |||
| ANIK / Anika Therapeutics, Inc. | 0.04 | 2.04 | 1.34 | -18.66 | 0.6369 | -0.0253 | |||
| BHR / Braemar Hotels & Resorts Inc. | 0.15 | 3.90 | 1.33 | -21.12 | 0.6321 | 0.6321 | |||
| RMBS / Rambus Inc. | 0.17 | -1.44 | 1.31 | -30.68 | 0.6236 | -0.1373 | |||
| TRS / TriMas Corporation | 0.05 | 1.29 | 0.6127 | 0.6127 | |||||
| CBZ / CBIZ, Inc. | 0.07 | 0.00 | 1.29 | -16.87 | 0.6122 | 0.6122 | |||
| CPF / Central Pacific Financial Corp. | 0.05 | 3.76 | 1.28 | -4.42 | 0.6056 | 0.0697 | |||
| US40449J1034 / The Habit Restaurants, Inc. | 0.12 | 1.27 | 0.6013 | 0.6013 | |||||
| BANF / BancFirst Corporation | 0.03 | 0.00 | 1.27 | -16.75 | 0.6008 | -0.0096 | |||
| / Gulfport Energy Corp. | 0.19 | 0.00 | 1.26 | -37.10 | 0.5989 | 0.5989 | |||
| COHU / Cohu, Inc. | 0.08 | 1.26 | 0.5980 | 0.5980 | |||||
| RLGY / Realogy Holdings Corp | 0.08 | -0.67 | 1.24 | -29.32 | 0.5875 | 0.5875 | |||
| TBBK / The Bancorp, Inc. | 0.16 | 4.72 | 1.24 | -13.07 | 0.5866 | 0.0159 | |||
| CONN / Conn's, Inc. | 0.06 | 37.74 | 1.22 | -26.54 | 0.5776 | 0.5776 | |||
| US5537771033 / MTS Systems Corporation | 0.03 | 0.00 | 1.17 | -26.70 | 0.5534 | 0.5534 | |||
| US6821631008 / On Deck Capital, Inc. | 0.19 | 1.13 | 0.5344 | 0.5344 | |||||
| NBHC / National Bank Holdings Corporation | 0.04 | -4.95 | 1.11 | -22.12 | 0.5259 | 0.5259 | |||
| IBCP / Independent Bank Corporation | 0.05 | 4.61 | 1.05 | -7.00 | 0.4974 | 0.0450 | |||
| MGLN / Magellan Health Inc | 0.02 | -6.14 | 1.04 | -25.90 | 0.4951 | -0.0701 | |||
| CVLG / Covenant Logistics Group, Inc. | 0.05 | 0.00 | 1.00 | -33.97 | 0.4747 | 0.4747 | |||
| US35352P1049 / Franklin Financial Network Inc. | 0.03 | 0.00 | 0.89 | -32.52 | 0.4202 | 0.4202 | |||
| CNSL / Consolidated Communications Holdings, Inc. | 0.09 | 0.88 | 0.4187 | 0.4187 | |||||
| MGNX / MacroGenics, Inc. | 0.06 | 3.88 | 0.71 | -38.50 | 0.3386 | -0.1271 | |||
| VPG / Vishay Precision Group, Inc. | 0.02 | 0.71 | 0.3381 | 0.3381 | |||||
| TRST / TrustCo Bank Corp NY | 0.10 | -5.00 | 0.70 | -23.32 | 0.3305 | 0.3305 | |||
| LPI / Laredo Petroleum Inc. | 0.18 | -4.76 | 0.64 | -57.78 | 0.3011 | 0.3011 | |||
| FBNC / First Bancorp | 0.00 | -100.00 | 0.00 | -100.00 | 0.0000 | ||||
| TRMK / Trustmark Corporation | 0.00 | -100.00 | 0.00 | -100.00 | -1.0705 | ||||
| ISCB / iShares Trust - iShares Morningstar Small-Cap ETF | 0.00 | -100.00 | 0.00 | -100.00 | 0.0000 | ||||
| APTS / Preferred Apartment Communities Inc - Class A | 0.00 | -100.00 | 0.00 | -100.00 | -1.0476 | ||||
| NSIT / Insight Enterprises, Inc. | 0.00 | -100.00 | 0.00 | -100.00 | -1.2349 | ||||
| VIVO / Meridian Bioscience Inc. | 0.00 | -100.00 | 0.00 | -100.00 | 0.0000 | ||||
| ESIO / Electro Scientific Industries, Inc. | 0.00 | -100.00 | 0.00 | -100.00 | 0.0000 | ||||
| CWT / California Water Service Group | 0.00 | -100.00 | 0.00 | -100.00 | 0.0000 | ||||
| VSH / Vishay Intertechnology, Inc. | 0.00 | -100.00 | 0.00 | -100.00 | -0.9277 | ||||
| NWE / NorthWestern Energy Group, Inc. | 0.00 | -100.00 | 0.00 | -100.00 | 0.0000 | ||||
| EBF / Ennis, Inc. | 0.00 | -100.00 | 0.00 | -100.00 | 0.0000 | ||||
| PARR / Par Pacific Holdings, Inc. | 0.00 | -100.00 | 0.00 | -100.00 | 0.0000 | ||||
| PVAC / Penn Virginia Corp. | 0.00 | -100.00 | 0.00 | -100.00 | 0.0000 | ||||
| CHCT / Community Healthcare Trust Incorporated | 0.00 | -100.00 | 0.00 | -100.00 | 0.0000 | ||||
| TPH / Tri Pointe Homes, Inc. | 0.00 | -100.00 | 0.00 | -100.00 | 0.0000 | ||||
| FHI / Federated Hermes, Inc. | 0.00 | -100.00 | 0.00 | -100.00 | 0.0000 | ||||
| US2168311072 / Cooper Tire & Rubber Co | 0.00 | -100.00 | 0.00 | -100.00 | -0.5479 | ||||
| SIGI / Selective Insurance Group, Inc. | 0.00 | -100.00 | 0.00 | -100.00 | -1.3813 | ||||
| CATY / Cathay General Bancorp | 0.00 | -100.00 | 0.00 | -100.00 | 0.0000 | ||||
| RPT / Rithm Property Trust Inc. | 0.00 | -100.00 | 0.00 | -100.00 | -0.7468 | ||||
| ESL / Esterline Technologies Corp. | 0.00 | -100.00 | 0.00 | -100.00 | -0.6738 | ||||
| XHR / Xenia Hotels & Resorts, Inc. | 0.00 | -100.00 | 0.00 | -100.00 | 0.0000 | ||||
| IWN / iShares Trust - iShares Russell 2000 Value ETF | 0.00 | -100.00 | 0.00 | -100.00 | -0.1067 |