Mga Batayang Estadistika
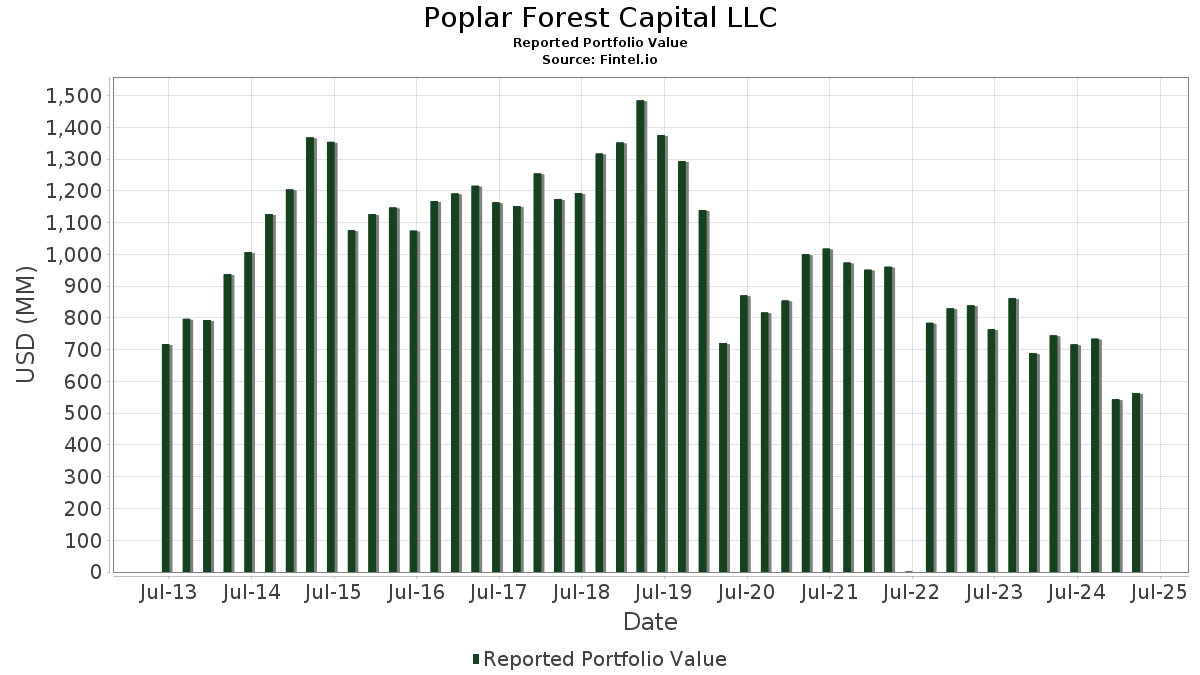
| Nilai Portofolio | $ 562,632,408 |
| Posisi Saat Ini | 52 |
Kepemilikan Terbaru, Kinerja, AUM (dari 13F, 13D)
Poplar Forest Capital LLC telah mengungkapkan total kepemilikan 52 dalam pengajuan SEC terbaru mereka. Nilai portofolio terbaru dihitung sebesar $ 562,632,408 USD. Aset yang Dikelola (AUM) sebenarnya adalah nilai ini ditambah kas (yang tidak diungkapkan). Aset-aset utama Poplar Forest Capital LLC adalah AT&T Inc. (US:T) , CVS Health Corporation (US:CVS) , National Fuel Gas Company (US:NFG) , The Allstate Corporation (US:ALL) , and Equitable Holdings, Inc. (US:EQH) . Posisi baru Poplar Forest Capital LLC meliputi: CACI International Inc (US:CACI) , .
Peningkatan Tertinggi Kuartal Ini
Kami menggunakan perubahan dalam alokasi portofolio karena ini adalah metrik yang paling bermakna. Perubahan dapat disebabkan oleh perdagangan atau perubahan harga saham.
| Keamanan | Saham (MM) |
Nilai (Juta Dolar AS) |
Portfolio % | ΔPorsyento ng Portfolio |
|---|---|---|---|---|
| 0.46 | 31.37 | 5.5764 | 2.4034 | |
| 0.14 | 17.07 | 3.0345 | 1.9978 | |
| 0.02 | 5.71 | 1.0148 | 1.0148 | |
| 0.02 | 5.28 | 0.9377 | 0.9377 | |
| 1.13 | 31.87 | 5.6650 | 0.6448 | |
| 0.09 | 24.82 | 4.4115 | 0.6321 | |
| 0.38 | 30.22 | 5.3711 | 0.5848 | |
| 0.40 | 25.75 | 4.5770 | 0.2926 | |
| 0.00 | 0.97 | 0.1727 | 0.1727 | |
| 0.51 | 11.59 | 2.0595 | 0.1243 |
Penurunan Tertinggi Kuartal Ini
Kami menggunakan perubahan dalam alokasi portofolio karena ini adalah metrik yang paling bermakna. Perubahan dapat disebabkan oleh perdagangan atau perubahan harga saham.
| Keamanan | Saham (MM) |
Nilai (Juta Dolar AS) |
Portfolio % | ΔPorsyento ng Portfolio |
|---|---|---|---|---|
| 0.53 | 27.44 | 4.8771 | -0.9871 | |
| 0.30 | 11.76 | 2.0907 | -0.8270 | |
| 0.20 | 14.15 | 2.5152 | -0.7706 | |
| 0.06 | 18.44 | 3.2783 | -0.6091 | |
| 0.16 | 15.18 | 2.6976 | -0.5623 | |
| 0.41 | 14.31 | 2.5428 | -0.5580 | |
| 0.06 | 15.61 | 2.7750 | -0.5422 | |
| 0.02 | 5.89 | 1.0477 | -0.5150 | |
| 0.16 | 14.15 | 2.5146 | -0.4276 | |
| 0.44 | 10.73 | 1.9074 | -0.3736 |
Pengajuan 13F dan Dana
Formulir ini diajukan pada 2025-05-06 untuk periode pelaporan 2025-03-31. Klik ikon tautan untuk melihat riwayat transaksi selengkapnya.
Tingkatkan ke versi premium untuk membuka data premium dan ekspor ke Excel. ![]() .
.
| Keamanan | Ketik | Harga Saham Rata-rata | Saham (MM) |
ΔSaham (%) |
ΔSaham (%) |
Nilai ($MM) |
Portpolyo (%) |
ΔPortofolio (%) |
|
|---|---|---|---|---|---|---|---|---|---|
| T / AT&T Inc. | 1.13 | -5.94 | 31.87 | 16.82 | 5.6650 | 0.6448 | |||
| CVS / CVS Health Corporation | 0.46 | 20.55 | 31.37 | 81.94 | 5.5764 | 2.4034 | |||
| NFG / National Fuel Gas Company | 0.38 | -10.98 | 30.22 | 16.18 | 5.3711 | 0.5848 | |||
| ALL / The Allstate Corporation | 0.15 | -2.42 | 30.19 | 4.81 | 5.3651 | 0.0657 | |||
| EQH / Equitable Holdings, Inc. | 0.53 | -22.03 | 27.44 | -13.90 | 4.8771 | -0.9871 | |||
| TSN / Tyson Foods, Inc. | 0.40 | -0.44 | 25.75 | 10.60 | 4.5770 | 0.2926 | |||
| D / Dominion Energy, Inc. | 0.44 | -0.65 | 24.86 | 3.42 | 4.4180 | -0.0045 | |||
| COR / Cencora, Inc. | 0.09 | -2.37 | 24.82 | 20.84 | 4.4115 | 0.6321 | |||
| CVX / Chevron Corporation | 0.14 | -9.03 | 23.90 | 5.07 | 4.2474 | 0.0625 | |||
| KHC / The Kraft Heinz Company | 0.75 | 5.56 | 22.75 | 4.60 | 4.0443 | 0.0414 | |||
| C / Citigroup Inc. | 0.32 | -4.52 | 22.53 | -3.70 | 4.0040 | -0.3006 | |||
| IBM / International Business Machines Corporation | 0.09 | -13.44 | 22.13 | -2.08 | 3.9341 | -0.2254 | |||
| UTHR / United Therapeutics Corporation | 0.06 | -0.07 | 18.44 | -12.70 | 3.2783 | -0.6091 | |||
| GPC / Genuine Parts Company | 0.14 | 196.97 | 17.07 | 203.04 | 3.0345 | 1.9978 | |||
| FDX / FedEx Corporation | 0.06 | -0.05 | 15.61 | -13.39 | 2.7750 | -0.5422 | |||
| GPN / Global Payments Inc. | 0.16 | -1.96 | 15.18 | -14.33 | 2.6976 | -0.5623 | |||
| DOW / Dow Inc. | 0.41 | -2.44 | 14.31 | -15.10 | 2.5428 | -0.5580 | |||
| TPR / Tapestry, Inc. | 0.20 | -26.47 | 14.15 | -20.75 | 2.5152 | -0.7706 | |||
| MRK / Merck & Co., Inc. | 0.16 | -1.94 | 14.15 | -11.52 | 2.5146 | -0.4276 | |||
| ALLY / Ally Financial Inc. | 0.36 | -0.05 | 13.30 | 1.23 | 2.3646 | -0.0537 | |||
| VSH / Vishay Intertechnology, Inc. | 0.81 | -2.34 | 12.89 | -8.34 | 2.2914 | -0.2966 | |||
| DLTR / Dollar Tree, Inc. | 0.17 | -2.36 | 12.73 | -2.18 | 2.2619 | -0.1321 | |||
| LVS / Las Vegas Sands Corp. | 0.30 | -1.37 | 11.76 | -25.82 | 2.0907 | -0.8270 | |||
| INTC / Intel Corporation | 0.51 | -2.73 | 11.59 | 10.17 | 2.0595 | 0.1243 | |||
| MUR / Murphy Oil Corporation | 0.40 | 16.92 | 11.28 | 9.73 | 2.0048 | 0.1133 | |||
| ST / Sensata Technologies Holding plc | 0.44 | -2.26 | 10.73 | -13.43 | 1.9074 | -0.3736 | |||
| SUI / Sun Communities, Inc. | 0.08 | 6.07 | 9.72 | 10.96 | 1.7281 | 0.1158 | |||
| LPLA / LPL Financial Holdings Inc. | 0.02 | -30.73 | 5.89 | -30.59 | 1.0477 | -0.5150 | |||
| CACI / CACI International Inc | 0.02 | 5.71 | 1.0148 | 1.0148 | |||||
| HUM / Humana Inc. | 0.02 | 5.28 | 0.9377 | 0.9377 | |||||
| PG / The Procter & Gamble Company | 0.02 | 0.00 | 4.06 | 1.65 | 0.7224 | -0.0133 | |||
| ABBV / AbbVie Inc. | 0.01 | 0.00 | 3.04 | 17.92 | 0.5405 | 0.0659 | |||
| JNJ / Johnson & Johnson | 0.01 | 0.00 | 2.36 | 14.67 | 0.4196 | 0.0408 | |||
| ABT / Abbott Laboratories | 0.01 | 0.00 | 1.80 | 17.23 | 0.3194 | 0.0374 | |||
| MMM / 3M Company | 0.01 | 0.00 | 1.72 | 13.82 | 0.3059 | 0.0275 | |||
| EMR / Emerson Electric Co. | 0.02 | 0.00 | 1.70 | -11.49 | 0.3013 | -0.0513 | |||
| BMY / Bristol-Myers Squibb Company | 0.02 | 0.00 | 1.46 | 7.89 | 0.2600 | 0.0104 | |||
| AAPL / Apple Inc. | 0.01 | 0.00 | 1.13 | -11.28 | 0.2000 | -0.0334 | |||
| SPY / SPDR S&P 500 ETF | 0.00 | 0.00 | 1.03 | -4.55 | 0.1825 | -0.0155 | |||
| IWM / iShares Trust - iShares Russell 2000 ETF | 0.00 | 0.97 | 0.1727 | 0.1727 | |||||
| PEP / PepsiCo, Inc. | 0.01 | 0.00 | 0.92 | -1.40 | 0.1630 | -0.0081 | |||
| BIV / Vanguard Bond Index Funds - Vanguard Intermediate-Term Bond ETF | 0.01 | 0.00 | 0.90 | 2.50 | 0.1605 | -0.0017 | |||
| ORCL / Oracle Corporation | 0.01 | 0.00 | 0.71 | -16.09 | 0.1261 | -0.0295 | |||
| MSFT / Microsoft Corporation | 0.00 | 0.00 | 0.69 | -10.94 | 0.1230 | -0.0200 | |||
| ET / Energy Transfer LP - Limited Partnership | 0.03 | 0.00 | 0.47 | -5.02 | 0.0841 | -0.0076 | |||
| COST / Costco Wholesale Corporation | 0.00 | 0.00 | 0.47 | 3.06 | 0.0840 | -0.0002 | |||
| VWO / Vanguard International Equity Index Funds - Vanguard FTSE Emerging Markets ETF | 0.01 | 0.34 | 0.0610 | 0.0610 | |||||
| VCSH / Vanguard Scottsdale Funds - Vanguard Short-Term Corporate Bond ETF | 0.00 | 0.00 | 0.32 | 1.27 | 0.0568 | -0.0013 | |||
| VOO / Vanguard Index Funds - Vanguard S&P 500 ETF | 0.00 | 0.00 | 0.28 | -4.76 | 0.0499 | -0.0043 | |||
| BAC / Bank of America Corporation | 0.01 | 0.00 | 0.22 | -5.08 | 0.0399 | -0.0036 | |||
| CB / Chubb Limited | 0.00 | 0.00 | 0.22 | 9.45 | 0.0392 | 0.0021 | |||
| PFD / Flaherty & Crumrine Preferred Income Fund Inc. | 0.02 | 0.00 | 0.17 | 0.00 | 0.0308 | -0.0011 | |||
| GOOG / Alphabet Inc. | 0.00 | -100.00 | 0.00 | 0.0000 | |||||
| FIS / Fidelity National Information Services, Inc. | 0.00 | -100.00 | 0.00 | 0.0000 | |||||
| RPV / Invesco Exchange-Traded Fund Trust - Invesco S&P 500 Pure Value ETF | 0.00 | -100.00 | 0.00 | 0.0000 | |||||
| THYF / T. Rowe Price Exchange-Traded Funds, Inc. - T. Rowe Price U.S. High Yield ETF | 0.00 | -100.00 | 0.00 | -100.00 | -0.0422 | ||||
| GOOGL / Alphabet Inc. | 0.00 | -100.00 | 0.00 | 0.0000 | |||||
| APO / Apollo Global Management, Inc. | 0.00 | -100.00 | 0.00 | 0.0000 |