Mga Batayang Estadistika
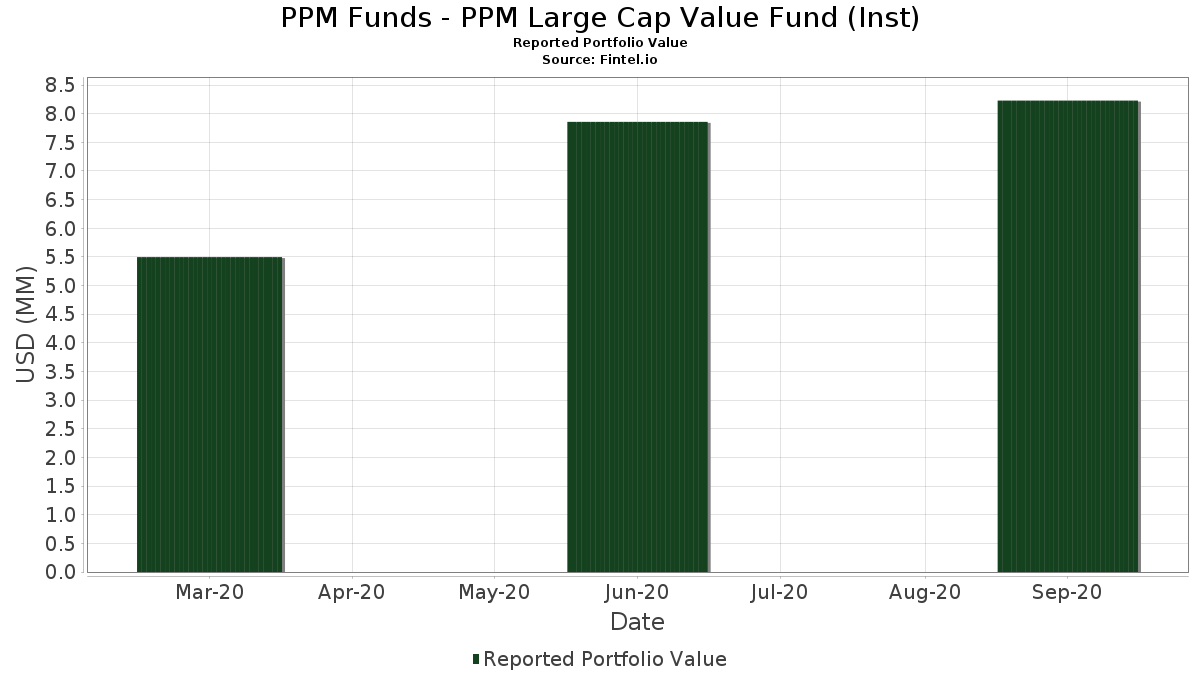
| Nilai Portofolio | $ 8,228,931 |
| Posisi Saat Ini | 54 |
Kepemilikan Terbaru, Kinerja, AUM (dari 13F, 13D)
PPM Funds - PPM Large Cap Value Fund (Inst) telah mengungkapkan total kepemilikan 54 dalam pengajuan SEC terbaru mereka. Nilai portofolio terbaru dihitung sebesar $ 8,228,931 USD. Aset yang Dikelola (AUM) sebenarnya adalah nilai ini ditambah kas (yang tidak diungkapkan). Aset-aset utama PPM Funds - PPM Large Cap Value Fund (Inst) adalah The AES Corporation (US:AES) , Caterpillar Inc. (US:CAT) , Comcast Corporation (US:CMCSA) , Berkshire Hathaway Inc. (US:BRK.B) , and McKesson Corporation (US:MCK) . Posisi baru PPM Funds - PPM Large Cap Value Fund (Inst) meliputi: Hologic, Inc. (US:HOLX) , .
Peningkatan Tertinggi Kuartal Ini
Kami menggunakan perubahan dalam alokasi portofolio karena ini adalah metrik yang paling bermakna. Perubahan dapat disebabkan oleh perdagangan atau perubahan harga saham.
| Keamanan | Saham (MM) |
Nilai (Juta Dolar AS) |
Portfolio % | ΔPorsyento ng Portfolio |
|---|---|---|---|---|
| 0.00 | 0.14 | 1.6938 | 1.6938 | |
| 0.00 | 0.18 | 2.1901 | 1.2536 | |
| 0.00 | 0.22 | 2.7148 | 0.7901 | |
| 0.00 | 0.21 | 2.5839 | 0.7733 | |
| 0.00 | 0.16 | 1.8906 | 0.6182 | |
| 0.00 | 0.18 | 2.1420 | 0.4073 | |
| 0.00 | 0.22 | 2.6944 | 0.3222 | |
| 0.00 | 0.17 | 2.0557 | 0.3141 | |
| 0.01 | 0.25 | 3.0765 | 0.3025 | |
| 0.00 | 0.11 | 1.3693 | 0.2785 |
Penurunan Tertinggi Kuartal Ini
Kami menggunakan perubahan dalam alokasi portofolio karena ini adalah metrik yang paling bermakna. Perubahan dapat disebabkan oleh perdagangan atau perubahan harga saham.
| Keamanan | Saham (MM) |
Nilai (Juta Dolar AS) |
Portfolio % | ΔPorsyento ng Portfolio |
|---|---|---|---|---|
| 0.00 | 0.00 | -1.1441 | ||
| 0.00 | 0.12 | 1.5145 | -0.7420 | |
| 0.00 | 0.17 | 2.1079 | -0.6672 | |
| 0.00 | 0.15 | 1.8309 | -0.6310 | |
| 0.00 | 0.12 | 1.4472 | -0.6155 | |
| 0.00 | 0.15 | 1.8347 | -0.5410 | |
| 0.00 | 0.10 | 1.2497 | -0.4512 | |
| 0.00 | 0.17 | 2.0551 | -0.4161 | |
| 0.00 | 0.19 | 2.3383 | -0.4003 | |
| 0.00 | 0.17 | 2.0557 | -0.3235 |
Pengajuan 13F dan Dana
Formulir ini diajukan pada 2020-11-24 untuk periode pelaporan 2020-09-30. Klik ikon tautan untuk melihat riwayat transaksi selengkapnya.
Tingkatkan ke versi premium untuk membuka data premium dan ekspor ke Excel. ![]() .
.
| Keamanan | Ketik | Harga Saham Rata-rata | Saham (MM) |
ΔSaham (%) |
ΔSaham (%) |
Nilai ($MM) |
Portpolyo (%) |
ΔPortofolio (%) |
|
|---|---|---|---|---|---|---|---|---|---|
| AES / The AES Corporation | 0.01 | -7.28 | 0.25 | 16.06 | 3.0765 | 0.3025 | |||
| CAT / Caterpillar Inc. | 0.00 | 25.00 | 0.22 | 47.68 | 2.7148 | 0.7901 | |||
| CMCSA / Comcast Corporation | 0.00 | 0.00 | 0.22 | 18.72 | 2.6944 | 0.3222 | |||
| BRK.B / Berkshire Hathaway Inc. | 0.00 | 25.00 | 0.21 | 49.30 | 2.5839 | 0.7733 | |||
| MCK / McKesson Corporation | 0.00 | 0.00 | 0.21 | -2.80 | 2.5300 | -0.1932 | |||
| VST / Vistra Corp. | 0.01 | 6.80 | 0.21 | 8.38 | 2.5174 | 0.0858 | |||
| PFE / Pfizer Inc. | 0.01 | 0.00 | 0.20 | 12.29 | 2.4493 | 0.1691 | |||
| JNJ / Johnson & Johnson | 0.00 | 0.00 | 0.19 | 6.04 | 2.3485 | 0.0306 | |||
| KR / The Kroger Co. | 0.01 | 0.00 | 0.19 | 0.52 | 2.3454 | -0.1009 | |||
| ABBV / AbbVie Inc. | 0.00 | 0.00 | 0.19 | -10.70 | 2.3383 | -0.4003 | |||
| MS / Morgan Stanley | 0.00 | 0.00 | 0.19 | 0.00 | 2.2881 | -0.1002 | |||
| ALL / The Allstate Corporation | 0.00 | 0.00 | 0.19 | -2.59 | 2.2847 | -0.1747 | |||
| T / AT&T Inc. | 0.01 | 10.17 | 0.19 | 3.93 | 2.2487 | -0.0126 | |||
| HIG / The Hartford Insurance Group, Inc. | 0.01 | 0.00 | 0.18 | -4.17 | 2.2364 | -0.2074 | |||
| MO / Altria Group, Inc. | 0.00 | -6.00 | 0.18 | -7.65 | 2.2037 | -0.2845 | |||
| ADM / Archer-Daniels-Midland Company | 0.00 | 0.00 | 0.18 | 16.77 | 2.2001 | 0.2272 | |||
| CTSH / Cognizant Technology Solutions Corporation | 0.00 | 100.00 | 0.18 | 146.58 | 2.1901 | 1.2536 | |||
| EXC / Exelon Corporation | 0.01 | 6.38 | 0.18 | 4.71 | 2.1696 | 0.0071 | |||
| GM / General Motors Company | 0.01 | 0.00 | 0.18 | 17.22 | 2.1543 | 0.2297 | |||
| QCOM / QUALCOMM Incorporated | 0.00 | 0.00 | 0.18 | 29.41 | 2.1420 | 0.4073 | |||
| BERY / Berry Global Group, Inc. | 0.00 | 2.86 | 0.17 | 11.61 | 2.1108 | 0.1441 | |||
| AAPL / Apple Inc. | 0.00 | 150.00 | 0.17 | -20.64 | 2.1079 | -0.6672 | |||
| JPM / JPMorgan Chase & Co. | 0.00 | 0.00 | 0.17 | 2.37 | 2.1027 | -0.0439 | |||
| CI / The Cigna Group | 0.00 | 0.00 | 0.17 | -9.63 | 2.0557 | -0.3235 | |||
| RHI / Robert Half Inc. | 0.00 | 23.08 | 0.17 | 23.36 | 2.0557 | 0.3141 | |||
| CVS / CVS Health Corporation | 0.00 | -3.33 | 0.17 | -12.89 | 2.0551 | -0.4161 | |||
| MSFT / Microsoft Corporation | 0.00 | 0.00 | 0.17 | 3.70 | 2.0418 | -0.0224 | |||
| / ViacomCBS Inc | 0.01 | -9.09 | 0.17 | 9.80 | 2.0393 | 0.0879 | |||
| MRK / Merck & Co., Inc. | 0.00 | 0.00 | 0.17 | 7.14 | 2.0131 | 0.0522 | |||
| BBY / Best Buy Co., Inc. | 0.00 | 21.74 | 0.16 | 55.00 | 1.8906 | 0.6182 | |||
| CVX / Chevron Corporation | 0.00 | 0.00 | 0.15 | -19.25 | 1.8347 | -0.5410 | |||
| C / Citigroup Inc. | 0.00 | -7.89 | 0.15 | -22.68 | 1.8309 | -0.6310 | |||
| CSCO / Cisco Systems, Inc. | 0.00 | 20.00 | 0.14 | 1.44 | 1.7207 | -0.0533 | |||
| CPB / The Campbell's Company | 0.00 | 0.00 | 0.14 | -2.10 | 1.7021 | -0.1227 | |||
| HOLX / Hologic, Inc. | 0.00 | 0.14 | 1.6938 | 1.6938 | |||||
| SNV / Synovus Financial Corp. | 0.01 | 0.00 | 0.14 | 3.01 | 1.6697 | -0.0222 | |||
| TXT / Textron Inc. | 0.00 | -10.26 | 0.13 | -1.56 | 1.5327 | -0.0945 | |||
| NUE / Nucor Corporation | 0.00 | 3.70 | 0.13 | 12.61 | 1.5242 | 0.1066 | |||
| LDOS / Leidos Holdings, Inc. | 0.00 | -26.32 | 0.12 | -29.94 | 1.5145 | -0.7420 | |||
| DAL / Delta Air Lines, Inc. | 0.00 | -32.76 | 0.12 | -26.54 | 1.4472 | -0.6155 | |||
| NUAN / Nuance Communications Inc | 0.00 | 0.00 | 0.11 | 30.23 | 1.3693 | 0.2785 | |||
| FL / Foot Locker, Inc. | 0.00 | 0.00 | 0.11 | 13.13 | 1.3627 | 0.1057 | |||
| HBAN / Huntington Bancshares Incorporated | 0.01 | 0.00 | 0.11 | 0.91 | 1.3575 | -0.0400 | |||
| HAL / Halliburton Company | 0.01 | 0.00 | 0.11 | -6.90 | 1.3160 | -0.1651 | |||
| NWL / Newell Brands Inc. | 0.01 | 0.00 | 0.10 | 8.33 | 1.2702 | 0.0420 | |||
| XOM / Exxon Mobil Corporation | 0.00 | 0.00 | 0.10 | -23.88 | 1.2497 | -0.4512 | |||
| PNC / The PNC Financial Services Group, Inc. | 0.00 | 0.00 | 0.10 | 4.26 | 1.2003 | -0.0002 | |||
| RCL / Royal Caribbean Cruises Ltd. | 0.00 | 0.00 | 0.10 | 29.33 | 1.1782 | 0.2216 | |||
| INTC / Intel Corporation | 0.00 | 21.43 | 0.09 | 6.02 | 1.0681 | 0.0062 | |||
| BAC / Bank of America Corporation | 0.00 | 0.00 | 0.09 | 1.18 | 1.0523 | -0.0317 | |||
| SPG / Simon Property Group, Inc. | 0.00 | 0.00 | 0.07 | -5.33 | 0.8633 | -0.0903 | |||
| SPR / Spirit AeroSystems Holdings, Inc. | 0.00 | 0.00 | 0.06 | -21.52 | 0.7572 | -0.2444 | |||
| AVT / Avnet, Inc. | 0.00 | 0.00 | 0.05 | -7.27 | 0.6271 | -0.0800 | |||
| GVMXX / State Street Institutional Investment Trust - State Street Institutional US Govt Money Market Fnd Premier Cls | 0.04 | 0.29 | 0.04 | 0.00 | 0.5213 | -0.0218 | |||
| ADS / Bread Financial Holdings Inc | 0.00 | -100.00 | 0.00 | -100.00 | -1.1441 |