Mga Batayang Estadistika
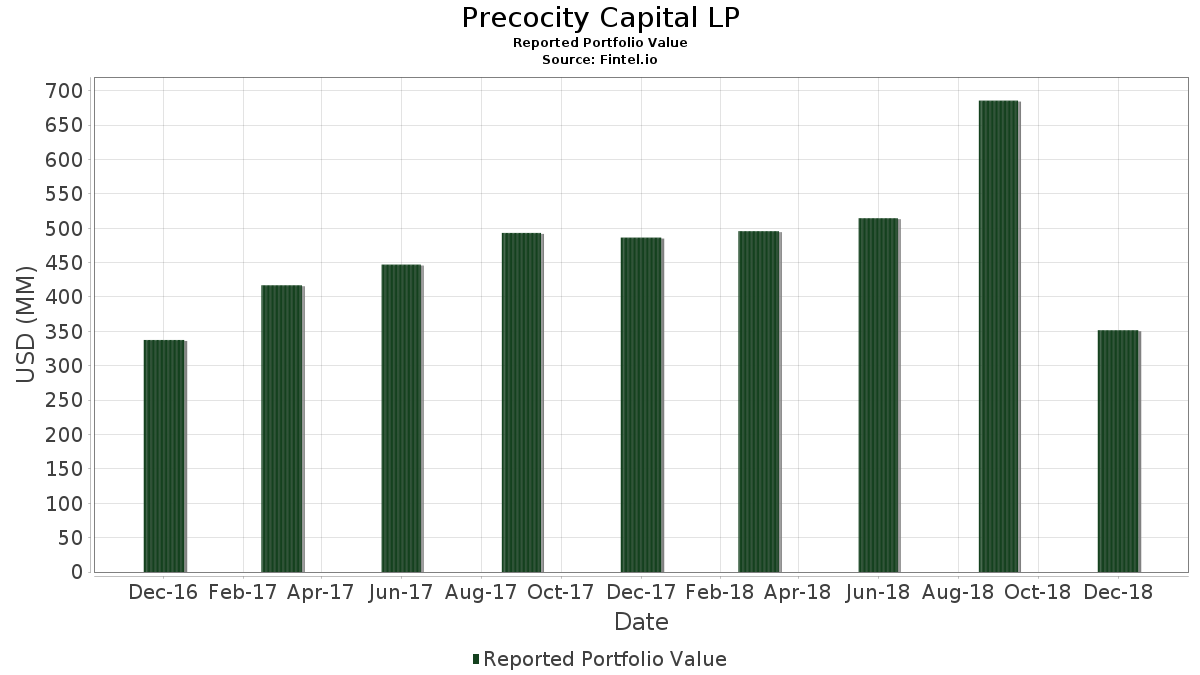
| Nilai Portofolio | $ 351,697,000 |
| Posisi Saat Ini | 41 |
Kepemilikan Terbaru, Kinerja, AUM (dari 13F, 13D)
Precocity Capital LP telah mengungkapkan total kepemilikan 41 dalam pengajuan SEC terbaru mereka. Nilai portofolio terbaru dihitung sebesar $ 351,697,000 USD. Aset yang Dikelola (AUM) sebenarnya adalah nilai ini ditambah kas (yang tidak diungkapkan). Aset-aset utama Precocity Capital LP adalah Bunge Global SA (US:BG) , ONEOK, Inc. (US:OKE) , Vistra Corp. (US:VST) , Baker Hughes Company (US:BKR) , and Devon Energy Corporation (US:DVN) . Posisi baru Precocity Capital LP meliputi: Baker Hughes Company (US:BKR) , Anadarko Petroleum Corp. (US:US0325111070) , Murphy USA Inc. (US:MUSA) , Goldcorp, Inc. (US:GG) , and Teck Resources Limited (CA:TECK.B) .
Peningkatan Tertinggi Kuartal Ini
Kami menggunakan perubahan dalam alokasi portofolio karena ini adalah metrik yang paling bermakna. Perubahan dapat disebabkan oleh perdagangan atau perubahan harga saham.
| Keamanan | Saham (MM) |
Nilai (Juta Dolar AS) |
Portfolio % | ΔPorsyento ng Portfolio |
|---|---|---|---|---|
| 0.30 | 24.05 | 6.8377 | 6.8377 | |
| 0.75 | 17.17 | 4.8815 | 4.8815 | |
| 0.75 | 16.12 | 4.5849 | 4.5849 | |
| 0.15 | 14.37 | 4.0856 | 4.0856 | |
| 2.52 | 13.96 | 3.9702 | 3.9702 | |
| 0.35 | 13.86 | 3.9409 | 3.9409 | |
| 0.75 | 11.98 | 3.4078 | 3.4078 | |
| 0.47 | 11.46 | 3.2591 | 3.2591 | |
| 0.57 | 11.46 | 3.2576 | 3.2576 | |
| 0.09 | 11.18 | 3.1786 | 3.1786 |
Penurunan Tertinggi Kuartal Ini
Kami menggunakan perubahan dalam alokasi portofolio karena ini adalah metrik yang paling bermakna. Perubahan dapat disebabkan oleh perdagangan atau perubahan harga saham.
| Keamanan | Saham (MM) |
Nilai (Juta Dolar AS) |
Portfolio % | ΔPorsyento ng Portfolio |
|---|---|---|---|---|
| 0.00 | 0.00 | -2.2604 | ||
| 0.00 | 0.00 | -1.7834 | ||
| 0.00 | 0.00 | -0.7897 | ||
| 0.00 | 0.00 | -0.6118 | ||
| 2.35 | 13.58 | 3.8621 | -0.0575 |
Pengajuan 13F dan Dana
Formulir ini diajukan pada 2019-02-12 untuk periode pelaporan 2018-12-31. Klik ikon tautan untuk melihat riwayat transaksi selengkapnya.
Tingkatkan ke versi premium untuk membuka data premium dan ekspor ke Excel. ![]() .
.
| Keamanan | Ketik | Harga Saham Rata-rata | Saham (MM) |
ΔSaham (%) |
ΔSaham (%) |
Nilai ($MM) |
Portpolyo (%) |
ΔPortofolio (%) |
|
|---|---|---|---|---|---|---|---|---|---|
| BG / Bunge Global SA | 0.30 | 28.30 | 24.05 | 48.93 | 6.8377 | 6.8377 | |||
| OKE / ONEOK, Inc. | 0.35 | 16.67 | 18.88 | -7.15 | 5.3691 | 2.4031 | |||
| VST / Vistra Corp. | 0.75 | 0.00 | 17.17 | -8.00 | 4.8815 | 4.8815 | |||
| BKR / Baker Hughes Company | 0.75 | 16.12 | 4.5849 | 4.5849 | |||||
| DVN / Devon Energy Corporation | 0.65 | 0.00 | 14.65 | -43.57 | 4.1658 | 0.3796 | |||
| FANG / Diamondback Energy, Inc. | 0.15 | 14.37 | 4.0856 | 4.0856 | |||||
| OAS / Oasis Petroleum Inc. - New | 2.52 | 68.33 | 13.96 | -34.35 | 3.9702 | 3.9702 | |||
| NRG / NRG Energy, Inc. | 0.35 | -30.00 | 13.86 | -25.88 | 3.9409 | 3.9409 | |||
| ECA / EnCana Corp. | 2.35 | 14.63 | 13.58 | -49.46 | 3.8621 | -0.0575 | |||
| MPC / Marathon Petroleum Corporation | 0.23 | 80.00 | 13.28 | 32.82 | 3.7751 | 2.3173 | |||
| US7018771029 / Parsley Energy, Inc. | 0.75 | 7.14 | 11.98 | -41.47 | 3.4078 | 3.4078 | |||
| CNQ / Canadian Natural Resources Limited | 0.47 | 2.15 | 11.46 | -24.53 | 3.2591 | 3.2591 | |||
| PAGP / Plains GP Holdings, L.P. - Limited Partnership | 0.57 | -20.83 | 11.46 | -35.13 | 3.2576 | 3.2576 | |||
| PXD / Pioneer Natural Resources Company | 0.09 | 11.18 | 3.1786 | 3.1786 | |||||
| PSX / Phillips 66 | 0.12 | 10.77 | 3.0620 | 3.0620 | |||||
| CLR / Continental Resources Inc (OKLA) | 0.25 | 0.00 | 10.05 | -41.14 | 2.8570 | 2.8570 | |||
| US0325111070 / Anadarko Petroleum Corp. | 0.20 | 8.77 | 2.4931 | 2.4931 | |||||
| EQT / EQT Corporation | 0.42 | 0.00 | 8.03 | -57.29 | 2.2826 | 2.2826 | |||
| MUSA / Murphy USA Inc. | 0.10 | 7.66 | 2.1791 | 2.1791 | |||||
| FMC / FMC Corporation | 0.10 | 100.00 | 7.40 | 69.67 | 2.1029 | 1.4672 | |||
| FTI / TechnipFMC plc | 0.35 | 6.85 | 1.9486 | 1.9486 | |||||
| FSLR / First Solar, Inc. | 0.15 | 6.37 | 1.8106 | 1.8106 | |||||
| NOG / Northern Oil and Gas, Inc. | 2.75 | 175.00 | 6.21 | 55.38 | 1.7671 | 1.1838 | |||
| NEE / NextEra Energy, Inc. | 0.04 | -65.00 | 6.08 | -63.70 | 1.7299 | 1.7299 | |||
| GG / Goldcorp, Inc. | 0.60 | 5.88 | 1.6719 | 1.6719 | |||||
| TECK.B / Teck Resources Limited | 0.25 | 5.38 | 1.5311 | 1.5311 | |||||
| GPRE / Green Plains Inc. | 0.40 | -46.67 | 5.24 | -59.35 | 1.4911 | 1.4911 | |||
| FCX / Freeport-McMoRan Inc. | 0.50 | 0.00 | 5.16 | -25.93 | 1.4658 | 0.4507 | |||
| NBR / Nabors Industries Ltd. | 2.50 | 0.00 | 5.00 | -67.53 | 1.4217 | 1.4217 | |||
| TELL / Tellurian Inc. | 0.65 | -27.78 | 4.52 | -44.04 | 1.2846 | 1.2846 | |||
| STNG / Scorpio Tankers Inc. | 2.50 | 25.00 | 4.40 | 9.45 | 1.2511 | 0.6648 | |||
| PUMP / ProPetro Holding Corp. | 0.35 | 4.31 | 1.2261 | 1.2261 | |||||
| ALB / Albemarle Corporation | 0.05 | 0.00 | 3.85 | -22.75 | 1.0958 | 1.0958 | |||
| SLB / Schlumberger Limited | 0.10 | -72.22 | 3.61 | -83.55 | 1.0259 | 1.0259 | |||
| MRO / Marathon Oil Corporation | 0.25 | 3.58 | 1.0193 | 1.0193 | |||||
| LTHM / Livent Corporation | 0.25 | 3.45 | 0.9810 | 0.9810 | |||||
| EAF / GrafTech International Ltd. | 0.30 | -7.69 | 3.43 | -45.88 | 0.9758 | 0.9758 | |||
| PTEN / Patterson-UTI Energy, Inc. | 0.25 | 25.00 | 2.59 | -24.37 | 0.7359 | 0.7359 | |||
| SWN / Southwestern Energy Company | 0.75 | 0.00 | 2.56 | -33.26 | 0.7273 | 0.7273 | |||
| US6550441058 / Noble Energy, Inc. | 0.12 | 0.00 | 2.35 | -39.86 | 0.6668 | 0.0981 | |||
| EOG / EOG Resources, Inc. | 0.03 | 0.00 | 2.18 | -31.64 | 0.6199 | 0.6199 | |||
| RDS.A / Shell Plc - ADR (Representing Ordinary Shares - Class A) | 0.00 | -100.00 | 0.00 | -100.00 | 0.0000 | 0.0000 | |||
| NSC / Norfolk Southern Corporation | 0.00 | -100.00 | 0.00 | -100.00 | -0.7897 | ||||
| KNX / Knight-Swift Transportation Holdings Inc. | 0.00 | -100.00 | 0.00 | -100.00 | 0.0000 | 0.0000 | |||
| PDCE / PDC Energy Inc | 0.00 | -100.00 | 0.00 | -100.00 | 0.0000 | 0.0000 | |||
| FLMN / Falcon Minerals Corp - Class A | 0.00 | -100.00 | 0.00 | -100.00 | 0.0000 | 0.0000 | |||
| HUBG / Hub Group, Inc. | 0.00 | -100.00 | 0.00 | -100.00 | 0.0000 | 0.0000 | |||
| WTTR / Select Water Solutions, Inc. | 0.00 | -100.00 | 0.00 | -100.00 | 0.0000 | 0.0000 | |||
| AAL / American Airlines Group Inc. | 0.00 | -100.00 | 0.00 | -100.00 | -2.2604 | ||||
| UNP / Union Pacific Corporation | 0.00 | -100.00 | 0.00 | -100.00 | 0.0000 | 0.0000 | |||
| CNI / Canadian National Railway Company | 0.00 | -100.00 | 0.00 | -100.00 | 0.0000 | 0.0000 | |||
| SAVE / Spirit Airlines, Inc. | 0.00 | -100.00 | 0.00 | -100.00 | 0.0000 | 0.0000 | |||
| LUV / Southwest Airlines Co. | 0.00 | -100.00 | 0.00 | -100.00 | 0.0000 | 0.0000 | |||
| XPO / XPO, Inc. | 0.00 | -100.00 | 0.00 | -100.00 | 0.0000 | 0.0000 | |||
| WRD / WeRide Inc. - Depositary Receipt (Common Stock) | 0.00 | -100.00 | 0.00 | -100.00 | 0.0000 | 0.0000 | |||
| RRC / Range Resources Corporation | 0.00 | -100.00 | 0.00 | -100.00 | 0.0000 | 0.0000 | |||
| CVX / Chevron Corporation | 0.00 | -100.00 | 0.00 | -100.00 | -1.7834 | ||||
| HFC / HollyFrontier Corp | 0.00 | -100.00 | 0.00 | -100.00 | 0.0000 | 0.0000 | |||
| SPY / SPDR S&P 500 ETF | 0.00 | -100.00 | 0.00 | -100.00 | 0.0000 | 0.0000 | |||
| REN / Resolute Energy Corporation | 0.00 | -100.00 | 0.00 | -100.00 | 0.0000 | 0.0000 | |||
| BP / BP p.l.c. - Depositary Receipt (Common Stock) | 0.00 | -100.00 | 0.00 | -100.00 | 0.0000 | 0.0000 | |||
| APTV / Aptiv PLC | 0.00 | -100.00 | 0.00 | -100.00 | -0.6118 | ||||
| RIG / Transocean Ltd. | 0.00 | -100.00 | 0.00 | -100.00 | 0.0000 | 0.0000 |