Mga Batayang Estadistika
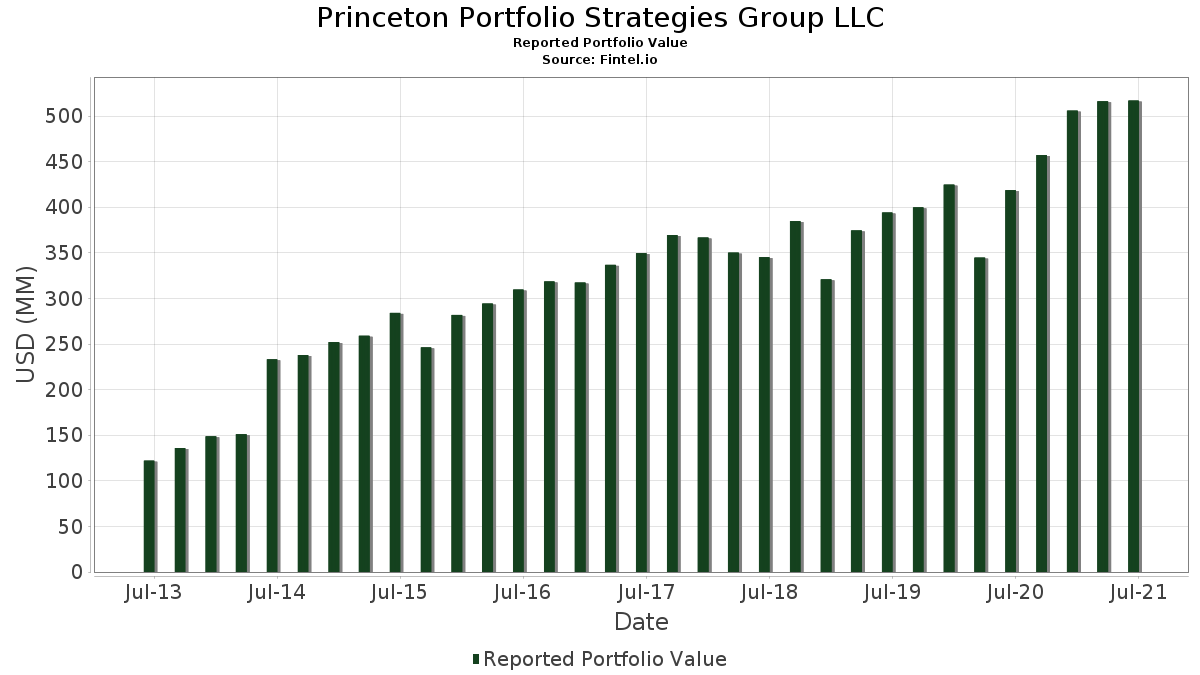
| Nilai Portofolio | $ 516,930,000 |
| Posisi Saat Ini | 138 |
Kepemilikan Terbaru, Kinerja, AUM (dari 13F, 13D)
Princeton Portfolio Strategies Group LLC telah mengungkapkan total kepemilikan 138 dalam pengajuan SEC terbaru mereka. Nilai portofolio terbaru dihitung sebesar $ 516,930,000 USD. Aset yang Dikelola (AUM) sebenarnya adalah nilai ini ditambah kas (yang tidak diungkapkan). Aset-aset utama Princeton Portfolio Strategies Group LLC adalah Apple Inc. (US:AAPL) , Microsoft Corporation (US:MSFT) , Danaher Corporation (US:DHR) , Thermo Fisher Scientific Inc. (US:TMO) , and Comcast Corporation (US:CMCSA) . Posisi baru Princeton Portfolio Strategies Group LLC meliputi: Dow Inc. (US:DOW) , .
Peningkatan Tertinggi Kuartal Ini
Kami menggunakan perubahan dalam alokasi portofolio karena ini adalah metrik yang paling bermakna. Perubahan dapat disebabkan oleh perdagangan atau perubahan harga saham.
| Keamanan | Saham (MM) |
Nilai (Juta Dolar AS) |
Portfolio % | ΔPorsyento ng Portfolio |
|---|---|---|---|---|
| 0.07 | 19.57 | 3.7858 | 0.5721 | |
| 0.01 | 5.51 | 1.0669 | 0.5482 | |
| 0.01 | 13.62 | 2.6354 | 0.5355 | |
| 0.09 | 4.94 | 0.9551 | 0.4484 | |
| 0.02 | 6.08 | 1.1764 | 0.4473 | |
| 0.08 | 22.67 | 4.3857 | 0.4176 | |
| 0.11 | 8.22 | 1.5905 | 0.4051 | |
| 0.08 | 14.20 | 2.7472 | 0.3758 | |
| 0.01 | 10.77 | 2.0838 | 0.3640 | |
| 0.02 | 7.58 | 1.4667 | 0.3508 |
Penurunan Tertinggi Kuartal Ini
Kami menggunakan perubahan dalam alokasi portofolio karena ini adalah metrik yang paling bermakna. Perubahan dapat disebabkan oleh perdagangan atau perubahan harga saham.
| Keamanan | Saham (MM) |
Nilai (Juta Dolar AS) |
Portfolio % | ΔPorsyento ng Portfolio |
|---|---|---|---|---|
| 0.04 | 7.78 | 1.5056 | -0.7615 | |
| 0.00 | 0.22 | 0.0427 | -0.7451 | |
| 0.06 | 2.76 | 0.5341 | -0.5227 | |
| 0.01 | 0.96 | 0.1861 | -0.2984 | |
| 0.00 | 1.18 | 0.2279 | -0.2838 | |
| 0.06 | 10.45 | 2.0206 | -0.2587 | |
| 0.06 | 9.20 | 1.7803 | -0.2429 | |
| 0.01 | 1.39 | 0.2691 | -0.2253 | |
| 0.02 | 3.33 | 0.6436 | -0.2247 | |
| 0.05 | 1.05 | 0.2037 | -0.1997 |
Pengajuan 13F dan Dana
Formulir ini diajukan pada 2021-08-02 untuk periode pelaporan 2021-06-30. Klik ikon tautan untuk melihat riwayat transaksi selengkapnya.
Tingkatkan ke versi premium untuk membuka data premium dan ekspor ke Excel. ![]() .
.
| Keamanan | Ketik | Harga Saham Rata-rata | Saham (MM) |
ΔSaham (%) |
ΔSaham (%) |
Nilai ($MM) |
Portpolyo (%) |
ΔPortofolio (%) |
|
|---|---|---|---|---|---|---|---|---|---|
| AAPL / Apple Inc. | 0.17 | -7.92 | 23.21 | 3.24 | 4.4896 | 0.1344 | |||
| MSFT / Microsoft Corporation | 0.08 | -3.67 | 22.67 | 10.69 | 4.3857 | 0.4176 | |||
| DHR / Danaher Corporation | 0.07 | -1.05 | 19.57 | 17.98 | 3.7858 | 0.5721 | |||
| TMO / Thermo Fisher Scientific Inc. | 0.03 | -0.96 | 17.42 | 9.48 | 3.3703 | 0.2872 | |||
| CMCSA / Comcast Corporation | 0.28 | -0.92 | 15.98 | 4.40 | 3.0915 | 0.1260 | |||
| DG / Dollar General Corporation | 0.07 | -4.20 | 15.55 | 2.32 | 3.0081 | 0.0637 | |||
| MINT / PIMCO ETF Trust - PIMCO Enhanced Short Maturity Active Exchange-Traded Fund | 0.14 | -6.56 | 14.62 | -6.51 | 2.8238 | -0.1948 | |||
| ZTS / Zoetis Inc. | 0.08 | -1.96 | 14.20 | 16.02 | 2.7472 | 0.3758 | |||
| GOOGL / Alphabet Inc. | 0.01 | 6.17 | 13.62 | 25.69 | 2.6354 | 0.5355 | |||
| AMT / American Tower Corporation | 0.05 | -2.79 | 12.56 | 9.85 | 2.4299 | 0.2145 | |||
| V / Visa Inc. | 0.05 | -0.33 | 11.41 | 10.07 | 2.2078 | 0.1990 | |||
| EQIX / Equinix, Inc. | 0.01 | 2.75 | 10.77 | 21.35 | 2.0838 | 0.3640 | |||
| JNJ / Johnson & Johnson | 0.06 | -11.43 | 10.45 | -11.22 | 2.0206 | -0.2587 | |||
| FLT / Corpay, Inc. | 0.04 | 0.00 | 10.07 | -4.68 | 1.9488 | -0.0988 | |||
| TMX / Terminix Global Holdings Inc | 0.21 | -4.24 | 9.96 | -4.17 | 1.9243 | -0.0825 | |||
| JPM / JPMorgan Chase & Co. | 0.06 | -13.75 | 9.20 | -11.87 | 1.7803 | -0.2429 | |||
| STE / STERIS plc | 0.04 | 1.56 | 8.87 | 10.00 | 1.7153 | 0.1536 | |||
| ECL / Ecolab Inc. | 0.04 | -5.62 | 8.86 | -9.18 | 1.7145 | -0.1761 | |||
| GNRC / Generac Holdings Inc. | 0.02 | 0.02 | 8.48 | 26.80 | 1.6403 | 0.3447 | |||
| APD / Air Products and Chemicals, Inc. | 0.03 | 1.33 | 8.46 | 3.62 | 1.6370 | 0.0549 | |||
| ADP / Automatic Data Processing, Inc. | 0.04 | -12.46 | 8.46 | -7.74 | 1.6366 | -0.1400 | |||
| CHE / Chemed Corporation | 0.02 | -2.95 | 8.43 | 0.14 | 1.6312 | -0.0001 | |||
| ACN / Accenture plc | 0.03 | -2.01 | 8.30 | 4.56 | 1.6032 | 0.0708 | |||
| EL / The Estée Lauder Companies Inc. | 0.03 | 0.10 | 8.28 | 9.48 | 1.6023 | 0.1365 | |||
| MRK / Merck & Co., Inc. | 0.11 | 33.19 | 8.22 | 34.37 | 1.5905 | 0.4051 | |||
| NEE / NextEra Energy, Inc. | 0.11 | 7.85 | 8.10 | 4.53 | 1.5673 | 0.0657 | |||
| AWK / American Water Works Company, Inc. | 0.05 | -2.77 | 8.08 | -0.04 | 1.5631 | -0.0029 | |||
| UNP / Union Pacific Corporation | 0.04 | -33.35 | 7.78 | -33.49 | 1.5056 | -0.7615 | |||
| INTU / Intuit Inc. | 0.02 | 2.86 | 7.58 | 31.63 | 1.4667 | 0.3508 | |||
| PYPL / PayPal Holdings, Inc. | 0.02 | 34.62 | 6.08 | 61.60 | 1.1764 | 0.4473 | |||
| QQQ / Invesco QQQ Trust, Series 1 | 0.02 | 16.50 | 5.81 | 29.40 | 1.1239 | 0.2541 | |||
| SPGI / S&P Global Inc. | 0.01 | -14.96 | 5.79 | -1.08 | 1.1191 | -0.0139 | |||
| SPY / SPDR S&P 500 ETF | 0.01 | 90.75 | 5.51 | 106.01 | 1.0669 | 0.5482 | |||
| PEP / PepsiCo, Inc. | 0.03 | -4.15 | 5.18 | 0.39 | 1.0013 | 0.0024 | |||
| IGSB / iShares Trust - iShares 1-5 Year Investment Grade Corporate Bond ETF | 0.09 | 88.35 | 4.94 | 88.80 | 0.9551 | 0.4484 | |||
| BE / Bloom Energy Corporation | 0.18 | -1.48 | 4.82 | -2.15 | 0.9322 | -0.0219 | |||
| KO / The Coca-Cola Company | 0.08 | -7.20 | 4.45 | -4.75 | 0.8603 | -0.0443 | |||
| IJR / iShares Trust - iShares Core S&P Small-Cap ETF | 0.04 | 30.73 | 4.37 | 36.06 | 0.8452 | 0.2231 | |||
| MDT / Medtronic plc | 0.03 | -6.83 | 3.98 | -2.09 | 0.7703 | -0.0176 | |||
| PNC / The PNC Financial Services Group, Inc. | 0.02 | -14.34 | 3.92 | -6.84 | 0.7585 | -0.0569 | |||
| HON / Honeywell International Inc. | 0.02 | -10.83 | 3.59 | -9.87 | 0.6939 | -0.0772 | |||
| VOO / Vanguard Index Funds - Vanguard S&P 500 ETF | 0.01 | 0.00 | 3.49 | 8.02 | 0.6742 | 0.0504 | |||
| QCOM / QUALCOMM Incorporated | 0.02 | -8.50 | 3.42 | -1.35 | 0.6626 | -0.0101 | |||
| GPN / Global Payments Inc. | 0.02 | -20.22 | 3.33 | -25.77 | 0.6436 | -0.2247 | |||
| SCHW / The Charles Schwab Corporation | 0.04 | -1.24 | 3.18 | 10.33 | 0.6158 | 0.0568 | |||
| FTDR / Frontdoor, Inc. | 0.06 | -45.38 | 2.76 | -49.39 | 0.5341 | -0.5227 | |||
| PNR / Pentair plc | 0.04 | -0.74 | 2.72 | 7.47 | 0.5258 | 0.0358 | |||
| WMB / The Williams Companies, Inc. | 0.10 | -9.16 | 2.71 | 1.80 | 0.5242 | 0.0085 | |||
| SBUX / Starbucks Corporation | 0.02 | -1.71 | 2.70 | 0.56 | 0.5219 | 0.0021 | |||
| EMR / Emerson Electric Co. | 0.03 | -0.54 | 2.63 | 6.12 | 0.5097 | 0.0287 | |||
| FMC / FMC Corporation | 0.02 | -1.75 | 2.49 | -3.86 | 0.4817 | -0.0201 | |||
| VIG / Vanguard Specialized Funds - Vanguard Dividend Appreciation ETF | 0.02 | -14.77 | 2.33 | -10.30 | 0.4493 | -0.0513 | |||
| CAG / Conagra Brands, Inc. | 0.06 | -3.19 | 2.32 | -6.34 | 0.4486 | -0.0311 | |||
| MDLZ / Mondelez International, Inc. | 0.04 | -10.98 | 2.30 | -5.04 | 0.4444 | -0.0227 | |||
| PFE / Pfizer Inc. | 0.06 | -3.39 | 2.27 | 4.41 | 0.4401 | 0.0179 | |||
| DOCU / DocuSign, Inc. | 0.01 | -1.38 | 2.20 | 36.16 | 0.4254 | 0.1125 | |||
| PG / The Procter & Gamble Company | 0.02 | -15.06 | 2.05 | -15.37 | 0.3962 | -0.0727 | |||
| CSCO / Cisco Systems, Inc. | 0.04 | -9.02 | 2.00 | -6.76 | 0.3869 | -0.0287 | |||
| DIS / The Walt Disney Company | 0.01 | -0.87 | 2.00 | -5.58 | 0.3865 | -0.0234 | |||
| IBM / International Business Machines Corporation | 0.01 | 1.70 | 1.98 | 11.88 | 0.3826 | 0.0401 | |||
| LHX / L3Harris Technologies, Inc. | 0.01 | -4.09 | 1.90 | 2.31 | 0.3677 | 0.0078 | |||
| TXN / Texas Instruments Incorporated | 0.01 | -31.29 | 1.90 | -30.10 | 0.3676 | -0.1590 | |||
| INTC / Intel Corporation | 0.03 | 2.64 | 1.85 | -10.00 | 0.3588 | -0.0404 | |||
| VZ / Verizon Communications Inc. | 0.03 | -13.83 | 1.83 | -16.97 | 0.3540 | -0.0730 | |||
| HD / The Home Depot, Inc. | 0.01 | 0.00 | 1.77 | 4.49 | 0.3424 | 0.0142 | |||
| DBX / Dropbox, Inc. | 0.06 | 0.10 | 1.73 | 13.78 | 0.3350 | 0.0407 | |||
| DCI / Donaldson Company, Inc. | 0.03 | -0.28 | 1.67 | 8.93 | 0.3233 | 0.0261 | |||
| BAC / Bank of America Corporation | 0.04 | -22.76 | 1.58 | -17.67 | 0.3064 | -0.0663 | |||
| ABBV / AbbVie Inc. | 0.01 | -34.72 | 1.56 | -32.05 | 0.3027 | -0.1434 | |||
| RTX / RTX Corporation | 0.02 | -15.71 | 1.56 | -6.91 | 0.3022 | -0.0229 | |||
| BMY / Bristol-Myers Squibb Company | 0.02 | -23.62 | 1.54 | -19.16 | 0.2979 | -0.0712 | |||
| ORCL / Oracle Corporation | 0.02 | 0.00 | 1.49 | 10.95 | 0.2880 | 0.0281 | |||
| IEFA / iShares Trust - iShares Core MSCI EAFE ETF | 0.02 | -39.39 | 1.45 | -37.02 | 0.2807 | -0.1647 | |||
| ADSK / Autodesk, Inc. | 0.00 | -1.33 | 1.45 | 3.94 | 0.2805 | 0.0102 | |||
| SYK / Stryker Corporation | 0.01 | -48.87 | 1.39 | -45.49 | 0.2691 | -0.2253 | |||
| DOW / Dow Inc. | 0.02 | -15.52 | 1.33 | -15.36 | 0.2569 | -0.0471 | |||
| DOW / Dow Inc. | 0.02 | 1.31 | 0.2542 | -0.0422 | |||||
| SPSB / SPDR Series Trust - SPDR Portfolio Short Term Corporate Bond ETF | 0.04 | 24.24 | 1.28 | 24.20 | 0.2479 | 0.0484 | |||
| MET / MetLife, Inc. | 0.02 | -1.20 | 1.24 | -2.75 | 0.2391 | -0.0071 | |||
| ITW / Illinois Tool Works Inc. | 0.01 | -21.41 | 1.23 | -20.68 | 0.2381 | -0.0625 | |||
| USB / U.S. Bancorp | 0.02 | -15.69 | 1.23 | -13.12 | 0.2370 | -0.0362 | |||
| GOOG / Alphabet Inc. | 0.00 | -15.97 | 1.21 | 1.76 | 0.2347 | 0.0037 | |||
| NSC / Norfolk Southern Corporation | 0.00 | -54.89 | 1.18 | -55.40 | 0.2279 | -0.2838 | |||
| ALGN / Align Technology, Inc. | 0.00 | 0.00 | 1.14 | 12.82 | 0.2213 | 0.0249 | |||
| AVGO / Broadcom Inc. | 0.00 | 0.00 | 1.13 | 3.10 | 0.2187 | 0.0067 | |||
| C / Citigroup Inc. | 0.02 | 25.98 | 1.08 | 22.56 | 0.2091 | 0.0382 | |||
| ABT / Abbott Laboratories | 0.01 | -42.06 | 1.06 | -43.96 | 0.2056 | -0.1619 | |||
| GE / General Electric Company | 0.05 | -60.00 | 1.05 | -49.42 | 0.2037 | -0.1997 | |||
| LQD / iShares Trust - iShares iBoxx $ Investment Grade Corporate Bond ETF | 0.01 | -3.42 | 1.04 | -0.19 | 0.2011 | -0.0003 | |||
| STZ / Constellation Brands, Inc. | 0.00 | 5.61 | 1.03 | 8.26 | 0.1999 | 0.0154 | |||
| JNK / SPDR Series Trust - SPDR Bloomberg High Yield Bond ETF | 0.01 | 1.03 | 0.1989 | 0.1989 | |||||
| XPO / XPO, Inc. | 0.01 | 0.00 | 1.01 | 13.42 | 0.1962 | 0.0230 | |||
| BDX / Becton, Dickinson and Company | 0.00 | -11.61 | 0.98 | -11.60 | 0.1902 | -0.0253 | |||
| IRDM / Iridium Communications Inc. | 0.02 | -1.70 | 0.98 | -4.75 | 0.1902 | -0.0098 | |||
| CVX / Chevron Corporation | 0.01 | -61.53 | 0.96 | -61.54 | 0.1861 | -0.2984 | |||
| AMAT / Applied Materials, Inc. | 0.01 | 0.00 | 0.93 | 6.68 | 0.1791 | 0.0110 | |||
| GSK / GSK plc - Depositary Receipt (Common Stock) | 0.02 | 6.24 | 0.92 | 18.65 | 0.1772 | 0.0276 | |||
| MMM / 3M Company | 0.00 | -5.91 | 0.89 | -2.94 | 0.1726 | -0.0055 | |||
| EMB / iShares Trust - iShares J.P. Morgan USD Emerging Markets Bond ETF | 0.01 | 0.88 | 0.1706 | 0.1706 | |||||
| WSM / Williams-Sonoma, Inc. | 0.01 | 0.23 | 0.85 | -10.71 | 0.1644 | -0.0200 | |||
| HSY / The Hershey Company | 0.00 | -1.02 | 0.85 | 9.01 | 0.1639 | 0.0133 | |||
| CFX / Colfax Corp | 0.02 | 5.23 | 0.83 | 9.95 | 0.1604 | 0.0143 | |||
| CFG / Citizens Financial Group, Inc. | 0.02 | 0.00 | 0.82 | 3.92 | 0.1588 | 0.0058 | |||
| LOW / Lowe's Companies, Inc. | 0.00 | -26.95 | 0.79 | -25.52 | 0.1524 | -0.0525 | |||
| CHD / Church & Dwight Co., Inc. | 0.01 | 0.00 | 0.76 | -2.44 | 0.1470 | -0.0039 | |||
| SHW / The Sherwin-Williams Company | 0.00 | 50.00 | 0.74 | -44.58 | 0.1424 | -0.1149 | |||
| TSLA / Tesla, Inc. | 0.00 | -4.72 | 0.69 | -3.11 | 0.1327 | -0.0045 | |||
| NVDA / NVIDIA Corporation | 0.00 | -2.88 | 0.67 | 45.57 | 0.1304 | 0.0407 | |||
| SNY / Sanofi - Depositary Receipt (Common Stock) | 0.01 | 0.00 | 0.66 | 6.62 | 0.1277 | 0.0078 | |||
| WMT / Walmart Inc. | 0.00 | 0.00 | 0.65 | 3.84 | 0.1255 | 0.0045 | |||
| SJNK / SPDR Series Trust - SPDR Bloomberg Short Term High Yield Bond ETF | 0.02 | -12.50 | 0.64 | -11.77 | 0.1231 | -0.0163 | |||
| AZN / AstraZeneca PLC - Depositary Receipt (Common Stock) | 0.01 | 0.00 | 0.62 | 20.39 | 0.1199 | 0.0202 | |||
| RSG / Republic Services, Inc. | 0.01 | -11.05 | 0.62 | -1.43 | 0.1199 | -0.0019 | |||
| BRK.B / Berkshire Hathaway Inc. | 0.00 | -1.78 | 0.61 | 6.81 | 0.1184 | 0.0074 | |||
| XOM / Exxon Mobil Corporation | 0.01 | -69.10 | 0.54 | -65.06 | 0.1050 | -0.1960 | |||
| TTE / TotalEnergies SE - Depositary Receipt (Common Stock) | 0.01 | 0.00 | 0.53 | -2.75 | 0.1025 | -0.0031 | |||
| NUE / Nucor Corporation | 0.01 | 0.00 | 0.48 | 19.70 | 0.0929 | 0.0152 | |||
| DUK / Duke Energy Corporation | 0.00 | -49.00 | 0.47 | -47.83 | 0.0905 | -0.0832 | |||
| LDUR / PIMCO ETF Trust - PIMCO Enhanced Low Duration Active Exchange-Traded Fund | 0.00 | -13.30 | 0.46 | -13.59 | 0.0896 | -0.0140 | |||
| IEF / iShares Trust - iShares 7-10 Year Treasury Bond ETF | 0.00 | 0.45 | 0.0872 | 0.0872 | |||||
| MO / Altria Group, Inc. | 0.01 | 0.35 | 0.45 | -6.67 | 0.0867 | -0.0063 | |||
| OLED / Universal Display Corporation | 0.00 | -20.52 | 0.45 | -25.42 | 0.0862 | -0.0293 | |||
| T / AT&T Inc. | 0.02 | -44.97 | 0.44 | -47.69 | 0.0855 | -0.0782 | |||
| EOG / EOG Resources, Inc. | 0.01 | -17.81 | 0.42 | -5.58 | 0.0818 | -0.0050 | |||
| BLL / Ball Corp. | 0.01 | 0.00 | 0.41 | -4.38 | 0.0803 | -0.0038 | |||
| D / Dominion Energy, Inc. | 0.01 | -29.85 | 0.41 | -32.11 | 0.0785 | -0.0373 | |||
| EPD / Enterprise Products Partners L.P. - Limited Partnership | 0.02 | -15.83 | 0.39 | -7.67 | 0.0744 | -0.0061 | |||
| BFAM / Bright Horizons Family Solutions Inc. | 0.00 | -24.17 | 0.37 | -34.92 | 0.0714 | -0.0385 | |||
| COST / Costco Wholesale Corporation | 0.00 | 0.00 | 0.35 | 12.26 | 0.0673 | 0.0073 | |||
| AME / AMETEK, Inc. | 0.00 | 0.00 | 0.33 | 4.75 | 0.0640 | 0.0028 | |||
| ADBE / Adobe Inc. | 0.00 | 0.00 | 0.29 | 23.11 | 0.0567 | 0.0106 | |||
| UPS / United Parcel Service, Inc. | 0.00 | -33.59 | 0.27 | -18.84 | 0.0517 | -0.0121 | |||
| AMZN / Amazon.com, Inc. | 0.00 | 0.00 | 0.27 | 11.34 | 0.0513 | 0.0052 | |||
| AXP / American Express Company | 0.00 | -32.62 | 0.24 | -21.38 | 0.0462 | -0.0127 | |||
| AMGN / Amgen Inc. | 0.00 | 0.00 | 0.22 | -1.75 | 0.0433 | -0.0008 | |||
| IEMG / iShares, Inc. - iShares Core MSCI Emerging Markets ETF | 0.00 | -94.79 | 0.22 | -94.58 | 0.0427 | -0.7451 | |||
| HSIC / Henry Schein, Inc. | 0.00 | -18.88 | 0.20 | -13.19 | 0.0395 | -0.0061 | |||
| F / Ford Motor Company | 0.01 | 0.00 | 0.15 | 21.14 | 0.0288 | 0.0050 | |||
| ENB / Enbridge Inc. | 0.00 | -100.00 | 0.00 | -100.00 | -0.0674 | ||||
| OTIS / Otis Worldwide Corporation | 0.00 | -100.00 | 0.00 | -100.00 | -0.0434 | ||||
| CAT / Caterpillar Inc. | 0.00 | -100.00 | 0.00 | -100.00 | -0.0531 | ||||
| EMN / Eastman Chemical Company | 0.00 | -100.00 | 0.00 | -100.00 | -0.1298 | ||||
| CVS / CVS Health Corporation | 0.00 | -100.00 | 0.00 | -100.00 | -0.0415 | ||||
| SGEN / Seagen Inc | 0.00 | -100.00 | 0.00 | -100.00 | -0.0403 | ||||
| PM / Philip Morris International Inc. | 0.00 | -100.00 | 0.00 | -100.00 | -0.0752 | ||||
| BA / The Boeing Company | 0.00 | -100.00 | 0.00 | -100.00 | -0.1259 | ||||
| CB / Chubb Limited | 0.00 | -100.00 | 0.00 | -100.00 | -0.0502 | ||||
| CARR / Carrier Global Corporation | 0.00 | -100.00 | 0.00 | -100.00 | -0.0535 | ||||
| SO / The Southern Company | 0.00 | -100.00 | 0.00 | -100.00 | -0.0920 | ||||
| MCK / McKesson Corporation | 0.00 | -100.00 | 0.00 | -100.00 | -0.0639 | ||||
| VRTX / Vertex Pharmaceuticals Incorporated | 0.00 | -100.00 | 0.00 | -100.00 | -0.0804 | ||||
| CHKP / Check Point Software Technologies Ltd. | 0.00 | -100.00 | 0.00 | -100.00 | -0.0484 | ||||
| ADM / Archer-Daniels-Midland Company | 0.00 | -100.00 | 0.00 | -100.00 | -0.0523 | ||||
| KHC / The Kraft Heinz Company | 0.00 | -100.00 | 0.00 | -100.00 | -0.0391 | ||||
| GIS / General Mills, Inc. | 0.00 | -100.00 | 0.00 | -100.00 | -0.0511 | ||||
| DE / Deere & Company | 0.00 | -100.00 | 0.00 | -100.00 | -0.0471 | ||||
| BP / BP p.l.c. - Depositary Receipt (Common Stock) | 0.00 | -100.00 | 0.00 | -100.00 | -0.0765 |