Mga Batayang Estadistika
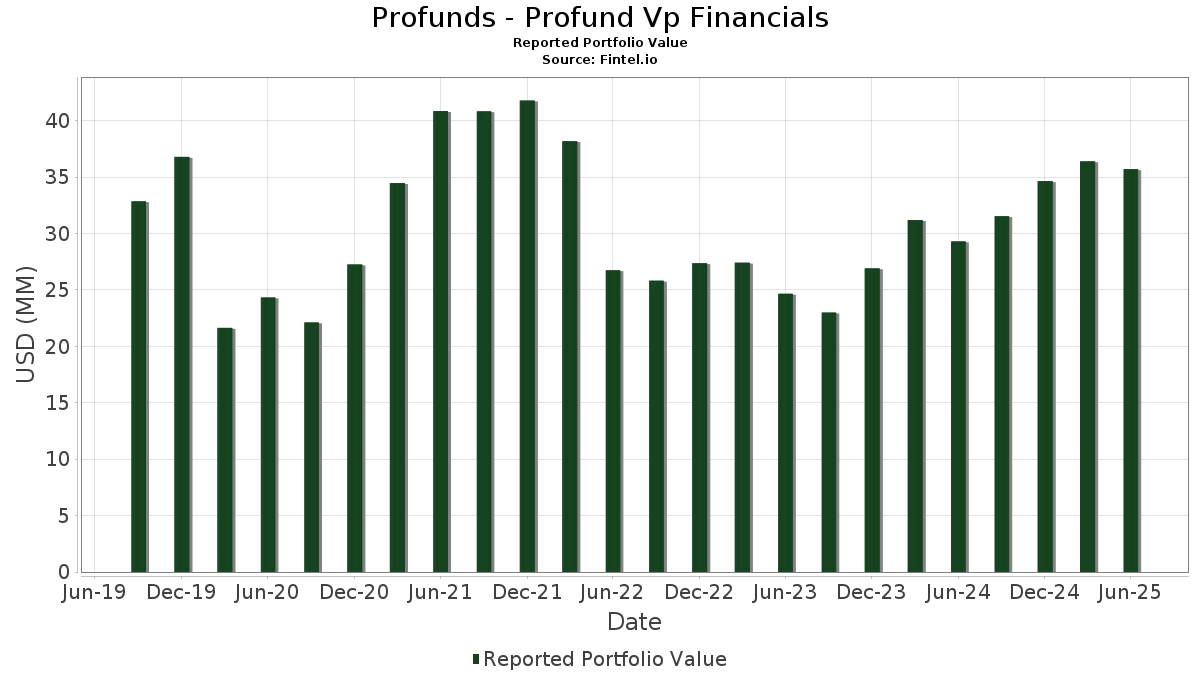
| Nilai Portofolio | $ 35,704,740 |
| Posisi Saat Ini | 82 |
Kepemilikan Terbaru, Kinerja, AUM (dari 13F, 13D)
Profunds - Profund Vp Financials telah mengungkapkan total kepemilikan 82 dalam pengajuan SEC terbaru mereka. Nilai portofolio terbaru dihitung sebesar $ 35,704,740 USD. Aset yang Dikelola (AUM) sebenarnya adalah nilai ini ditambah kas (yang tidak diungkapkan). Aset-aset utama Profunds - Profund Vp Financials adalah Berkshire Hathaway Inc. (US:BRK.B) , JPMorgan Chase & Co. (US:JPM) , Visa Inc. (US:V) , Mastercard Incorporated (US:MA) , and Bank of America Corporation (US:BAC) .
Peningkatan Tertinggi Kuartal Ini
Kami menggunakan perubahan dalam alokasi portofolio karena ini adalah metrik yang paling bermakna. Perubahan dapat disebabkan oleh perdagangan atau perubahan harga saham.
| Keamanan | Saham (MM) |
Nilai (Juta Dolar AS) |
Portfolio % | ΔPorsyento ng Portfolio |
|---|---|---|---|---|
| 0.01 | 3.86 | 10.7875 | 1.1413 | |
| 0.00 | 0.36 | 0.9918 | 0.9918 | |
| 0.00 | 0.65 | 1.8221 | 0.8610 | |
| 0.00 | 1.04 | 2.9081 | 0.5111 | |
| 0.13 | 0.3743 | 0.3743 | ||
| 0.01 | 0.83 | 2.3297 | 0.2995 | |
| 0.03 | 1.49 | 4.1518 | 0.2658 | |
| 0.00 | 0.85 | 2.3639 | 0.2638 | |
| 0.01 | 0.76 | 2.1287 | 0.2546 | |
| 0.09 | 0.2514 | 0.2514 |
Penurunan Tertinggi Kuartal Ini
Kami menggunakan perubahan dalam alokasi portofolio karena ini adalah metrik yang paling bermakna. Perubahan dapat disebabkan oleh perdagangan atau perubahan harga saham.
| Keamanan | Saham (MM) |
Nilai (Juta Dolar AS) |
Portfolio % | ΔPorsyento ng Portfolio |
|---|---|---|---|---|
| 0.01 | 4.27 | 11.9272 | -1.8014 | |
| 0.00 | 0.46 | 1.2801 | -0.4868 | |
| 0.01 | 2.91 | 8.1335 | -0.3607 | |
| 0.00 | 0.52 | 1.4425 | -0.2428 | |
| 0.00 | 0.75 | 2.0946 | -0.2367 | |
| 0.00 | 0.37 | 1.0314 | -0.1819 | |
| 0.00 | 2.18 | 6.1029 | -0.1754 | |
| 0.00 | 0.52 | 1.4454 | -0.1373 | |
| 0.00 | 0.39 | 1.0981 | -0.1372 | |
| 0.00 | 0.25 | 0.6870 | -0.0870 |
Pengajuan 13F dan Dana
Formulir ini diajukan pada 2025-08-26 untuk periode pelaporan 2025-06-30. Klik ikon tautan untuk melihat riwayat transaksi selengkapnya.
Tingkatkan ke versi premium untuk membuka data premium dan ekspor ke Excel. ![]() .
.
| Keamanan | Ketik | Harga Saham Rata-rata | Saham (MM) |
ΔSaham (%) |
ΔSaham (%) |
Nilai ($MM) |
Portpolyo (%) |
ΔPortofolio (%) |
|
|---|---|---|---|---|---|---|---|---|---|
| BRK.B / Berkshire Hathaway Inc. | 0.01 | -7.36 | 4.27 | -15.52 | 11.9272 | -1.8014 | |||
| JPM / JPMorgan Chase & Co. | 0.01 | -7.97 | 3.86 | 8.76 | 10.7875 | 1.1413 | |||
| V / Visa Inc. | 0.01 | -8.07 | 2.91 | -6.88 | 8.1335 | -0.3607 | |||
| MA / Mastercard Incorporated | 0.00 | -7.78 | 2.18 | -5.45 | 6.1029 | -0.1754 | |||
| BAC / Bank of America Corporation | 0.03 | -8.36 | 1.49 | 3.92 | 4.1518 | 0.2658 | |||
| WFC / Wells Fargo & Company | 0.02 | -8.38 | 1.25 | 2.21 | 3.4911 | 0.1704 | |||
| GS / The Goldman Sachs Group, Inc. | 0.00 | -8.92 | 1.04 | 18.03 | 2.9081 | 0.5111 | |||
| AXP / American Express Company | 0.00 | -7.66 | 0.85 | 9.59 | 2.3639 | 0.2638 | |||
| MS / Morgan Stanley | 0.01 | -7.56 | 0.83 | 11.65 | 2.3297 | 0.2995 | |||
| SPGI / S&P Global Inc. | 0.00 | -7.73 | 0.79 | -4.23 | 2.2167 | -0.0348 | |||
| C / Citigroup Inc. | 0.01 | -7.86 | 0.76 | 10.60 | 2.1287 | 0.2546 | |||
| PGR / The Progressive Corporation | 0.00 | -7.32 | 0.75 | -12.70 | 2.0946 | -0.2367 | |||
| SCHW / The Charles Schwab Corporation | 0.01 | -7.19 | 0.75 | 8.12 | 2.0866 | 0.2105 | |||
| BLK / BlackRock, Inc. | 0.00 | -7.43 | 0.73 | 2.66 | 2.0458 | 0.1069 | |||
| COF / Capital One Financial Corporation | 0.00 | 55.40 | 0.65 | 84.70 | 1.8221 | 0.8610 | |||
| BX / Blackstone Inc. | 0.00 | -7.71 | 0.52 | -1.13 | 1.4611 | 0.0222 | |||
| CB / Chubb Limited | 0.00 | -7.41 | 0.52 | -11.17 | 1.4454 | -0.1373 | |||
| MMC / Marsh & McLennan Companies, Inc. | 0.00 | -7.08 | 0.52 | -16.77 | 1.4425 | -0.2428 | |||
| ICE / Intercontinental Exchange, Inc. | 0.00 | -7.53 | 0.50 | -1.75 | 1.4093 | 0.0156 | |||
| CME / CME Group Inc. | 0.00 | -7.40 | 0.48 | -3.85 | 1.3296 | -0.0146 | |||
| FI / Fiserv, Inc. | 0.00 | -9.75 | 0.46 | -29.54 | 1.2801 | -0.4868 | |||
| KKR / KKR & Co. Inc. | 0.00 | -7.13 | 0.43 | 6.95 | 1.2058 | 0.1084 | |||
| AJG / Arthur J. Gallagher & Co. | 0.00 | -6.76 | 0.39 | -13.44 | 1.0981 | -0.1372 | |||
| MCO / Moody's Corporation | 0.00 | -7.37 | 0.37 | -0.27 | 1.0396 | 0.0262 | |||
| AON / Aon plc | 0.00 | -7.51 | 0.37 | -17.26 | 1.0314 | -0.1819 | |||
| COIN / Coinbase Global, Inc. | 0.00 | 0.36 | 0.9918 | 0.9918 | |||||
| PNC / The PNC Financial Services Group, Inc. | 0.00 | -7.51 | 0.35 | -1.94 | 0.9873 | 0.0083 | |||
| PYPL / PayPal Holdings, Inc. | 0.00 | -8.96 | 0.35 | 3.59 | 0.9678 | 0.0600 | |||
| USB / U.S. Bancorp | 0.01 | -7.52 | 0.34 | -0.88 | 0.9439 | 0.0177 | |||
| BK / The Bank of New York Mellon Corporation | 0.00 | -7.70 | 0.31 | 0.32 | 0.8727 | 0.0262 | |||
| APO / Apollo Global Management, Inc. | 0.00 | -6.48 | 0.31 | -2.85 | 0.8576 | -0.0034 | |||
| TRV / The Travelers Companies, Inc. | 0.00 | -7.50 | 0.29 | -6.45 | 0.8116 | -0.0319 | |||
| TFC / Truist Financial Corporation | 0.01 | -7.85 | 0.27 | -3.93 | 0.7538 | -0.0078 | |||
| ALL / The Allstate Corporation | 0.00 | -7.51 | 0.26 | -10.21 | 0.7136 | -0.0583 | |||
| AFL / Aflac Incorporated | 0.00 | -8.98 | 0.25 | -13.73 | 0.6870 | -0.0870 | |||
| AMP / Ameriprise Financial, Inc. | 0.00 | -8.43 | 0.24 | 0.83 | 0.6798 | 0.0248 | |||
| AIG / American International Group, Inc. | 0.00 | -10.03 | 0.24 | -11.28 | 0.6606 | -0.0648 | |||
| MET / MetLife, Inc. | 0.00 | -9.81 | 0.22 | -9.58 | 0.6072 | -0.0466 | |||
| MSCI / MSCI Inc. | 0.00 | -7.71 | 0.21 | -6.17 | 0.5977 | -0.0199 | |||
| FIS / Fidelity National Information Services, Inc. | 0.00 | -8.17 | 0.20 | 0.00 | 0.5726 | 0.0163 | |||
| PRU / Prudential Financial, Inc. | 0.00 | -7.37 | 0.18 | -10.78 | 0.5093 | -0.0466 | |||
| NDAQ / Nasdaq, Inc. | 0.00 | -7.52 | 0.18 | 9.26 | 0.4948 | 0.0533 | |||
| HIG / The Hartford Insurance Group, Inc. | 0.00 | -8.53 | 0.17 | -6.52 | 0.4827 | -0.0179 | |||
| ACGL / Arch Capital Group Ltd. | 0.00 | -7.78 | 0.16 | -12.90 | 0.4550 | -0.0519 | |||
| MTB / M&T Bank Corporation | 0.00 | -10.48 | 0.15 | -2.61 | 0.4167 | -0.0005 | |||
| BRO / Brown & Brown, Inc. | 0.00 | 9.36 | 0.15 | -2.63 | 0.4159 | 0.0009 | |||
| WTW / Willis Towers Watson Public Limited Company | 0.00 | -8.12 | 0.15 | -16.67 | 0.4067 | -0.0680 | |||
| STT / State Street Corporation | 0.00 | -8.44 | 0.15 | 9.02 | 0.4061 | 0.0429 | |||
| HSBC SECURITIES (USA), INC. B 4.3 , 7/01/2025 / RA (N/A) | 0.13 | 0.3743 | 0.3743 | ||||||
| RJF / Raymond James Financial, Inc. | 0.00 | -8.90 | 0.13 | 0.76 | 0.3727 | 0.0123 | |||
| FITB / Fifth Third Bancorp | 0.00 | -7.70 | 0.13 | -2.96 | 0.3676 | -0.0016 | |||
| SYF / Synchrony Financial | 0.00 | -9.29 | 0.12 | 14.15 | 0.3402 | 0.0508 | |||
| NTRS / Northern Trust Corporation | 0.00 | -7.99 | 0.12 | 18.00 | 0.3304 | 0.0587 | |||
| CBOE / Cboe Global Markets, Inc. | 0.00 | -7.38 | 0.12 | -4.10 | 0.3270 | -0.0062 | |||
| HBAN / Huntington Bancshares Incorporated | 0.01 | -7.20 | 0.12 | 4.46 | 0.3269 | 0.0200 | |||
| CPAY / Corpay, Inc. | 0.00 | -6.37 | 0.11 | -10.40 | 0.3133 | -0.0287 | |||
| CINF / Cincinnati Financial Corporation | 0.00 | -7.53 | 0.11 | -6.72 | 0.3116 | -0.0135 | |||
| WRB / W. R. Berkley Corporation | 0.00 | -7.53 | 0.11 | -4.55 | 0.2949 | -0.0055 | |||
| TROW / T. Rowe Price Group, Inc. | 0.00 | -8.33 | 0.10 | -3.81 | 0.2847 | -0.0029 | |||
| RF / Regions Financial Corporation | 0.00 | -8.42 | 0.10 | -0.98 | 0.2831 | 0.0053 | |||
| GPN / Global Payments Inc. | 0.00 | -8.81 | 0.09 | -25.60 | 0.2614 | -0.0797 | |||
| CFG / Citizens Financial Group, Inc. | 0.00 | -8.13 | 0.09 | 1.09 | 0.2599 | 0.0080 | |||
| SOCIETE' GENERALE 4.26 , 7/01/2025 / RA (N/A) | 0.09 | 0.2514 | 0.2514 | ||||||
| KEY / KeyCorp | 0.00 | -8.30 | 0.08 | 0.00 | 0.2301 | 0.0061 | |||
| FDS / FactSet Research Systems Inc. | 0.00 | -7.61 | 0.08 | -8.99 | 0.2274 | -0.0159 | |||
| PFG / Principal Financial Group, Inc. | 0.00 | -9.18 | 0.08 | -14.29 | 0.2194 | -0.0302 | |||
| L / Loews Corporation | 0.00 | -8.85 | 0.08 | -9.52 | 0.2135 | -0.0149 | |||
| EG / Everest Group, Ltd. | 0.00 | -8.11 | 0.07 | -13.75 | 0.1937 | -0.0255 | |||
| JKHY / Jack Henry & Associates, Inc. | 0.00 | -7.43 | 0.06 | -8.82 | 0.1756 | -0.0114 | |||
| GL / Globe Life Inc. | 0.00 | -8.97 | 0.05 | -14.04 | 0.1375 | -0.0182 | |||
| AIZ / Assurant, Inc. | 0.00 | -8.30 | 0.05 | -14.55 | 0.1341 | -0.0170 | |||
| CREDIT AGRICOLE CIB NY 4.26 , 7/01/2025 / RA (N/A) | 0.04 | 0.1257 | 0.1257 | ||||||
| ERIE / Erie Indemnity Company | 0.00 | -6.98 | 0.04 | -24.07 | 0.1162 | -0.0306 | |||
| MKTX / MarketAxess Holdings Inc. | 0.00 | -7.69 | 0.04 | -4.76 | 0.1123 | -0.0023 | |||
| UMB FINANCIAL CORP. B 4.1 , 7/01/2025 / RA (N/A) | 0.04 | 0.1117 | 0.1117 | ||||||
| NATWEST MARKETS PLC 4.24 , 7/01/2025 / RA (N/A) | 0.04 | 0.1034 | 0.1034 | ||||||
| BEN / Franklin Resources, Inc. | 0.00 | -7.41 | 0.04 | 16.67 | 0.0990 | 0.0151 | |||
| IVZ / Invesco Ltd. | 0.00 | -7.50 | 0.03 | -5.71 | 0.0945 | -0.0011 | |||
| VPFN_IXM_GOLDMAN / DE (N/A) | 0.02 | 0.0698 | 0.0698 | ||||||
| ROYAL BANK OF CANADA 4.15 , 7/01/2025 / RA (N/A) | 0.02 | 0.0615 | 0.0615 | ||||||
| FHN / First Horizon Corporation | 0.00 | 0.00 | 0.0000 | 0.0000 | |||||
| VPFN_IXM_GOLDMAN / DE (N/A) | -0.01 | -0.0152 | -0.0152 |