Mga Batayang Estadistika
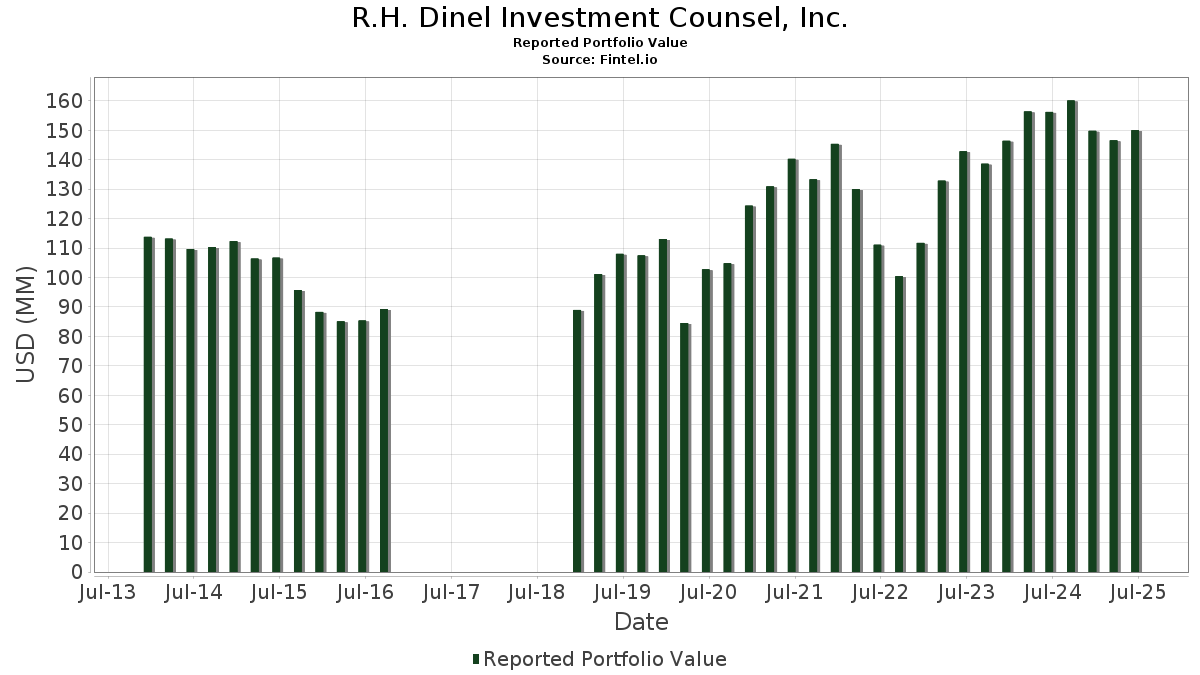
| Nilai Portofolio | $ 150,028,447 |
| Posisi Saat Ini | 42 |
Kepemilikan Terbaru, Kinerja, AUM (dari 13F, 13D)
R.H. Dinel Investment Counsel, Inc. telah mengungkapkan total kepemilikan 42 dalam pengajuan SEC terbaru mereka. Nilai portofolio terbaru dihitung sebesar $ 150,028,447 USD. Aset yang Dikelola (AUM) sebenarnya adalah nilai ini ditambah kas (yang tidak diungkapkan). Aset-aset utama R.H. Dinel Investment Counsel, Inc. adalah Microsoft Corporation (US:MSFT) , Meta Platforms, Inc. (US:META) , Adobe Inc. (US:ADBE) , Oracle Corporation (US:ORCL) , and Automatic Data Processing, Inc. (US:ADP) .
Peningkatan Tertinggi Kuartal Ini
Kami menggunakan perubahan dalam alokasi portofolio karena ini adalah metrik yang paling bermakna. Perubahan dapat disebabkan oleh perdagangan atau perubahan harga saham.
| Keamanan | Saham (MM) |
Nilai (Juta Dolar AS) |
Portfolio % | ΔPorsyento ng Portfolio |
|---|---|---|---|---|
| 0.05 | 24.82 | 16.5440 | 3.4230 | |
| 0.04 | 9.34 | 6.2225 | 1.9963 | |
| 0.02 | 11.68 | 7.7854 | 1.5618 | |
| 0.01 | 2.41 | 1.6061 | 0.2739 | |
| 0.03 | 1.37 | 0.9103 | 0.1512 | |
| 0.04 | 3.99 | 2.6591 | 0.1342 | |
| 0.00 | 1.22 | 0.8149 | 0.1090 | |
| 0.01 | 0.76 | 0.5053 | 0.0457 | |
| 0.00 | 0.37 | 0.2477 | 0.0248 | |
| 0.01 | 0.23 | 0.1529 | 0.0010 |
Penurunan Tertinggi Kuartal Ini
Kami menggunakan perubahan dalam alokasi portofolio karena ini adalah metrik yang paling bermakna. Perubahan dapat disebabkan oleh perdagangan atau perubahan harga saham.
| Keamanan | Saham (MM) |
Nilai (Juta Dolar AS) |
Portfolio % | ΔPorsyento ng Portfolio |
|---|---|---|---|---|
| 0.02 | 8.01 | 5.3365 | -1.5666 | |
| 0.02 | 6.29 | 4.1920 | -0.7080 | |
| 0.03 | 4.90 | 3.2651 | -0.6400 | |
| 0.05 | 8.08 | 5.3846 | -0.6396 | |
| 0.04 | 3.54 | 2.3607 | -0.5266 | |
| 0.07 | 6.02 | 4.0111 | -0.3846 | |
| 0.01 | 4.64 | 3.0921 | -0.3783 | |
| 0.02 | 2.00 | 1.3335 | -0.3258 | |
| 0.02 | 2.24 | 1.4960 | -0.2431 | |
| 0.04 | 1.35 | 0.9019 | -0.2399 |
Pengajuan 13F dan Dana
Formulir ini diajukan pada 2025-07-14 untuk periode pelaporan 2025-06-30. Klik ikon tautan untuk melihat riwayat transaksi selengkapnya.
Tingkatkan ke versi premium untuk membuka data premium dan ekspor ke Excel. ![]() .
.
| Keamanan | Ketik | Harga Saham Rata-rata | Saham (MM) |
ΔSaham (%) |
ΔSaham (%) |
Nilai ($MM) |
Portpolyo (%) |
ΔPortofolio (%) |
|
|---|---|---|---|---|---|---|---|---|---|
| MSFT / Microsoft Corporation | 0.05 | -2.59 | 24.82 | 29.08 | 16.5440 | 3.4230 | |||
| META / Meta Platforms, Inc. | 0.02 | 0.00 | 11.68 | 28.07 | 7.7854 | 1.5618 | |||
| ADBE / Adobe Inc. | 0.02 | -0.90 | 9.56 | -0.04 | 6.3707 | -0.1534 | |||
| ORCL / Oracle Corporation | 0.04 | -3.61 | 9.34 | 50.73 | 6.2225 | 1.9963 | |||
| ADP / Automatic Data Processing, Inc. | 0.03 | -2.12 | 8.92 | -1.20 | 5.9459 | -0.2146 | |||
| QCOM / QUALCOMM Incorporated | 0.05 | -11.74 | 8.08 | -8.50 | 5.3846 | -0.6396 | |||
| TMO / Thermo Fisher Scientific Inc. | 0.02 | -2.88 | 8.01 | -20.86 | 5.3365 | -1.5666 | |||
| AMGN / Amgen Inc. | 0.02 | -2.28 | 6.29 | -12.42 | 4.1920 | -0.7080 | |||
| SBUX / Starbucks Corporation | 0.07 | 0.00 | 6.02 | -6.60 | 4.0111 | -0.3846 | |||
| CVX / Chevron Corporation | 0.03 | 0.00 | 4.90 | -14.40 | 3.2651 | -0.6400 | |||
| BRK.B / Berkshire Hathaway Inc. | 0.01 | 0.00 | 4.64 | -8.79 | 3.0921 | -0.3783 | |||
| TROW / T. Rowe Price Group, Inc. | 0.04 | -7.17 | 4.06 | -2.50 | 2.7047 | -0.1350 | |||
| WMT / Walmart Inc. | 0.04 | -3.20 | 3.99 | 7.81 | 2.6591 | 0.1342 | |||
| KO / The Coca-Cola Company | 0.06 | -2.91 | 3.95 | -4.08 | 2.6338 | -0.1775 | |||
| MRK / Merck & Co., Inc. | 0.04 | -5.09 | 3.54 | -16.31 | 2.3607 | -0.5266 | |||
| CL / Colgate-Palmolive Company | 0.03 | -2.99 | 2.51 | -5.90 | 1.6707 | -0.1466 | |||
| HUBB / Hubbell Incorporated | 0.01 | 0.00 | 2.41 | 23.41 | 1.6061 | 0.2739 | |||
| XOM / Exxon Mobil Corporation | 0.02 | 0.00 | 2.40 | -9.38 | 1.5982 | -0.2068 | |||
| PEP / PepsiCo, Inc. | 0.02 | 0.00 | 2.24 | -11.93 | 1.4960 | -0.2431 | |||
| OKE / ONEOK, Inc. | 0.02 | 0.00 | 2.00 | -17.73 | 1.3335 | -0.3258 | |||
| CMCSA / Comcast Corporation | 0.05 | -2.55 | 1.91 | -5.78 | 1.2709 | -0.1095 | |||
| HSY / The Hershey Company | 0.01 | -6.04 | 1.81 | -8.83 | 1.2046 | -0.1480 | |||
| PFE / Pfizer Inc. | 0.07 | -4.20 | 1.65 | -8.35 | 1.0976 | -0.1285 | |||
| EPD / Enterprise Products Partners L.P. - Limited Partnership | 0.05 | 0.00 | 1.62 | -9.18 | 1.0820 | -0.1375 | |||
| KMB / Kimberly-Clark Corporation | 0.01 | 0.00 | 1.60 | -9.35 | 1.0669 | -0.1380 | |||
| EXAS / Exact Sciences Corporation | 0.03 | 0.00 | 1.37 | 22.75 | 0.9103 | 0.1512 | |||
| SLB / Schlumberger Limited | 0.04 | 0.00 | 1.35 | -19.13 | 0.9019 | -0.2399 | |||
| DLB / Dolby Laboratories, Inc. | 0.02 | 0.00 | 1.31 | -7.55 | 0.8736 | -0.0936 | |||
| JPM / JPMorgan Chase & Co. | 0.00 | 0.00 | 1.22 | 18.18 | 0.8149 | 0.1090 | |||
| SIRI / Sirius XM Holdings Inc. | 0.04 | -3.29 | 1.02 | -1.44 | 0.6827 | -0.0266 | |||
| A / Agilent Technologies, Inc. | 0.01 | 0.00 | 0.91 | 0.89 | 0.6057 | -0.0089 | |||
| VZ / Verizon Communications Inc. | 0.02 | 0.00 | 0.79 | -4.61 | 0.5247 | -0.0384 | |||
| LLYVA / Liberty Live Group | 0.01 | -4.77 | 0.76 | 12.63 | 0.5053 | 0.0457 | |||
| UPS / United Parcel Service, Inc. | 0.01 | -6.93 | 0.64 | -14.61 | 0.4289 | -0.0852 | |||
| SHEL / Shell plc - Depositary Receipt (Common Stock) | 0.01 | -6.15 | 0.56 | -9.76 | 0.3762 | -0.0509 | |||
| T / AT&T Inc. | 0.02 | 0.00 | 0.47 | 2.38 | 0.3162 | -0.0001 | |||
| PG / The Procter & Gamble Company | 0.00 | 0.00 | 0.44 | -6.42 | 0.2913 | -0.0277 | |||
| LLYVK / Liberty Live Group | 0.00 | -4.50 | 0.37 | 13.80 | 0.2477 | 0.0248 | |||
| PAA / Plains All American Pipeline, L.P. - Limited Partnership | 0.02 | 0.00 | 0.31 | -8.53 | 0.2076 | -0.0244 | |||
| WBD / Warner Bros. Discovery, Inc. | 0.02 | -9.36 | 0.28 | -3.08 | 0.1887 | -0.0108 | |||
| KMI / Kinder Morgan, Inc. | 0.01 | 0.00 | 0.23 | 3.15 | 0.1529 | 0.0010 | |||
| GIS / General Mills, Inc. | 0.00 | 0.00 | 0.06 | -12.70 | 0.0368 | -0.0067 |