Mga Batayang Estadistika
| Nilai Portofolio | $ 177,286,278 |
| Posisi Saat Ini | 38 |
Kepemilikan Terbaru, Kinerja, AUM (dari 13F, 13D)
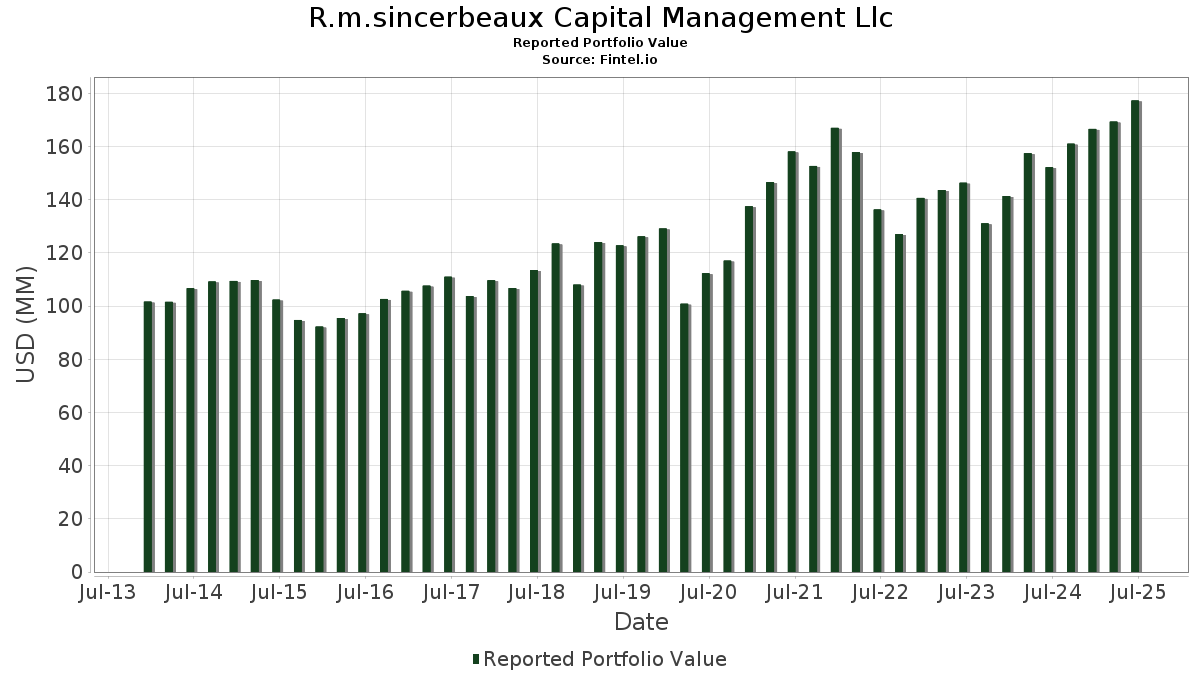
R.m.sincerbeaux Capital Management Llc telah mengungkapkan total kepemilikan 38 dalam pengajuan SEC terbaru mereka. Nilai portofolio terbaru dihitung sebesar $ 177,286,278 USD. Aset yang Dikelola (AUM) sebenarnya adalah nilai ini ditambah kas (yang tidak diungkapkan). Aset-aset utama R.m.sincerbeaux Capital Management Llc adalah Microsoft Corporation (US:MSFT) , Visa Inc. (US:V) , The Williams Companies, Inc. (US:WMB) , Automatic Data Processing, Inc. (US:ADP) , and Kinder Morgan, Inc. (US:KMI) .
Peningkatan Tertinggi Kuartal Ini
Kami menggunakan perubahan dalam alokasi portofolio karena ini adalah metrik yang paling bermakna. Perubahan dapat disebabkan oleh perdagangan atau perubahan harga saham.
| Keamanan | Saham (MM) |
Nilai (Juta Dolar AS) |
Portfolio % | ΔPorsyento ng Portfolio |
|---|---|---|---|---|
| 0.05 | 22.42 | 12.6466 | 2.8398 | |
| 0.03 | 8.69 | 4.9009 | 0.5597 | |
| 0.01 | 7.43 | 4.1917 | 0.5291 | |
| 0.17 | 7.82 | 4.4119 | 0.3646 | |
| 0.01 | 3.40 | 1.9165 | 0.2313 | |
| 0.02 | 3.73 | 2.1037 | 0.1936 | |
| 0.29 | 18.02 | 10.1639 | 0.1578 | |
| 0.01 | 1.79 | 1.0084 | 0.1477 | |
| 0.03 | 2.53 | 1.4295 | 0.1156 | |
| 0.04 | 2.85 | 1.6084 | 0.1107 |
Penurunan Tertinggi Kuartal Ini
Kami menggunakan perubahan dalam alokasi portofolio karena ini adalah metrik yang paling bermakna. Perubahan dapat disebabkan oleh perdagangan atau perubahan harga saham.
| Keamanan | Saham (MM) |
Nilai (Juta Dolar AS) |
Portfolio % | ΔPorsyento ng Portfolio |
|---|---|---|---|---|
| 0.01 | 1.45 | 0.8206 | -1.6748 | |
| 0.06 | 10.28 | 5.8004 | -0.9300 | |
| 0.08 | 1.86 | 1.0491 | -0.6307 | |
| 0.02 | 0.16 | 0.0878 | -0.4261 | |
| 0.04 | 11.52 | 6.4973 | -0.2954 | |
| 0.03 | 2.70 | 1.5254 | -0.2597 | |
| 0.01 | 1.14 | 0.6418 | -0.1749 | |
| 0.01 | 3.10 | 1.7475 | -0.1569 | |
| 0.06 | 20.54 | 11.5878 | -0.1397 | |
| 0.05 | 8.63 | 4.8689 | -0.0928 |
Pengajuan 13F dan Dana
Formulir ini diajukan pada 2025-08-14 untuk periode pelaporan 2025-06-30. Klik ikon tautan untuk melihat riwayat transaksi selengkapnya.
Tingkatkan ke versi premium untuk membuka data premium dan ekspor ke Excel. ![]() .
.
| Keamanan | Ketik | Harga Saham Rata-rata | Saham (MM) |
ΔSaham (%) |
ΔSaham (%) |
Nilai ($MM) |
Portpolyo (%) |
ΔPortofolio (%) |
|
|---|---|---|---|---|---|---|---|---|---|
| MSFT / Microsoft Corporation | 0.05 | 1.89 | 22.42 | 35.00 | 12.6466 | 2.8398 | |||
| V / Visa Inc. | 0.06 | 2.10 | 20.54 | 3.44 | 11.5878 | -0.1397 | |||
| WMB / The Williams Companies, Inc. | 0.29 | 1.18 | 18.02 | 6.34 | 10.1639 | 0.1578 | |||
| ADP / Automatic Data Processing, Inc. | 0.04 | -0.80 | 11.52 | 0.13 | 6.4973 | -0.2954 | |||
| KMI / Kinder Morgan, Inc. | 0.38 | 0.91 | 11.20 | 3.98 | 6.3159 | -0.0429 | |||
| ABBV / AbbVie Inc. | 0.06 | 1.84 | 10.28 | -9.77 | 5.8004 | -0.9300 | |||
| JPM / JPMorgan Chase & Co. | 0.03 | 0.00 | 8.69 | 18.19 | 4.9009 | 0.5597 | |||
| QCOM / QUALCOMM Incorporated | 0.05 | -0.91 | 8.63 | 2.73 | 4.8689 | -0.0928 | |||
| BAC / Bank of America Corporation | 0.17 | 0.64 | 7.82 | 14.13 | 4.4119 | 0.3646 | |||
| GS / The Goldman Sachs Group, Inc. | 0.01 | -7.52 | 7.43 | 19.82 | 4.1917 | 0.5291 | |||
| BA / The Boeing Company | 0.02 | -14.57 | 4.91 | 4.96 | 2.7715 | 0.0070 | |||
| AMZN / Amazon.com, Inc. | 0.02 | 0.00 | 3.73 | 15.31 | 2.1037 | 0.1936 | |||
| ADI / Analog Devices, Inc. | 0.01 | 0.88 | 3.40 | 19.07 | 1.9165 | 0.2313 | |||
| BR / Broadridge Financial Solutions, Inc. | 0.01 | 0.00 | 3.14 | 0.26 | 1.7684 | -0.0786 | |||
| HD / The Home Depot, Inc. | 0.01 | -3.98 | 3.10 | -3.94 | 1.7475 | -0.1569 | |||
| CSCO / Cisco Systems, Inc. | 0.04 | 0.00 | 2.85 | 12.42 | 1.6084 | 0.1107 | |||
| EBAY / eBay Inc. | 0.04 | -9.52 | 2.83 | -0.53 | 1.5960 | -0.0838 | |||
| WH / Wyndham Hotels & Resorts, Inc. | 0.03 | -0.30 | 2.70 | -10.55 | 1.5254 | -0.2597 | |||
| PYPL / PayPal Holdings, Inc. | 0.03 | 0.00 | 2.53 | 13.89 | 1.4295 | 0.1156 | |||
| KO / The Coca-Cola Company | 0.03 | 2.03 | 2.42 | 0.79 | 1.3660 | -0.0529 | |||
| WMT / Walmart Inc. | 0.02 | -8.55 | 2.41 | 1.86 | 1.3568 | -0.0377 | |||
| PFE / Pfizer Inc. | 0.08 | -31.65 | 1.86 | -34.63 | 1.0491 | -0.6307 | |||
| PM / Philip Morris International Inc. | 0.01 | 6.89 | 1.79 | 22.65 | 1.0084 | 0.1477 | |||
| TNL / Travel + Leisure Co. | 0.03 | -0.31 | 1.68 | 11.13 | 0.9461 | 0.0550 | |||
| ABT / Abbott Laboratories | 0.01 | 2.08 | 1.56 | 4.71 | 0.8771 | -0.0002 | |||
| C / Citigroup Inc. | 0.02 | 0.00 | 1.51 | 19.97 | 0.8507 | 0.1080 | |||
| FDX / FedEx Corporation | 0.01 | -63.08 | 1.45 | -65.59 | 0.8206 | -1.6748 | |||
| IBM / International Business Machines Corporation | 0.00 | 2.29 | 1.32 | 21.25 | 0.7437 | 0.1016 | |||
| MO / Altria Group, Inc. | 0.02 | 3.66 | 1.16 | 1.22 | 0.6559 | -0.0222 | |||
| OKE / ONEOK, Inc. | 0.01 | 0.00 | 1.14 | -17.79 | 0.6418 | -0.1749 | |||
| LIN / Linde plc | 0.00 | 0.00 | 0.75 | 0.67 | 0.4234 | -0.0165 | |||
| CVX / Chevron Corporation | 0.00 | 4.43 | 0.56 | -10.69 | 0.3163 | -0.0542 | |||
| COP / ConocoPhillips | 0.01 | 0.00 | 0.47 | -14.65 | 0.2632 | -0.0593 | |||
| LOW / Lowe's Companies, Inc. | 0.00 | 0.00 | 0.44 | -4.94 | 0.2503 | -0.0251 | |||
| CL / Colgate-Palmolive Company | 0.00 | 0.00 | 0.30 | -3.21 | 0.1708 | -0.0135 | |||
| AAPL / Apple Inc. | 0.00 | 16.47 | 0.29 | 7.81 | 0.1636 | 0.0044 | |||
| PG / The Procter & Gamble Company | 0.00 | 0.00 | 0.28 | -6.44 | 0.1560 | -0.0187 | |||
| VTRS / Viatris Inc. | 0.02 | -82.56 | 0.16 | -82.18 | 0.0878 | -0.4261 | |||
| CMCSA / Comcast Corporation | 0.00 | -100.00 | 0.00 | 0.0000 |