Mga Batayang Estadistika
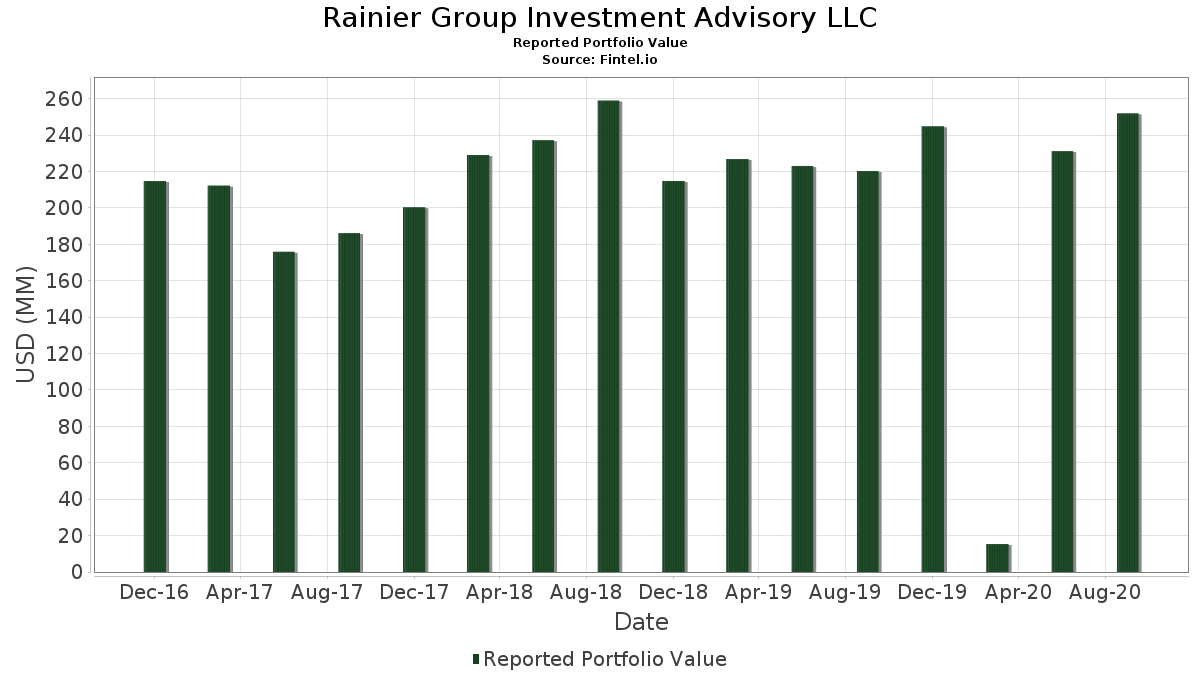
| Nilai Portofolio | $ 251,978,000 |
| Posisi Saat Ini | 72 |
Kepemilikan Terbaru, Kinerja, AUM (dari 13F, 13D)
Rainier Group Investment Advisory LLC telah mengungkapkan total kepemilikan 72 dalam pengajuan SEC terbaru mereka. Nilai portofolio terbaru dihitung sebesar $ 251,978,000 USD. Aset yang Dikelola (AUM) sebenarnya adalah nilai ini ditambah kas (yang tidak diungkapkan). Aset-aset utama Rainier Group Investment Advisory LLC adalah iShares Trust - iShares Core S&P 500 ETF (US:IVV) , iShares Trust - iShares 7-10 Year Treasury Bond ETF (US:IEF) , iShares Trust - iShares Russell Mid-Cap ETF (US:IWR) , iShares Trust - iShares Currency Hedged MSCI EAFE ETF (US:HEFA) , and Microsoft Corporation (US:MSFT) . Posisi baru Rainier Group Investment Advisory LLC meliputi: Mastercard Incorporated (US:MA) , Salesforce, Inc. (US:CRM) , .
Peningkatan Tertinggi Kuartal Ini
Kami menggunakan perubahan dalam alokasi portofolio karena ini adalah metrik yang paling bermakna. Perubahan dapat disebabkan oleh perdagangan atau perubahan harga saham.
| Keamanan | Saham (MM) |
Nilai (Juta Dolar AS) |
Portfolio % | ΔPorsyento ng Portfolio |
|---|---|---|---|---|
| 0.17 | 21.09 | 8.3706 | 8.3706 | |
| 0.04 | 4.58 | 1.8180 | 1.8180 | |
| 0.08 | 8.97 | 3.5598 | 0.7316 | |
| 0.00 | 1.73 | 0.6882 | 0.3145 | |
| 0.00 | 4.45 | 1.7656 | 0.3031 | |
| 0.00 | 0.51 | 0.2040 | 0.2040 | |
| 0.00 | 0.32 | 0.1254 | 0.1254 | |
| 0.01 | 0.29 | 0.1163 | 0.1163 | |
| 0.00 | 0.61 | 0.2409 | 0.1116 | |
| 0.00 | 0.27 | 0.1075 | 0.1075 |
Penurunan Tertinggi Kuartal Ini
Kami menggunakan perubahan dalam alokasi portofolio karena ini adalah metrik yang paling bermakna. Perubahan dapat disebabkan oleh perdagangan atau perubahan harga saham.
| Keamanan | Saham (MM) |
Nilai (Juta Dolar AS) |
Portfolio % | ΔPorsyento ng Portfolio |
|---|---|---|---|---|
| 0.39 | 129.54 | 51.4089 | -1.4624 | |
| 0.22 | 5.94 | 2.3558 | -0.7501 | |
| 0.60 | 16.55 | 6.5680 | -0.4930 | |
| 0.30 | 17.39 | 6.9030 | -0.4660 | |
| 0.00 | 0.00 | -0.0930 | ||
| 0.01 | 1.02 | 0.4036 | -0.0803 | |
| 0.02 | 0.66 | 0.2631 | -0.0712 | |
| 0.03 | 2.78 | 1.1049 | -0.0671 | |
| 0.01 | 0.23 | 0.0925 | -0.0541 | |
| 0.04 | 0.94 | 0.3746 | -0.0275 |
Pengajuan 13F dan Dana
Formulir ini diajukan pada 2020-11-16 untuk periode pelaporan 2020-09-30. Klik ikon tautan untuk melihat riwayat transaksi selengkapnya.
Tingkatkan ke versi premium untuk membuka data premium dan ekspor ke Excel. ![]() .
.
| Keamanan | Ketik | Harga Saham Rata-rata | Saham (MM) |
ΔSaham (%) |
ΔSaham (%) |
Nilai ($MM) |
Portpolyo (%) |
ΔPortofolio (%) |
|
|---|---|---|---|---|---|---|---|---|---|
| IVV / iShares Trust - iShares Core S&P 500 ETF | 0.39 | -2.36 | 129.54 | 5.95 | 51.4089 | -1.4624 | |||
| IEF / iShares Trust - iShares 7-10 Year Treasury Bond ETF | 0.17 | 3.41 | 21.09 | 3.37 | 8.3706 | 8.3706 | |||
| IWR / iShares Trust - iShares Russell Mid-Cap ETF | 0.30 | -4.65 | 17.39 | 2.08 | 6.9030 | -0.4660 | |||
| HEFA / iShares Trust - iShares Currency Hedged MSCI EAFE ETF | 0.60 | 1.56 | 16.55 | 1.36 | 6.5680 | -0.4930 | |||
| MSFT / Microsoft Corporation | 0.05 | 6.20 | 9.66 | 9.76 | 3.8329 | 0.0278 | |||
| AAPL / Apple Inc. | 0.08 | 332.04 | 8.97 | 37.16 | 3.5598 | 0.7316 | |||
| US83088V1026 / Slack Technologies Inc | 0.22 | -4.33 | 5.94 | -17.35 | 2.3558 | -0.7501 | |||
| VIEIX / Vanguard Index Funds - Vanguard Index Trust Extended Market Index Fund Institutional | 0.04 | 8.15 | 4.58 | 18.53 | 1.8180 | 1.8180 | |||
| AMZN / Amazon.com, Inc. | 0.00 | 15.25 | 4.45 | 31.55 | 1.7656 | 0.3031 | |||
| VYM / Vanguard Whitehall Funds - Vanguard High Dividend Yield ETF | 0.03 | 0.00 | 2.78 | 2.73 | 1.1049 | -0.0671 | |||
| COST / Costco Wholesale Corporation | 0.01 | -4.07 | 2.66 | 12.28 | 1.0556 | 0.0312 | |||
| TSLA / Tesla, Inc. | 0.00 | 405.25 | 1.73 | 100.69 | 0.6882 | 0.3145 | |||
| HD / The Home Depot, Inc. | 0.01 | 9.12 | 1.46 | 20.95 | 0.5774 | 0.0572 | |||
| IYC / iShares Trust - iShares U.S. Consumer Discretionary ETF | 0.01 | 0.00 | 1.38 | 14.11 | 0.5457 | 0.0246 | |||
| DVY / iShares Trust - iShares Select Dividend ETF | 0.01 | -10.03 | 1.02 | -9.12 | 0.4036 | -0.0803 | |||
| BRK.B / Berkshire Hathaway Inc. | 0.00 | 16.48 | 1.01 | 38.84 | 0.4000 | 0.0861 | |||
| SBUX / Starbucks Corporation | 0.01 | 2.11 | 0.95 | 19.25 | 0.3786 | 0.0326 | |||
| MDU / MDU Resources Group, Inc. | 0.04 | 0.04 | 0.94 | 1.51 | 0.3746 | -0.0275 | |||
| V / Visa Inc. | 0.00 | 19.36 | 0.80 | 23.41 | 0.3159 | 0.0370 | |||
| UNH / UnitedHealth Group Incorporated | 0.00 | 16.75 | 0.72 | 23.33 | 0.2853 | 0.0332 | |||
| CSCO / Cisco Systems, Inc. | 0.02 | 1.64 | 0.66 | -14.23 | 0.2631 | -0.0712 | |||
| NKE / NIKE, Inc. | 0.01 | 8.09 | 0.64 | 38.31 | 0.2536 | 0.0538 | |||
| GOOGL / Alphabet Inc. | 0.00 | 35.02 | 0.63 | 39.33 | 0.2488 | 0.0542 | |||
| VUG / Vanguard Index Funds - Vanguard Growth ETF | 0.00 | 22.56 | 0.62 | 38.00 | 0.2465 | 0.0518 | |||
| META / Meta Platforms, Inc. | 0.00 | 76.06 | 0.61 | 103.01 | 0.2409 | 0.1116 | |||
| DIS / The Walt Disney Company | 0.00 | -1.09 | 0.58 | 10.13 | 0.2286 | 0.0024 | |||
| AMGN / Amgen Inc. | 0.00 | 12.08 | 0.57 | 20.63 | 0.2274 | 0.0220 | |||
| JNJ / Johnson & Johnson | 0.00 | 36.25 | 0.56 | 44.25 | 0.2238 | 0.0547 | |||
| JPM / JPMorgan Chase & Co. | 0.01 | 24.02 | 0.53 | 26.84 | 0.2119 | 0.0299 | |||
| PCAR / PACCAR Inc | 0.01 | 6.47 | 0.53 | 21.14 | 0.2115 | 0.0212 | |||
| NVDA / NVIDIA Corporation | 0.00 | 33.10 | 0.51 | 89.67 | 0.2040 | 0.2040 | |||
| ADBE / Adobe Inc. | 0.00 | 21.68 | 0.51 | 37.27 | 0.2032 | 0.0419 | |||
| KO / The Coca-Cola Company | 0.01 | 24.14 | 0.50 | 37.06 | 0.1996 | 0.0409 | |||
| GOOG / Alphabet Inc. | 0.00 | 52.94 | 0.46 | 59.38 | 0.1822 | 0.0576 | |||
| PG / The Procter & Gamble Company | 0.00 | 48.52 | 0.43 | 72.51 | 0.1718 | 0.0633 | |||
| SPY / SPDR S&P 500 ETF | 0.00 | 0.00 | 0.42 | 8.55 | 0.1663 | -0.0006 | |||
| VZ / Verizon Communications Inc. | 0.01 | 27.84 | 0.41 | 37.87 | 0.1647 | 0.0345 | |||
| MRK / Merck & Co., Inc. | 0.00 | 26.76 | 0.40 | 36.05 | 0.1587 | 0.0316 | |||
| MCD / McDonald's Corporation | 0.00 | 27.58 | 0.39 | 51.57 | 0.1528 | 0.0429 | |||
| T / AT&T Inc. | 0.01 | 20.48 | 0.38 | 13.51 | 0.1500 | 0.0060 | |||
| WMT / Walmart Inc. | 0.00 | 20.47 | 0.37 | 40.75 | 0.1480 | 0.0334 | |||
| LOW / Lowe's Companies, Inc. | 0.00 | 19.58 | 0.34 | 46.81 | 0.1369 | 0.0353 | |||
| CMCSA / Comcast Corporation | 0.01 | 35.73 | 0.33 | 61.08 | 0.1298 | 0.0420 | |||
| ABT / Abbott Laboratories | 0.00 | 0.32 | 0.1254 | 0.1254 | |||||
| PM / Philip Morris International Inc. | 0.00 | 19.25 | 0.31 | 27.98 | 0.1234 | 0.0183 | |||
| ACN / Accenture plc | 0.00 | 26.21 | 0.29 | 32.88 | 0.1171 | 0.0211 | |||
| PFE / Pfizer Inc. | 0.01 | 0.29 | 0.1163 | 0.1163 | |||||
| ABBV / AbbVie Inc. | 0.00 | 16.56 | 0.29 | 4.29 | 0.1159 | -0.0052 | |||
| HDV / iShares Trust - iShares Core High Dividend ETF | 0.00 | 0.00 | 0.29 | -0.69 | 0.1143 | -0.0111 | |||
| BA / The Boeing Company | 0.00 | -0.35 | 0.28 | -10.26 | 0.1111 | -0.0238 | |||
| ALL / The Allstate Corporation | 0.00 | -0.17 | 0.27 | -2.87 | 0.1075 | -0.0131 | |||
| MA / Mastercard Incorporated | 0.00 | 0.27 | 0.1075 | 0.1075 | |||||
| AMT / American Tower Corporation | 0.00 | 13.84 | 0.26 | 6.45 | 0.1048 | -0.0025 | |||
| INTC / Intel Corporation | 0.01 | 6.40 | 0.26 | -8.01 | 0.1048 | -0.0193 | |||
| LMT / Lockheed Martin Corporation | 0.00 | 14.14 | 0.26 | 19.82 | 0.1032 | 0.0093 | |||
| MMM / 3M Company | 0.00 | 16.92 | 0.25 | 19.90 | 0.0980 | 0.0089 | |||
| APD / Air Products and Chemicals, Inc. | 0.00 | 0.24 | 0.0968 | 0.0968 | |||||
| NEE / NextEra Energy, Inc. | 0.00 | 0.24 | 0.0956 | 0.0956 | |||||
| BOTZ / Global X Funds - Global X Robotics & Artificial Intelligence ETF | 0.01 | 0.00 | 0.24 | 16.83 | 0.0937 | 0.0063 | |||
| XOM / Exxon Mobil Corporation | 0.01 | -10.40 | 0.23 | -31.27 | 0.0925 | -0.0541 | |||
| TXN / Texas Instruments Incorporated | 0.00 | 0.23 | 0.0925 | 0.0925 | |||||
| BRMK / Broadmark Realty Capital Inc | 0.02 | 1.90 | 0.23 | 5.99 | 0.0913 | -0.0026 | |||
| MO / Altria Group, Inc. | 0.01 | 0.23 | 0.0893 | 0.0893 | |||||
| PEP / PepsiCo, Inc. | 0.00 | 0.22 | 0.0861 | 0.0861 | |||||
| PYPL / PayPal Holdings, Inc. | 0.00 | 0.21 | 0.0849 | 0.0849 | |||||
| MDLZ / Mondelez International, Inc. | 0.00 | 0.21 | 0.0841 | 0.0841 | |||||
| WM / Waste Management, Inc. | 0.00 | 0.21 | 0.0829 | 0.0829 | |||||
| CRM / Salesforce, Inc. | 0.00 | 0.21 | 0.0822 | 0.0822 | |||||
| SYY / Sysco Corporation | 0.00 | 0.20 | 0.0802 | 0.0802 | |||||
| BAC / Bank of America Corporation | 0.01 | 0.20 | 0.0798 | 0.0798 | |||||
| CL / Colgate-Palmolive Company | 0.00 | 0.20 | 0.0794 | 0.0794 | |||||
| SNDL / SNDL Inc. | 0.03 | 0.00 | 0.01 | -70.83 | 0.0028 | -0.0076 | |||
| RTX / RTX Corporation | 0.00 | -100.00 | 0.00 | 0.0000 | 0.0000 | ||||
| VLO / Valero Energy Corporation | 0.00 | -100.00 | 0.00 | -100.00 | -0.0930 |