Mga Batayang Estadistika
| Nilai Portofolio | $ 236,504,000 |
| Posisi Saat Ini | 75 |
Kepemilikan Terbaru, Kinerja, AUM (dari 13F, 13D)
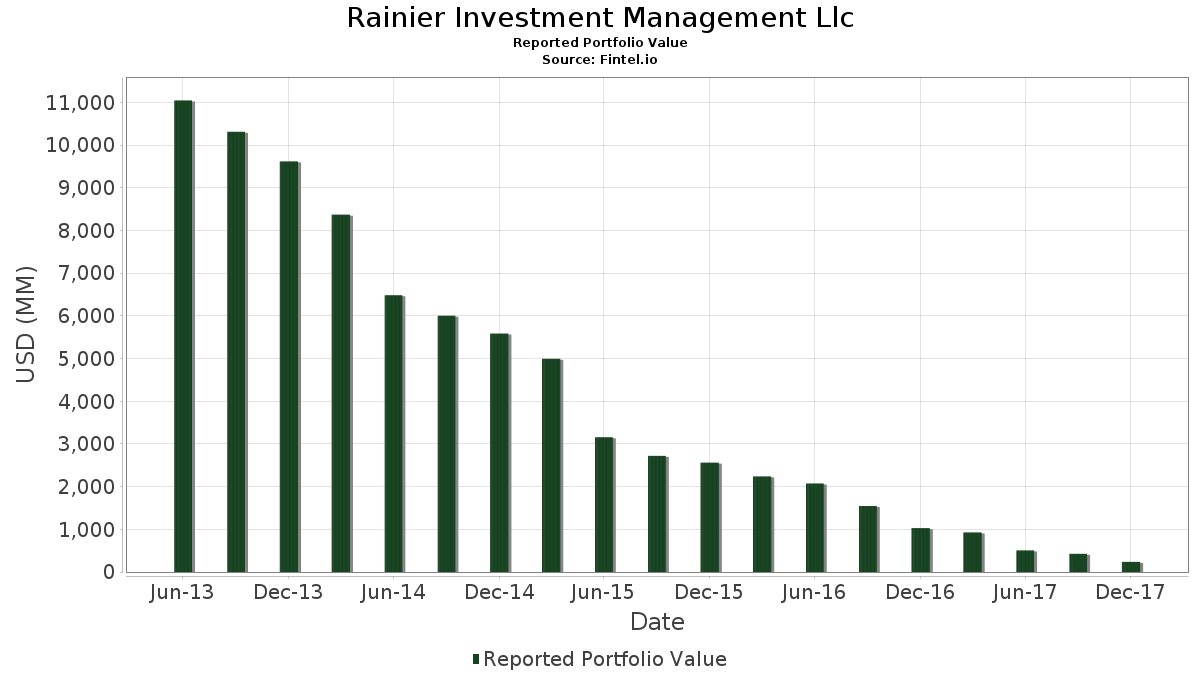
Rainier Investment Management Llc telah mengungkapkan total kepemilikan 75 dalam pengajuan SEC terbaru mereka. Nilai portofolio terbaru dihitung sebesar $ 236,504,000 USD. Aset yang Dikelola (AUM) sebenarnya adalah nilai ini ditambah kas (yang tidak diungkapkan). Aset-aset utama Rainier Investment Management Llc adalah Teleflex Incorporated (US:TFX) , Evercore Inc. (US:EVR) , A. O. Smith Corporation (US:AOS) , Mercury Systems, Inc. (US:MRCY) , and Oshkosh Corporation (US:OSK) .
Peningkatan Tertinggi Kuartal Ini
Kami menggunakan perubahan dalam alokasi portofolio karena ini adalah metrik yang paling bermakna. Perubahan dapat disebabkan oleh perdagangan atau perubahan harga saham.
| Keamanan | Saham (MM) |
Nilai (Juta Dolar AS) |
Portfolio % | ΔPorsyento ng Portfolio |
|---|---|---|---|---|
| 0.10 | 5.31 | 2.2448 | 2.2448 | |
| 0.06 | 5.21 | 2.2025 | 2.2025 | |
| 0.09 | 5.20 | 2.1974 | 2.1974 | |
| 0.10 | 5.04 | 2.1289 | 2.1289 | |
| 0.10 | 4.45 | 1.8795 | 1.8795 | |
| 0.07 | 4.36 | 1.8427 | 1.8427 | |
| 0.09 | 4.36 | 1.8423 | 1.8423 | |
| 0.06 | 4.08 | 1.7239 | 1.7239 | |
| 0.18 | 3.85 | 1.6258 | 1.6258 | |
| 0.07 | 3.62 | 1.5311 | 1.5311 |
Penurunan Tertinggi Kuartal Ini
Kami menggunakan perubahan dalam alokasi portofolio karena ini adalah metrik yang paling bermakna. Perubahan dapat disebabkan oleh perdagangan atau perubahan harga saham.
| Keamanan | Saham (MM) |
Nilai (Juta Dolar AS) |
Portfolio % | ΔPorsyento ng Portfolio |
|---|---|---|---|---|
| 0.00 | 0.00 | -0.9057 | ||
| 0.00 | 0.00 | -0.8284 | ||
| 0.00 | 0.00 | -0.7966 | ||
| 0.00 | 0.00 | -0.7926 | ||
| 0.00 | 0.00 | -0.6553 | ||
| 0.00 | 0.00 | -0.6385 | ||
| 0.00 | 0.00 | -0.6341 | ||
| 0.00 | 0.00 | -0.6100 | ||
| 0.00 | 0.00 | -0.6068 | ||
| 0.00 | 0.00 | -0.5717 |
Pengajuan 13F dan Dana
Formulir ini diajukan pada 2018-02-02 untuk periode pelaporan 2017-12-31. Klik ikon tautan untuk melihat riwayat transaksi selengkapnya.
Tingkatkan ke versi premium untuk membuka data premium dan ekspor ke Excel. ![]() .
.
| Keamanan | Ketik | Harga Saham Rata-rata | Saham (MM) |
ΔSaham (%) |
ΔSaham (%) |
Nilai ($MM) |
Portpolyo (%) |
ΔPortofolio (%) |
|
|---|---|---|---|---|---|---|---|---|---|
| TFX / Teleflex Incorporated | 0.02 | -23.22 | 6.00 | -21.05 | 2.5357 | 0.7465 | |||
| EVR / Evercore Inc. | 0.07 | -3.17 | 5.94 | 8.60 | 2.5099 | 1.2224 | |||
| AOS / A. O. Smith Corporation | 0.09 | -28.79 | 5.70 | -26.56 | 2.4093 | 0.5817 | |||
| MRCY / Mercury Systems, Inc. | 0.10 | -3.17 | 5.31 | -4.15 | 2.2448 | 2.2448 | |||
| OSK / Oshkosh Corporation | 0.06 | -34.35 | 5.21 | -27.71 | 2.2025 | 2.2025 | |||
| WAL / Western Alliance Bancorporation | 0.09 | -27.99 | 5.20 | -23.18 | 2.1974 | 2.1974 | |||
| RNG / RingCentral, Inc. | 0.10 | -26.66 | 5.04 | -14.98 | 2.1289 | 2.1289 | |||
| TSS / Total System Services, Inc. | 0.06 | -41.36 | 4.50 | -29.19 | 1.9044 | 0.4061 | |||
| EQIX / Equinix, Inc. | 0.01 | -27.20 | 4.46 | -26.07 | 1.8875 | 0.4653 | |||
| FIX / Comfort Systems USA, Inc. | 0.10 | -3.17 | 4.45 | 18.41 | 1.8795 | 1.8795 | |||
| MHK / Mohawk Industries, Inc. | 0.02 | -41.01 | 4.40 | -34.23 | 1.8596 | 0.2845 | |||
| PF / Pinnacle Foods, Inc. | 0.07 | -26.61 | 4.36 | -23.66 | 1.8427 | 1.8427 | |||
| TTEK / Tetra Tech, Inc. | 0.09 | -20.58 | 4.36 | -17.84 | 1.8423 | 1.8423 | |||
| RJF / Raymond James Financial, Inc. | 0.05 | -43.83 | 4.10 | -40.53 | 1.7344 | 0.1097 | |||
| ASGN / ASGN Incorporated | 0.06 | -3.16 | 4.08 | 15.92 | 1.7239 | 1.7239 | |||
| PWR / Quanta Services, Inc. | 0.10 | -40.64 | 4.01 | -37.87 | 1.6960 | 0.1753 | |||
| PGR / The Progressive Corporation | 0.07 | -37.69 | 4.00 | -27.51 | 1.6921 | 0.3917 | |||
| THO / THOR Industries, Inc. | 0.03 | -24.94 | 3.94 | -10.16 | 1.6647 | 0.6325 | |||
| MRVL / Marvell Technology, Inc. | 0.18 | -28.03 | 3.85 | -13.69 | 1.6258 | 1.6258 | |||
| US2692464017 / E*TRADE Financial, Inc. | 0.08 | -25.77 | 3.83 | -15.63 | 1.6182 | 0.5497 | |||
| AWK / American Water Works Company, Inc. | 0.04 | -36.44 | 3.72 | -28.12 | 1.5733 | 0.3539 | |||
| OZRK / Bank of the Ozarks, Inc. | 0.07 | -24.91 | 3.62 | -24.28 | 1.5311 | 1.5311 | |||
| FTNT / Fortinet, Inc. | 0.08 | -29.05 | 3.52 | -13.49 | 1.4888 | 0.5301 | |||
| NCLH / Norwegian Cruise Line Holdings Ltd. | 0.07 | -25.89 | 3.51 | -26.99 | 1.4845 | 0.3518 | |||
| MIDD / The Middleby Corporation | 0.03 | -27.58 | 3.42 | -23.73 | 1.4444 | 1.4444 | |||
| MTDR / Matador Resources Company | 0.11 | -3.16 | 3.39 | 11.05 | 1.4325 | 0.7139 | |||
| AXTA / Axalta Coating Systems Ltd. | 0.10 | -39.45 | 3.36 | -32.23 | 1.4198 | 1.4198 | |||
| EXP / Eagle Materials Inc. | 0.03 | -33.31 | 3.35 | -29.19 | 1.4165 | 0.3021 | |||
| EWBC / East West Bancorp, Inc. | 0.05 | -22.58 | 3.34 | -21.24 | 1.4127 | 0.4135 | |||
| FRC / First Republic Bank | 0.04 | -25.78 | 3.33 | -38.43 | 1.4101 | 0.1342 | |||
| FANG / Diamondback Energy, Inc. | 0.03 | -22.84 | 3.30 | -0.57 | 1.3936 | 0.6128 | |||
| CSGP / CoStar Group, Inc. | 0.01 | -31.56 | 3.28 | -24.24 | 1.3886 | 0.3675 | |||
| VMC / Vulcan Materials Company | 0.03 | -45.55 | 3.26 | -41.56 | 1.3801 | 0.0646 | |||
| MNR / Mach Natural Resources LP | 0.18 | -3.16 | 3.21 | 6.47 | 1.3577 | 1.3577 | |||
| NTUS / Natus Medical Inc | 0.08 | 25.74 | 3.18 | 28.05 | 1.3433 | 1.3433 | |||
| LRCX / Lam Research Corporation | 0.02 | -22.05 | 3.12 | -22.46 | 1.3209 | 0.3719 | |||
| LII / Lennox International Inc. | 0.01 | -24.42 | 3.12 | -12.06 | 1.3192 | 1.3192 | |||
| PNFP / Pinnacle Financial Partners, Inc. | 0.05 | -3.16 | 2.99 | -4.11 | 1.2630 | 0.5293 | |||
| JBLU / JetBlue Airways Corporation | 0.13 | -24.54 | 2.97 | -9.04 | 1.2554 | 1.2554 | |||
| NFX / Newfield Exploration Company | 0.09 | -35.19 | 2.96 | -31.12 | 1.2503 | 0.2391 | |||
| NSA / National Storage Affiliates Trust | 0.11 | -3.15 | 2.96 | 8.92 | 1.2499 | 1.2499 | |||
| LYV / Live Nation Entertainment, Inc. | 0.07 | -27.80 | 2.89 | -29.41 | 1.2211 | 0.2575 | |||
| SWKS / Skyworks Solutions, Inc. | 0.03 | -22.34 | 2.86 | -27.65 | 1.2084 | 0.2781 | |||
| BURL / Burlington Stores, Inc. | 0.02 | -23.98 | 2.84 | -2.03 | 1.2021 | 0.5186 | |||
| PAYC / Paycom Software, Inc. | 0.04 | -21.06 | 2.82 | -15.42 | 1.1941 | 1.1941 | |||
| NUVA / Nuvasive Inc | 0.05 | -39.70 | 2.81 | -36.38 | 1.1903 | 1.1903 | |||
| FLT / Corpay, Inc. | 0.01 | -48.38 | 2.76 | -35.80 | 1.1653 | 0.1541 | |||
| COUP / Coupa Software Inc | 0.08 | -3.15 | 2.64 | -2.94 | 1.1154 | 1.1154 | |||
| HUBS / HubSpot, Inc. | 0.03 | -27.98 | 2.62 | -24.26 | 1.1074 | 1.1074 | |||
| HPP / Hudson Pacific Properties, Inc. | 0.08 | -28.03 | 2.60 | -26.48 | 1.0989 | 0.2663 | |||
| MDU / MDU Resources Group, Inc. | 0.10 | -20.86 | 2.57 | -18.02 | 1.0850 | 1.0850 | |||
| ROIC / Retail Opportunity Investments Corp. | 0.13 | -3.15 | 2.55 | 1.63 | 1.0799 | 1.0799 | |||
| DOC / Healthpeak Properties, Inc. | 0.14 | -3.15 | 2.54 | -1.71 | 1.0723 | 1.0723 | |||
| ON / ON Semiconductor Corporation | 0.12 | -23.12 | 2.51 | -12.83 | 1.0630 | 0.3837 | |||
| SBNY / Signature Bank | 0.02 | -23.41 | 2.44 | -17.91 | 1.0313 | 0.3315 | |||
| EEFT / Euronet Worldwide, Inc. | 0.03 | -29.04 | 2.43 | -36.92 | 1.0275 | 0.1202 | |||
| PANW / Palo Alto Networks, Inc. | 0.02 | -19.94 | 2.42 | -19.49 | 1.0232 | 0.3152 | |||
| OSIS / OSI Systems, Inc. | 0.04 | -3.15 | 2.29 | -31.76 | 0.9695 | 0.9695 | |||
| PODD / Insulet Corporation | 0.03 | -63.42 | 2.25 | -54.18 | 0.9514 | -0.2051 | |||
| US69354M1080 / PRA Health Sciences Inc | 0.02 | -23.21 | 2.16 | -8.16 | 0.9133 | 0.9133 | |||
| TYL / Tyler Technologies, Inc. | 0.01 | -23.88 | 2.13 | -22.67 | 0.8998 | 0.2516 | |||
| BC / Brunswick Corporation | 0.04 | -23.86 | 2.07 | -24.87 | 0.8761 | 0.2265 | |||
| ULTA / Ulta Beauty, Inc. | 0.01 | -23.75 | 2.01 | -24.54 | 0.8503 | 0.2226 | |||
| PRGO / Perrigo Company plc | 0.02 | -52.44 | 2.00 | -51.03 | 0.8469 | -0.1164 | |||
| PFPT / Proofpoint Inc | 0.02 | -3.13 | 1.95 | -1.37 | 0.8241 | 0.8241 | |||
| LITE / Lumentum Holdings Inc. | 0.04 | -3.12 | 1.94 | -12.84 | 0.8207 | 0.8207 | |||
| AMED / Amedisys, Inc. | 0.04 | -3.11 | 1.90 | -8.77 | 0.8046 | 0.8046 | |||
| IT / Gartner, Inc. | 0.02 | -25.38 | 1.89 | -26.14 | 0.7991 | 0.1964 | |||
| OLLI / Ollie's Bargain Outlet Holdings, Inc. | 0.04 | -3.10 | 1.88 | 11.18 | 0.7945 | 0.7945 | |||
| APOG / Apogee Enterprises, Inc. | 0.04 | -3.13 | 1.80 | -8.17 | 0.7607 | 0.2992 | |||
| KTWO / K2M Group Holdings, Inc. | 0.09 | -3.10 | 1.67 | -17.76 | 0.7049 | 0.7049 | |||
| PRTK / Paratek Pharmaceuticals Inc. | 0.08 | -3.08 | 1.37 | -30.89 | 0.5788 | 0.5788 | |||
| IONS / Ionis Pharmaceuticals, Inc. | 0.02 | -63.67 | 1.16 | -63.96 | 0.4901 | -0.2674 | |||
| CDNS / Cadence Design Systems, Inc. | 0.03 | -62.45 | 1.16 | -60.20 | 0.4884 | -0.1952 | |||
| GVA / Granite Construction Incorporated | 0.02 | -54.28 | 0.96 | -49.97 | 0.4068 | 0.4068 | |||
| CRM / Salesforce, Inc. | 0.00 | -100.00 | 0.00 | -100.00 | -0.2447 | ||||
| ORLY / O'Reilly Automotive, Inc. | 0.00 | -100.00 | 0.00 | -100.00 | -0.3100 | ||||
| EXPE / Expedia Group, Inc. | 0.00 | -100.00 | 0.00 | -100.00 | -0.0862 | ||||
| AMT / American Tower Corporation | 0.00 | -100.00 | 0.00 | -100.00 | -0.4918 | ||||
| CME / CME Group Inc. | 0.00 | -100.00 | 0.00 | -100.00 | -0.2657 | ||||
| BRX / Brixmor Property Group Inc. | 0.00 | -100.00 | 0.00 | -100.00 | 0.0000 | ||||
| PZZA / Papa John's International, Inc. | 0.00 | -100.00 | 0.00 | -100.00 | 0.0000 | ||||
| XRAY / DENTSPLY SIRONA Inc. | 0.00 | -100.00 | 0.00 | -100.00 | 0.0000 | ||||
| ADBE / Adobe Inc. | 0.00 | -100.00 | 0.00 | -100.00 | 0.0000 | ||||
| PLD / Prologis, Inc. | 0.00 | -100.00 | 0.00 | -100.00 | -0.2657 | ||||
| US0153511094 / Alexion Pharmaceuticals, Inc. | 0.00 | -100.00 | 0.00 | -100.00 | -0.3175 | ||||
| SBUX / Starbucks Corporation | 0.00 | -100.00 | 0.00 | -100.00 | -0.3354 | ||||
| NWL / Newell Brands Inc. | 0.00 | -100.00 | 0.00 | -100.00 | 0.0000 | ||||
| WCN / Waste Connections, Inc. | 0.00 | -100.00 | 0.00 | -100.00 | 0.0000 | ||||
| HOLX / Hologic, Inc. | 0.00 | -100.00 | 0.00 | -100.00 | 0.0000 | ||||
| EIX / Edison International | 0.00 | -100.00 | 0.00 | -100.00 | 0.0000 | ||||
| US20605P1012 / Concho Resources, Inc. | 0.00 | -100.00 | 0.00 | -100.00 | -0.3736 | ||||
| KEY / KeyCorp | 0.00 | -100.00 | 0.00 | -100.00 | -0.2902 | ||||
| CELG / Celgene Corp. | 0.00 | -100.00 | 0.00 | -100.00 | -0.3455 | ||||
| DOOR / Masonite International Corporation | 0.00 | -100.00 | 0.00 | -100.00 | 0.0000 | ||||
| SMIN / iShares Trust - iShares MSCI India Small-Cap ETF | 0.00 | -100.00 | 0.00 | -100.00 | 0.0000 | ||||
| ESLT / Elbit Systems Ltd. | 0.00 | -100.00 | 0.00 | -100.00 | 0.0000 | ||||
| DVN / Devon Energy Corporation | 0.00 | -100.00 | 0.00 | -100.00 | -0.2120 | ||||
| V / Visa Inc. | 0.00 | -100.00 | 0.00 | -100.00 | -0.5717 | ||||
| GS / The Goldman Sachs Group, Inc. | 0.00 | -100.00 | 0.00 | -100.00 | -0.5465 | ||||
| C.WSA / Citigroup, Inc. | 0.00 | -100.00 | 0.00 | -100.00 | -0.5622 | ||||
| SHW / The Sherwin-Williams Company | 0.00 | -100.00 | 0.00 | -100.00 | -0.6553 | ||||
| RTN / Raytheon Co. | 0.00 | -100.00 | 0.00 | -100.00 | -0.4664 | ||||
| UNP / Union Pacific Corporation | 0.00 | -100.00 | 0.00 | -100.00 | -0.4193 | ||||
| STZ / Constellation Brands, Inc. | 0.00 | -100.00 | 0.00 | -100.00 | -0.5448 | ||||
| CHD / Church & Dwight Co., Inc. | 0.00 | -100.00 | 0.00 | -100.00 | -0.2044 | ||||
| AME / AMETEK, Inc. | 0.00 | -100.00 | 0.00 | -100.00 | -0.2730 | ||||
| ULTI / Ultimate Software Group, Inc. (The) | 0.00 | -100.00 | 0.00 | -100.00 | -0.1625 | ||||
| AMZN / Amazon.com, Inc. | 0.00 | -100.00 | 0.00 | -100.00 | -0.6068 | ||||
| COST / Costco Wholesale Corporation | 0.00 | -100.00 | 0.00 | -100.00 | -0.3001 | ||||
| SHPG / Shire Plc. | 0.00 | -100.00 | 0.00 | -100.00 | -0.3976 | ||||
| DAL / Delta Air Lines, Inc. | 0.00 | -100.00 | 0.00 | -100.00 | -0.2320 | ||||
| EOG / EOG Resources, Inc. | 0.00 | -100.00 | 0.00 | -100.00 | -0.2087 | ||||
| SLB / Schlumberger Limited | 0.00 | -100.00 | 0.00 | -100.00 | -0.2942 | ||||
| ICE / Intercontinental Exchange, Inc. | 0.00 | -100.00 | 0.00 | -100.00 | -0.5505 | ||||
| JPM / JPMorgan Chase & Co. | 0.00 | -100.00 | 0.00 | -100.00 | -0.7966 | ||||
| INTC / Intel Corporation | 0.00 | -100.00 | 0.00 | -100.00 | -0.4169 | ||||
| CLR / Continental Resources Inc (OKLA) | 0.00 | -100.00 | 0.00 | -100.00 | -0.2438 | ||||
| BSX / Boston Scientific Corporation | 0.00 | -100.00 | 0.00 | -100.00 | -0.2384 | ||||
| COO / The Cooper Companies, Inc. | 0.00 | -100.00 | 0.00 | -100.00 | -0.3608 | ||||
| HD / The Home Depot, Inc. | 0.00 | -100.00 | 0.00 | -100.00 | -0.4935 | ||||
| REGN / Regeneron Pharmaceuticals, Inc. | 0.00 | -100.00 | 0.00 | -100.00 | -0.3896 | ||||
| SRCL / Stericycle, Inc. | 0.00 | -100.00 | 0.00 | -100.00 | -0.1849 | ||||
| US0325111070 / Anadarko Petroleum Corp. | 0.00 | -100.00 | 0.00 | -100.00 | -0.1566 | ||||
| XEC / Cimarex Energy Co. | 0.00 | -100.00 | 0.00 | -100.00 | -0.1552 | ||||
| AAPL / Apple Inc. | 0.00 | -100.00 | 0.00 | -100.00 | -0.8284 | ||||
| CTAS / Cintas Corporation | 0.00 | -100.00 | 0.00 | -100.00 | -0.6385 | ||||
| FTV / Fortive Corporation | 0.00 | -100.00 | 0.00 | -100.00 | -0.6341 | ||||
| GOOGL / Alphabet Inc. | 0.00 | -100.00 | 0.00 | -100.00 | -0.7926 | ||||
| CMCSA / Comcast Corporation | 0.00 | -100.00 | 0.00 | -100.00 | -0.2372 | ||||
| MA / Mastercard Incorporated | 0.00 | -100.00 | 0.00 | -100.00 | -0.3809 | ||||
| IR / Ingersoll Rand Inc. | 0.00 | -100.00 | 0.00 | -100.00 | -0.1811 | ||||
| MSFT / Microsoft Corporation | 0.00 | -100.00 | 0.00 | -100.00 | -0.9057 | ||||
| META / Meta Platforms, Inc. | 0.00 | -100.00 | 0.00 | -100.00 | -0.5695 | ||||
| UNH / UnitedHealth Group Incorporated | 0.00 | -100.00 | 0.00 | -100.00 | 0.0000 | ||||
| NOC / Northrop Grumman Corporation | 0.00 | -100.00 | 0.00 | -100.00 | 0.0000 | ||||
| MNST / Monster Beverage Corporation | 0.00 | -100.00 | 0.00 | -100.00 | -0.2249 | ||||
| SPB / Spectrum Brands Holdings, Inc. | 0.00 | -100.00 | 0.00 | -100.00 | 0.0000 | ||||
| SIG / Signet Jewelers Limited | 0.00 | -100.00 | 0.00 | -100.00 | -0.6100 |