Mga Batayang Estadistika
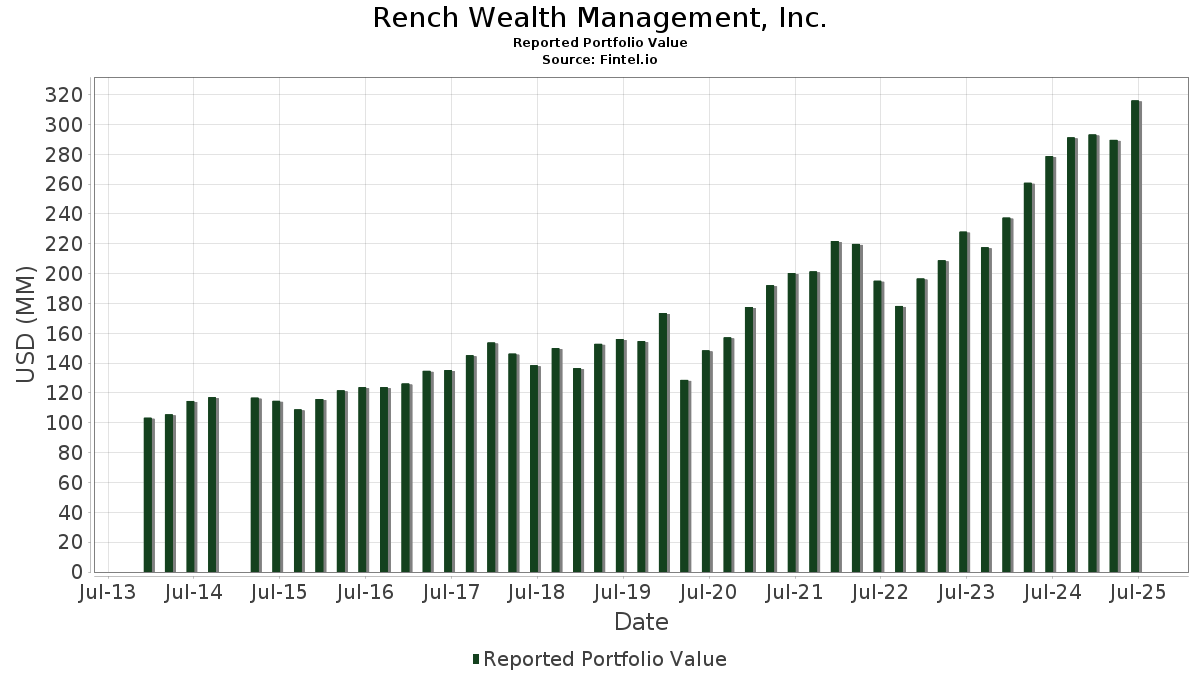
| Nilai Portofolio | $ 316,018,601 |
| Posisi Saat Ini | 52 |
Kepemilikan Terbaru, Kinerja, AUM (dari 13F, 13D)
Rench Wealth Management, Inc. telah mengungkapkan total kepemilikan 52 dalam pengajuan SEC terbaru mereka. Nilai portofolio terbaru dihitung sebesar $ 316,018,601 USD. Aset yang Dikelola (AUM) sebenarnya adalah nilai ini ditambah kas (yang tidak diungkapkan). Aset-aset utama Rench Wealth Management, Inc. adalah NVIDIA Corporation (US:NVDA) , Microsoft Corporation (US:MSFT) , Apple Inc. (US:AAPL) , Arthur J. Gallagher & Co. (US:AJG) , and JPMorgan Chase & Co. (US:JPM) . Posisi baru Rench Wealth Management, Inc. meliputi: Broadcom Inc. (US:AVGO) , General Electric Company (US:GE) , .
Peningkatan Tertinggi Kuartal Ini
Kami menggunakan perubahan dalam alokasi portofolio karena ini adalah metrik yang paling bermakna. Perubahan dapat disebabkan oleh perdagangan atau perubahan harga saham.
| Keamanan | Saham (MM) |
Nilai (Juta Dolar AS) |
Portfolio % | ΔPorsyento ng Portfolio |
|---|---|---|---|---|
| 0.21 | 33.84 | 10.7082 | 2.5829 | |
| 0.05 | 24.34 | 7.7010 | 1.3244 | |
| 0.09 | 6.30 | 1.9951 | 0.6058 | |
| 0.08 | 8.08 | 2.5570 | 0.4823 | |
| 0.01 | 6.46 | 2.0429 | 0.4146 | |
| 0.05 | 14.59 | 4.6175 | 0.3508 | |
| 0.03 | 6.11 | 1.9320 | 0.2718 | |
| 0.05 | 11.66 | 3.6905 | 0.2411 | |
| 0.03 | 7.27 | 2.3011 | 0.2101 | |
| 0.06 | 10.21 | 3.2311 | 0.2013 |
Penurunan Tertinggi Kuartal Ini
Kami menggunakan perubahan dalam alokasi portofolio karena ini adalah metrik yang paling bermakna. Perubahan dapat disebabkan oleh perdagangan atau perubahan harga saham.
| Keamanan | Saham (MM) |
Nilai (Juta Dolar AS) |
Portfolio % | ΔPorsyento ng Portfolio |
|---|---|---|---|---|
| 0.09 | 19.06 | 6.0322 | -1.0568 | |
| 0.05 | 15.84 | 5.0117 | -0.8482 | |
| 0.01 | 3.96 | 1.2526 | -0.7883 | |
| 0.06 | 8.62 | 2.7278 | -0.4808 | |
| 0.06 | 8.86 | 2.8048 | -0.4506 | |
| 0.06 | 8.04 | 2.5434 | -0.4048 | |
| 0.03 | 4.68 | 1.4809 | -0.3482 | |
| 0.05 | 5.45 | 1.7235 | -0.3091 | |
| 0.00 | 0.88 | 0.2789 | -0.3086 | |
| 0.07 | 6.20 | 1.9616 | -0.2467 |
Pengajuan 13F dan Dana
Formulir ini diajukan pada 2025-08-13 untuk periode pelaporan 2025-06-30. Klik ikon tautan untuk melihat riwayat transaksi selengkapnya.
Tingkatkan ke versi premium untuk membuka data premium dan ekspor ke Excel. ![]() .
.
| Keamanan | Ketik | Harga Saham Rata-rata | Saham (MM) |
ΔSaham (%) |
ΔSaham (%) |
Nilai ($MM) |
Portpolyo (%) |
ΔPortofolio (%) |
|
|---|---|---|---|---|---|---|---|---|---|
| NVDA / NVIDIA Corporation | 0.21 | -1.36 | 33.84 | 43.79 | 10.7082 | 2.5829 | |||
| MSFT / Microsoft Corporation | 0.05 | -0.55 | 24.34 | 31.77 | 7.7010 | 1.3244 | |||
| AAPL / Apple Inc. | 0.09 | 0.52 | 19.06 | -7.16 | 6.0322 | -1.0568 | |||
| AJG / Arthur J. Gallagher & Co. | 0.05 | 0.64 | 15.84 | -6.68 | 5.0117 | -0.8482 | |||
| JPM / JPMorgan Chase & Co. | 0.05 | -0.09 | 14.59 | 18.09 | 4.6175 | 0.3508 | |||
| AMZN / Amazon.com, Inc. | 0.05 | 1.24 | 11.66 | 16.74 | 3.6905 | 0.2411 | |||
| GOOG / Alphabet Inc. | 0.06 | 2.48 | 10.21 | 16.37 | 3.2311 | 0.2013 | |||
| ABT / Abbott Laboratories | 0.07 | -1.38 | 9.18 | 1.11 | 2.9042 | -0.2296 | |||
| PG / The Procter & Gamble Company | 0.06 | 0.56 | 8.86 | -5.99 | 2.8048 | -0.4506 | |||
| JNJ / Johnson & Johnson | 0.06 | 0.71 | 8.62 | -7.24 | 2.7278 | -0.4808 | |||
| ISRG / Intuitive Surgical, Inc. | 0.01 | 1.29 | 8.13 | 11.14 | 2.5738 | 0.0469 | |||
| LRCX / Lam Research Corporation | 0.08 | 0.44 | 8.08 | 34.49 | 2.5570 | 0.4823 | |||
| PAYX / Paychex, Inc. | 0.06 | -0.16 | 8.04 | -5.87 | 2.5434 | -0.4048 | |||
| COST / Costco Wholesale Corporation | 0.01 | 1.77 | 7.57 | 6.53 | 2.3968 | -0.0581 | |||
| LHX / L3Harris Technologies, Inc. | 0.03 | 0.19 | 7.27 | 20.06 | 2.3011 | 0.2101 | |||
| FAST / Fastenal Company | 0.17 | 102.83 | 6.94 | 9.85 | 2.1961 | 0.0148 | |||
| MA / Mastercard Incorporated | 0.01 | 1.16 | 6.89 | 3.70 | 2.1814 | -0.1137 | |||
| INTU / Intuit Inc. | 0.01 | 6.72 | 6.46 | 36.90 | 2.0429 | 0.4146 | |||
| RSG / Republic Services, Inc. | 0.03 | 2.52 | 6.39 | 4.41 | 2.0228 | -0.0912 | |||
| MCHP / Microchip Technology Incorporated | 0.09 | 7.79 | 6.30 | 56.70 | 1.9951 | 0.6058 | |||
| ETR / Entergy Corporation | 0.07 | -0.31 | 6.20 | -3.08 | 1.9616 | -0.2467 | |||
| AMAT / Applied Materials, Inc. | 0.03 | 0.65 | 6.11 | 26.98 | 1.9320 | 0.2718 | |||
| BAH / Booz Allen Hamilton Holding Corporation | 0.06 | 2.54 | 5.81 | 2.09 | 1.8390 | -0.1263 | |||
| XOM / Exxon Mobil Corporation | 0.05 | 2.07 | 5.45 | -7.48 | 1.7235 | -0.3091 | |||
| NEE / NextEra Energy, Inc. | 0.07 | 1.86 | 5.17 | -0.25 | 1.6353 | -0.1535 | |||
| DPZ / Domino's Pizza, Inc. | 0.01 | 1.87 | 5.04 | -0.08 | 1.5961 | -0.1470 | |||
| CSCO / Cisco Systems, Inc. | 0.07 | 0.76 | 5.04 | 13.27 | 1.5935 | 0.0587 | |||
| CVX / Chevron Corporation | 0.03 | 3.21 | 4.68 | -11.67 | 1.4809 | -0.3482 | |||
| LOW / Lowe's Companies, Inc. | 0.02 | 2.49 | 4.38 | -2.49 | 1.3855 | -0.1651 | |||
| BA / The Boeing Company | 0.02 | 1.59 | 4.33 | 24.83 | 1.3696 | 0.1723 | |||
| VZ / Verizon Communications Inc. | 0.10 | 1.31 | 4.28 | -3.34 | 1.3537 | -0.1747 | |||
| ELV / Elevance Health, Inc. | 0.01 | 6.60 | 4.20 | -4.68 | 1.3286 | -0.1923 | |||
| SO / The Southern Company | 0.04 | 0.67 | 4.11 | 0.54 | 1.3014 | -0.1109 | |||
| UNH / UnitedHealth Group Incorporated | 0.01 | 12.43 | 3.96 | -33.04 | 1.2526 | -0.7883 | |||
| PEG / Public Service Enterprise Group Incorporated | 0.05 | 1.21 | 3.91 | 3.52 | 1.2381 | -0.0669 | |||
| MRK / Merck & Co., Inc. | 0.05 | 2.92 | 3.57 | -9.22 | 1.1304 | -0.2285 | |||
| UPS / United Parcel Service, Inc. | 0.03 | 2.85 | 3.32 | -5.62 | 1.0517 | -0.1640 | |||
| DHI / D.R. Horton, Inc. | 0.02 | 18.39 | 2.07 | 20.05 | 0.6541 | 0.0596 | |||
| RSP / Invesco Exchange-Traded Fund Trust - Invesco S&P 500 Equal Weight ETF | 0.00 | -50.63 | 0.88 | -48.21 | 0.2789 | -0.3086 | |||
| SCHD / Schwab Strategic Trust - Schwab U.S. Dividend Equity ETF | 0.03 | -0.67 | 0.77 | -5.89 | 0.2429 | -0.0386 | |||
| ASML / ASML Holding N.V. - Depositary Receipt (Common Stock) | 0.00 | 33.00 | 0.75 | 61.08 | 0.2371 | 0.0763 | |||
| IBM / International Business Machines Corporation | 0.00 | 0.04 | 0.70 | 18.61 | 0.2218 | 0.0177 | |||
| ECL / Ecolab Inc. | 0.00 | 0.27 | 0.59 | 6.50 | 0.1869 | -0.0045 | |||
| WMT / Walmart Inc. | 0.00 | 0.46 | 0.34 | 11.80 | 0.1082 | 0.0027 | |||
| IWS / iShares Trust - iShares Russell Mid-Cap Value ETF | 0.00 | 0.00 | 0.34 | 4.69 | 0.1062 | -0.0043 | |||
| SMPL / The Simply Good Foods Company | 0.01 | 0.00 | 0.32 | -8.43 | 0.1000 | -0.0191 | |||
| QQQ / Invesco QQQ Trust, Series 1 | 0.00 | 9.20 | 0.26 | 28.43 | 0.0830 | 0.0125 | |||
| PEP / PepsiCo, Inc. | 0.00 | 0.26 | 0.26 | -11.68 | 0.0815 | -0.0192 | |||
| T / AT&T Inc. | 0.01 | 0.71 | 0.25 | 2.89 | 0.0789 | -0.0046 | |||
| APP / AppLovin Corporation | 0.00 | 0.23 | 0.0712 | 0.0712 | |||||
| AVGO / Broadcom Inc. | 0.00 | 0.22 | 0.0700 | 0.0700 | |||||
| GE / General Electric Company | 0.00 | 0.21 | 0.0663 | 0.0663 |