Mga Batayang Estadistika
| Profil Orang Dalam | ROYAL BANK OF SCOTLAND GROUP PLC |
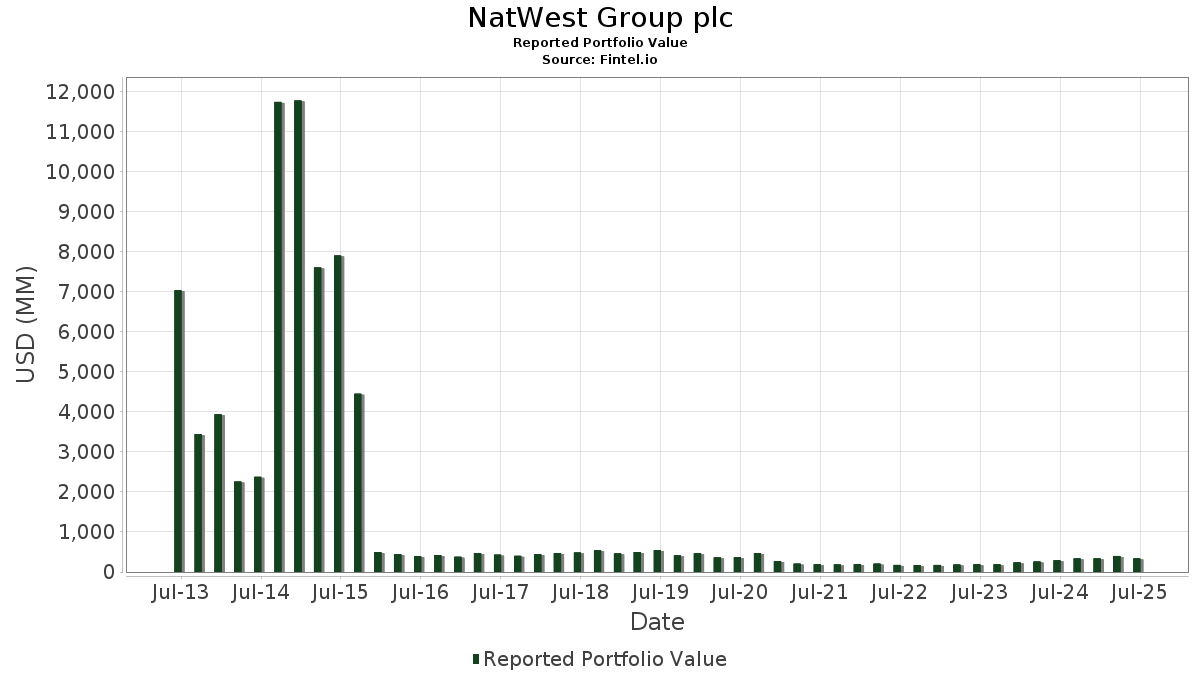
| Nilai Portofolio | $ 338,217,531 |
| Posisi Saat Ini | 32 |
Kepemilikan Terbaru, Kinerja, AUM (dari 13F, 13D)
NatWest Group plc telah mengungkapkan total kepemilikan 32 dalam pengajuan SEC terbaru mereka. Nilai portofolio terbaru dihitung sebesar $ 338,217,531 USD. Aset yang Dikelola (AUM) sebenarnya adalah nilai ini ditambah kas (yang tidak diungkapkan). Aset-aset utama NatWest Group plc adalah Microsoft Corporation (US:MSFT) , Meta Platforms, Inc. (US:META) , NVIDIA Corporation (US:NVDA) , Netflix, Inc. (US:NFLX) , and CME Group Inc. (US:CME) . Posisi baru NatWest Group plc meliputi: Uber Technologies, Inc. (US:UBER) , Royal Caribbean Cruises Ltd. (US:RCL) , .
Peningkatan Tertinggi Kuartal Ini
Kami menggunakan perubahan dalam alokasi portofolio karena ini adalah metrik yang paling bermakna. Perubahan dapat disebabkan oleh perdagangan atau perubahan harga saham.
| Keamanan | Saham (MM) |
Nilai (Juta Dolar AS) |
Portfolio % | ΔPorsyento ng Portfolio |
|---|---|---|---|---|
| 0.04 | 21.77 | 6.4354 | 3.3222 | |
| 0.12 | 10.78 | 3.1887 | 3.1887 | |
| 0.03 | 10.54 | 3.1177 | 3.1177 | |
| 0.01 | 10.47 | 2.5815 | 2.5815 | |
| 0.01 | 10.06 | 2.4811 | 2.4811 | |
| 0.05 | 14.54 | 3.5865 | 2.4486 | |
| 0.09 | 15.61 | 3.8507 | 1.6816 | |
| 0.05 | 16.21 | 3.9986 | 1.2204 | |
| 0.11 | 18.17 | 4.4807 | 1.1236 | |
| 0.01 | 17.78 | 4.3847 | 1.0410 |
Penurunan Tertinggi Kuartal Ini
Kami menggunakan perubahan dalam alokasi portofolio karena ini adalah metrik yang paling bermakna. Perubahan dapat disebabkan oleh perdagangan atau perubahan harga saham.
| Keamanan | Saham (MM) |
Nilai (Juta Dolar AS) |
Portfolio % | ΔPorsyento ng Portfolio |
|---|---|---|---|---|
| 0.05 | 5.99 | 1.4786 | -1.8121 | |
| 0.03 | 9.17 | 2.2608 | -1.5149 | |
| 0.09 | 3.14 | 0.7740 | -0.7634 | |
| 0.01 | 3.76 | 0.9283 | -0.6032 | |
| 0.02 | 8.30 | 2.0473 | -0.5267 | |
| 0.05 | 11.75 | 2.8979 | -0.5206 | |
| 0.18 | 13.74 | 3.3887 | -0.2885 | |
| 0.01 | 13.57 | 3.3469 | -0.2763 | |
| 0.05 | 9.08 | 2.2406 | -0.1163 | |
| 0.06 | 5.50 | 1.3555 | -0.0974 |
Pengajuan 13F dan Dana
Formulir ini diajukan pada 2025-07-31 untuk periode pelaporan 2025-06-30. Klik ikon tautan untuk melihat riwayat transaksi selengkapnya.
Tingkatkan ke versi premium untuk membuka data premium dan ekspor ke Excel. ![]() .
.
| Keamanan | Ketik | Harga Saham Rata-rata | Saham (MM) |
ΔSaham (%) |
ΔSaham (%) |
Nilai ($MM) |
Portpolyo (%) |
ΔPortofolio (%) |
|
|---|---|---|---|---|---|---|---|---|---|
| MSFT / Microsoft Corporation | 0.04 | 31.75 | 21.77 | 74.58 | 6.4354 | 3.3222 | |||
| META / Meta Platforms, Inc. | 0.03 | -1.81 | 18.59 | 25.74 | 4.5844 | 0.8934 | |||
| NVDA / NVIDIA Corporation | 0.11 | -7.31 | 18.17 | 35.12 | 4.4807 | 1.1236 | |||
| NFLX / Netflix, Inc. | 0.01 | -7.56 | 17.78 | 32.75 | 4.3847 | 1.0410 | |||
| CME / CME Group Inc. | 0.06 | 0.00 | 16.54 | 3.90 | 4.0790 | 0.1044 | |||
| V / Visa Inc. | 0.05 | 43.82 | 16.21 | 45.70 | 3.9986 | 1.2204 | |||
| GOOGL / Alphabet Inc. | 0.09 | 57.70 | 15.61 | 79.73 | 3.8507 | 1.6816 | |||
| AVGO / Broadcom Inc. | 0.05 | 93.82 | 14.54 | 219.14 | 3.5865 | 2.4486 | |||
| WFC / Wells Fargo & Company | 0.18 | -2.81 | 14.05 | 8.46 | 3.4651 | 0.2309 | |||
| EBAY / eBay Inc. | 0.18 | -15.14 | 13.74 | -6.71 | 3.3887 | -0.2885 | |||
| GILD / Gilead Sciences, Inc. | 0.12 | 2.46 | 13.69 | 1.39 | 3.3763 | 0.0049 | |||
| COST / Costco Wholesale Corporation | 0.01 | -10.66 | 13.57 | -6.49 | 3.3469 | -0.2763 | |||
| BKNG / Booking Holdings Inc. | 0.00 | -3.35 | 12.19 | 21.46 | 3.0058 | 0.5003 | |||
| CTAS / Cintas Corporation | 0.05 | -20.86 | 11.75 | -14.18 | 2.8979 | -0.5206 | |||
| UBER / Uber Technologies, Inc. | 0.12 | 10.78 | 3.1887 | 3.1887 | |||||
| RCL / Royal Caribbean Cruises Ltd. | 0.03 | 10.54 | 3.1177 | 3.1177 | |||||
| INTU / Intuit Inc. | 0.01 | 10.47 | 2.5815 | 2.5815 | |||||
| FTXP / Foothills Exploration, Inc. | 0.01 | 10.06 | 2.4811 | 2.4811 | |||||
| JPM / JPMorgan Chase & Co. | 0.03 | -48.71 | 9.17 | -39.38 | 2.2608 | -1.5149 | |||
| HWM / Howmet Aerospace Inc. | 0.05 | -32.92 | 9.08 | -3.76 | 2.2406 | -0.1163 | |||
| IVV / iShares Trust - iShares Core S&P 500 ETF | 0.01 | -0.11 | 8.68 | 10.38 | 2.1402 | 0.1772 | |||
| MCO / Moody's Corporation | 0.02 | -25.24 | 8.30 | -19.48 | 2.0473 | -0.5267 | |||
| NRG / NRG Energy, Inc. | 0.05 | -48.31 | 7.73 | -13.06 | 2.2861 | 0.0657 | |||
| KR / The Kroger Co. | 0.10 | 0.82 | 7.23 | 6.84 | 1.7837 | 0.0935 | |||
| MS / Morgan Stanley | 0.05 | 0.18 | 7.09 | 20.96 | 1.7485 | 0.2850 | |||
| KMB / Kimberly-Clark Corporation | 0.05 | -49.82 | 5.99 | -54.52 | 1.4786 | -1.8121 | |||
| CL / Colgate-Palmolive Company | 0.06 | -2.64 | 5.50 | -5.55 | 1.3555 | -0.0974 | |||
| MSI / Motorola Solutions, Inc. | 0.01 | -36.11 | 3.76 | -38.64 | 0.9283 | -0.6032 | |||
| UBS / UBS Group AG | 0.09 | -53.84 | 3.14 | -49.03 | 0.7740 | -0.7634 | |||
| LOGI / Logitech International S.A. | 0.02 | -2.17 | 2.05 | 4.44 | 0.5046 | 0.0156 | |||
| TDG / TransDigm Group Incorporated | 0.00 | -16.23 | 0.24 | -7.95 | 0.0719 | 0.0060 | |||
| CNQ / Canadian Natural Resources Limited | 0.01 | 0.00 | 0.23 | 1.81 | 0.0556 | 0.0004 | |||
| LLY / Eli Lilly and Company | 0.00 | -100.00 | 0.00 | 0.0000 | |||||
| WRB / W. R. Berkley Corporation | 0.00 | -100.00 | 0.00 | 0.0000 | |||||
| LIN / Linde plc | 0.00 | -100.00 | 0.00 | 0.0000 | |||||
| AXP / American Express Company | 0.00 | -100.00 | 0.00 | 0.0000 | |||||
| AAPL / Apple Inc. | 0.00 | -100.00 | 0.00 | 0.0000 | |||||
| AMZN / Amazon.com, Inc. | 0.00 | -100.00 | 0.00 | 0.0000 |