Mga Batayang Estadistika
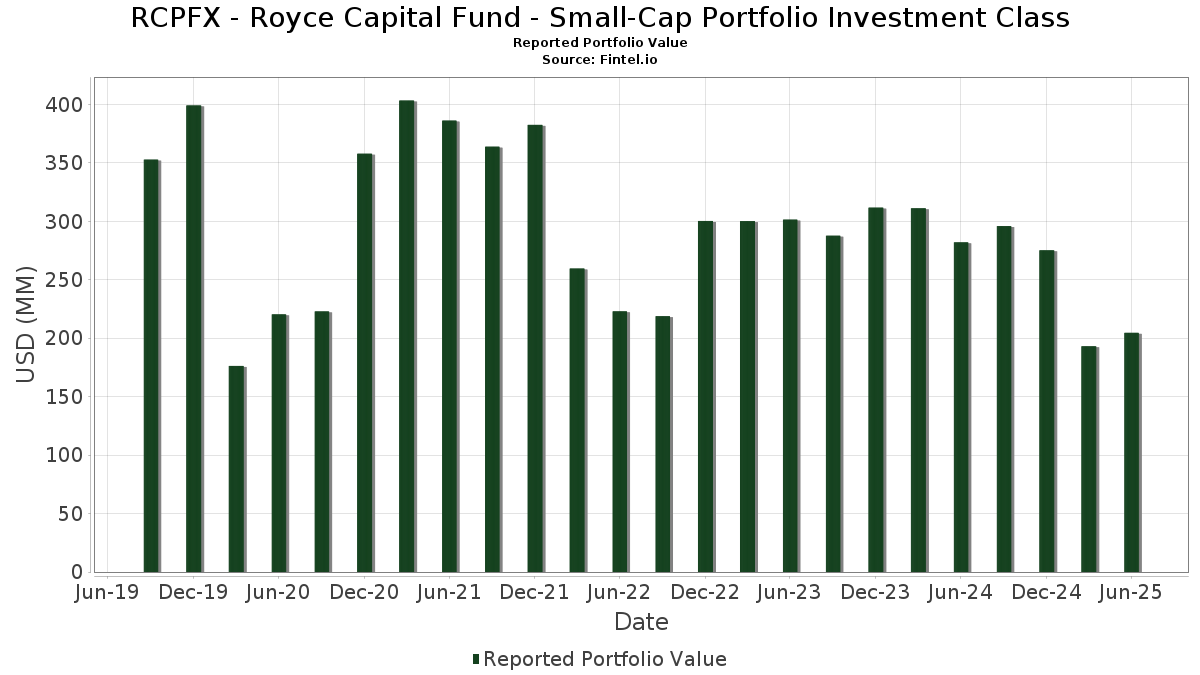
| Nilai Portofolio | $ 204,567,175 |
| Posisi Saat Ini | 81 |
Kepemilikan Terbaru, Kinerja, AUM (dari 13F, 13D)
RCPFX - Royce Capital Fund - Small-Cap Portfolio Investment Class telah mengungkapkan total kepemilikan 81 dalam pengajuan SEC terbaru mereka. Nilai portofolio terbaru dihitung sebesar $ 204,567,175 USD. Aset yang Dikelola (AUM) sebenarnya adalah nilai ini ditambah kas (yang tidak diungkapkan). Aset-aset utama RCPFX - Royce Capital Fund - Small-Cap Portfolio Investment Class adalah Diebold Nixdorf, Incorporated (US:DBD) , IBEX Limited (US:IBEX) , The Buckle, Inc. (US:BKE) , Sanmina Corporation (US:SANM) , and Flex Ltd. (US:FLEX) . Posisi baru RCPFX - Royce Capital Fund - Small-Cap Portfolio Investment Class meliputi: Steelcase Inc. (US:SCS) , Blue Bird Corporation (US:BLBD) , Cabot Corporation (US:CBT) , Entrada Therapeutics, Inc. (US:TRDA) , and .
Peningkatan Tertinggi Kuartal Ini
Kami menggunakan perubahan dalam alokasi portofolio karena ini adalah metrik yang paling bermakna. Perubahan dapat disebabkan oleh perdagangan atau perubahan harga saham.
| Keamanan | Saham (MM) |
Nilai (Juta Dolar AS) |
Portfolio % | ΔPorsyento ng Portfolio |
|---|---|---|---|---|
| 2.35 | 1.1512 | 1.1512 | ||
| 0.05 | 2.06 | 1.0078 | 0.8342 | |
| 0.15 | 1.62 | 0.7904 | 0.7904 | |
| 0.18 | 2.55 | 1.2482 | 0.7761 | |
| 0.04 | 1.54 | 0.7532 | 0.7532 | |
| 0.02 | 1.53 | 0.7486 | 0.7486 | |
| 0.01 | 3.93 | 1.9226 | 0.6016 | |
| 0.01 | 2.95 | 1.4438 | 0.5233 | |
| 0.15 | 1.01 | 0.4964 | 0.4964 | |
| 0.07 | 1.48 | 0.7237 | 0.4645 |
Penurunan Tertinggi Kuartal Ini
Kami menggunakan perubahan dalam alokasi portofolio karena ini adalah metrik yang paling bermakna. Perubahan dapat disebabkan oleh perdagangan atau perubahan harga saham.
| Keamanan | Saham (MM) |
Nilai (Juta Dolar AS) |
Portfolio % | ΔPorsyento ng Portfolio |
|---|---|---|---|---|
| 0.06 | 1.60 | 0.7849 | -0.8538 | |
| 0.08 | 1.00 | 0.4902 | -0.7548 | |
| 0.06 | 0.49 | 0.2409 | -0.7046 | |
| 0.01 | 3.19 | 1.5583 | -0.4267 | |
| 0.13 | 1.84 | 0.8982 | -0.3712 | |
| 0.09 | 1.64 | 0.8005 | -0.3615 | |
| 0.10 | 3.68 | 1.7978 | -0.3299 | |
| 0.19 | 2.03 | 0.9926 | -0.3086 | |
| 0.06 | 1.66 | 0.8134 | -0.2993 | |
| 0.07 | 1.52 | 0.7441 | -0.2882 |
Pengajuan 13F dan Dana
Formulir ini diajukan pada 2025-08-15 untuk periode pelaporan 2025-06-30. Klik ikon tautan untuk melihat riwayat transaksi selengkapnya.
Tingkatkan ke versi premium untuk membuka data premium dan ekspor ke Excel. ![]() .
.
| Keamanan | Ketik | Harga Saham Rata-rata | Saham (MM) |
ΔSaham (%) |
ΔSaham (%) |
Nilai ($MM) |
Portpolyo (%) |
ΔPortofolio (%) |
|
|---|---|---|---|---|---|---|---|---|---|
| DBD / Diebold Nixdorf, Incorporated | 0.08 | -12.48 | 4.16 | 10.90 | 2.0353 | 0.0910 | |||
| IBEX / IBEX Limited | 0.14 | -7.91 | 4.02 | 10.05 | 1.9663 | 0.0735 | |||
| BKE / The Buckle, Inc. | 0.09 | 11.21 | 4.02 | 31.62 | 1.9654 | 0.3834 | |||
| SANM / Sanmina Corporation | 0.04 | -14.18 | 3.99 | 10.24 | 1.9495 | 0.0756 | |||
| FLEX / Flex Ltd. | 0.08 | -18.87 | 3.94 | 22.45 | 1.9267 | 0.2596 | |||
| EVR / Evercore Inc. | 0.01 | 14.04 | 3.93 | 54.18 | 1.9226 | 0.6016 | |||
| JBL / Jabil Inc. | 0.02 | -17.89 | 3.80 | 31.61 | 1.8597 | 0.3627 | |||
| VC / Visteon Corporation | 0.04 | 0.00 | 3.73 | 20.20 | 1.8253 | 0.2166 | |||
| TIPT / Tiptree Inc. | 0.16 | -0.34 | 3.71 | -2.44 | 1.8156 | -0.1562 | |||
| VLGEA / Village Super Market, Inc. | 0.10 | -11.62 | 3.68 | -10.48 | 1.7978 | -0.3299 | |||
| PHM / PulteGroup, Inc. | 0.03 | 0.00 | 3.66 | 2.58 | 1.7903 | -0.0585 | |||
| LEA / Lear Corporation | 0.04 | 0.00 | 3.64 | 7.65 | 1.7825 | 0.0285 | |||
| TSBK / Timberland Bancorp, Inc. | 0.11 | 0.00 | 3.57 | 3.47 | 1.7486 | -0.0415 | |||
| ALSN / Allison Transmission Holdings, Inc. | 0.04 | -5.57 | 3.52 | -6.24 | 1.7204 | -0.2234 | |||
| BHRB / Burke & Herbert Financial Services Corp. | 0.06 | 0.00 | 3.46 | 6.43 | 1.6925 | 0.0081 | |||
| UNTY / Unity Bancorp, Inc. | 0.07 | 0.00 | 3.40 | 15.70 | 1.6653 | 0.1402 | |||
| TGNA / TEGNA Inc. | 0.20 | 0.00 | 3.32 | -8.03 | 1.6246 | -0.2464 | |||
| SNX / TD SYNNEX Corporation | 0.02 | 0.00 | 3.29 | 30.56 | 1.6096 | 0.3032 | |||
| MOH / Molina Healthcare, Inc. | 0.01 | -8.04 | 3.19 | -16.84 | 1.5583 | -0.4267 | |||
| TPH / Tri Pointe Homes, Inc. | 0.10 | 0.00 | 3.18 | 0.09 | 1.5569 | -0.0909 | |||
| ARCB / ArcBest Corporation | 0.04 | 25.68 | 3.12 | 37.17 | 1.5274 | 0.3474 | |||
| MTDR / Matador Resources Company | 0.06 | 13.39 | 3.09 | 5.89 | 1.5141 | -0.0005 | |||
| FRBA / First Bank | 0.20 | 21.30 | 3.09 | 26.69 | 1.5119 | 0.2478 | |||
| MHO / M/I Homes, Inc. | 0.03 | 0.00 | 3.08 | -1.82 | 1.5046 | -0.1186 | |||
| CHRD / Chord Energy Corporation | 0.03 | 46.45 | 3.02 | 25.83 | 1.4754 | 0.2333 | |||
| CPRX / Catalyst Pharmaceuticals, Inc. | 0.14 | 5.40 | 3.01 | -5.70 | 1.4739 | -0.1816 | |||
| STRL / Sterling Infrastructure, Inc. | 0.01 | -18.47 | 2.95 | 66.16 | 1.4438 | 0.5233 | |||
| MTH / Meritage Homes Corporation | 0.04 | 0.00 | 2.93 | -5.54 | 1.4358 | -0.1741 | |||
| TNK / Teekay Tankers Ltd. | 0.07 | -3.53 | 2.93 | 5.17 | 1.4341 | -0.0105 | |||
| ACT / Enact Holdings, Inc. | 0.08 | 0.00 | 2.91 | 6.90 | 1.4255 | 0.0129 | |||
| GNK / Genco Shipping & Trading Limited | 0.22 | 15.62 | 2.91 | 13.14 | 1.4241 | 0.0903 | |||
| NEU / NewMarket Corporation | 0.00 | 0.00 | 2.89 | 22.00 | 1.4134 | 0.1857 | |||
| AMKR / Amkor Technology, Inc. | 0.14 | 5.12 | 2.84 | 22.17 | 1.3885 | 0.1845 | |||
| PLUS / ePlus inc. | 0.04 | 6.38 | 2.80 | 25.72 | 1.3704 | 0.2152 | |||
| BBSI / Barrett Business Services, Inc. | 0.06 | 0.00 | 2.68 | 1.33 | 1.3094 | -0.0598 | |||
| HFWA / Heritage Financial Corporation | 0.11 | 0.00 | 2.63 | -2.01 | 1.2882 | -0.1046 | |||
| UVSP / Univest Financial Corporation | 0.09 | 0.00 | 2.63 | 5.93 | 1.2860 | -0.0002 | |||
| FTDR / Frontdoor, Inc. | 0.04 | -14.01 | 2.63 | 31.94 | 1.2854 | 0.2531 | |||
| COLL / Collegium Pharmaceutical, Inc. | 0.09 | -3.20 | 2.61 | -4.12 | 1.2753 | -0.1336 | |||
| MPB / Mid Penn Bancorp, Inc. | 0.09 | 0.00 | 2.58 | 8.83 | 1.2606 | 0.0336 | |||
| ADEA / Adeia Inc. | 0.18 | 161.90 | 2.55 | 180.33 | 1.2482 | 0.7761 | |||
| KFY / Korn Ferry | 0.03 | 0.00 | 2.54 | 8.08 | 1.2435 | 0.0250 | |||
| CCNE / CNB Financial Corporation | 0.11 | 5.54 | 2.53 | 8.44 | 1.2389 | 0.0285 | |||
| OCFC / OceanFirst Financial Corp. | 0.14 | 36.02 | 2.52 | 40.80 | 1.2326 | 0.3053 | |||
| SM / SM Energy Company | 0.10 | 5.44 | 2.50 | -13.02 | 1.2224 | -0.2662 | |||
| IMXI / International Money Express, Inc. | 0.25 | 27.05 | 2.48 | 1.60 | 1.2152 | -0.0521 | |||
| TILE / Interface, Inc. | 0.12 | 54.56 | 2.47 | 63.06 | 1.2094 | 0.4236 | |||
| SIG / Signet Jewelers Limited | 0.03 | -24.37 | 2.45 | 3.63 | 1.2001 | -0.0269 | |||
| FIXED INC CLEARING CORP.REPO / RA (000000000) | 2.35 | 1.1512 | 1.1512 | ||||||
| ASO / Academy Sports and Outdoors, Inc. | 0.05 | 0.00 | 2.18 | -1.76 | 1.0641 | -0.0833 | |||
| BELFB / Bel Fuse Inc. | 0.02 | -18.80 | 2.13 | 5.98 | 1.0411 | 0.0003 | |||
| DCOM / Dime Community Bancshares, Inc. | 0.08 | 0.00 | 2.11 | -3.39 | 1.0336 | -0.0996 | |||
| ETD / Ethan Allen Interiors Inc. | 0.07 | 0.00 | 2.07 | 0.53 | 1.0128 | -0.0544 | |||
| FSBW / FS Bancorp, Inc. | 0.05 | 493.63 | 2.06 | 516.77 | 1.0078 | 0.8342 | |||
| MBC / MasterBrand, Inc. | 0.19 | -3.44 | 2.03 | -19.16 | 0.9926 | -0.3086 | |||
| MLR / Miller Industries, Inc. | 0.04 | 0.00 | 1.91 | 4.89 | 0.9348 | -0.0090 | |||
| WS / Worthington Steel, Inc. | 0.06 | 0.00 | 1.90 | 17.72 | 0.9299 | 0.0934 | |||
| WSBC / WesBanco, Inc. | 0.06 | 0.00 | 1.88 | 2.17 | 0.9199 | -0.0340 | |||
| JILL / J.Jill, Inc. | 0.13 | 0.00 | 1.84 | -25.03 | 0.8982 | -0.3712 | |||
| TRST / TrustCo Bank Corp NY | 0.05 | 0.00 | 1.83 | 9.63 | 0.8969 | 0.0303 | |||
| KTB / Kontoor Brands, Inc. | 0.03 | -3.43 | 1.83 | -0.65 | 0.8945 | -0.0594 | |||
| WSM / Williams-Sonoma, Inc. | 0.01 | 0.00 | 1.72 | 3.31 | 0.8397 | -0.0212 | |||
| REPX / Riley Exploration Permian, Inc. | 0.06 | -13.87 | 1.66 | -22.55 | 0.8134 | -0.2993 | |||
| CNXN / PC Connection, Inc. | 0.03 | 0.00 | 1.66 | 5.41 | 0.8097 | -0.0043 | |||
| SCVL / Shoe Carnival, Inc. | 0.09 | -14.22 | 1.64 | -27.03 | 0.8005 | -0.3615 | |||
| SCS / Steelcase Inc. | 0.15 | 1.62 | 0.7904 | 0.7904 | |||||
| CIVI / Civitas Resources, Inc. | 0.06 | -35.67 | 1.60 | -49.27 | 0.7849 | -0.8538 | |||
| WNEB / Western New England Bancorp, Inc. | 0.17 | 0.00 | 1.60 | -0.74 | 0.7841 | -0.0529 | |||
| BLBD / Blue Bird Corporation | 0.04 | 1.54 | 0.7532 | 0.7532 | |||||
| CBT / Cabot Corporation | 0.02 | 1.53 | 0.7486 | 0.7486 | |||||
| SLVM / Sylvamo Corporation | 0.03 | 34.89 | 1.53 | 0.79 | 0.7463 | -0.0384 | |||
| AMPH / Amphastar Pharmaceuticals, Inc. | 0.07 | -3.58 | 1.52 | -23.61 | 0.7441 | -0.2882 | |||
| GNTX / Gentex Corporation | 0.07 | 136.75 | 1.48 | 49.39 | 0.7237 | 0.4645 | |||
| BPRN / Princeton Bancorp, Inc. | 0.05 | 32.19 | 1.47 | 32.16 | 0.7180 | 0.1424 | |||
| UFPI / UFP Industries, Inc. | 0.01 | 0.00 | 1.36 | -7.16 | 0.6661 | -0.0941 | |||
| DMLP / Dorchester Minerals, L.P. - Limited Partnership | 0.04 | -19.20 | 1.19 | -25.17 | 0.5806 | -0.2413 | |||
| SIGA / SIGA Technologies, Inc. | 0.18 | -20.03 | 1.18 | -4.83 | 0.5779 | -0.0656 | |||
| CZWI / Citizens Community Bancorp, Inc. | 0.08 | 0.00 | 1.06 | -3.99 | 0.5176 | -0.0538 | |||
| TRDA / Entrada Therapeutics, Inc. | 0.15 | 1.01 | 0.4964 | 0.4964 | |||||
| CAL / Caleres, Inc. | 0.08 | -41.19 | 1.00 | -58.28 | 0.4902 | -0.7548 | |||
| CRGY / Crescent Energy Company | 0.06 | -64.73 | 0.49 | -73.03 | 0.2409 | -0.7046 |