Mga Batayang Estadistika
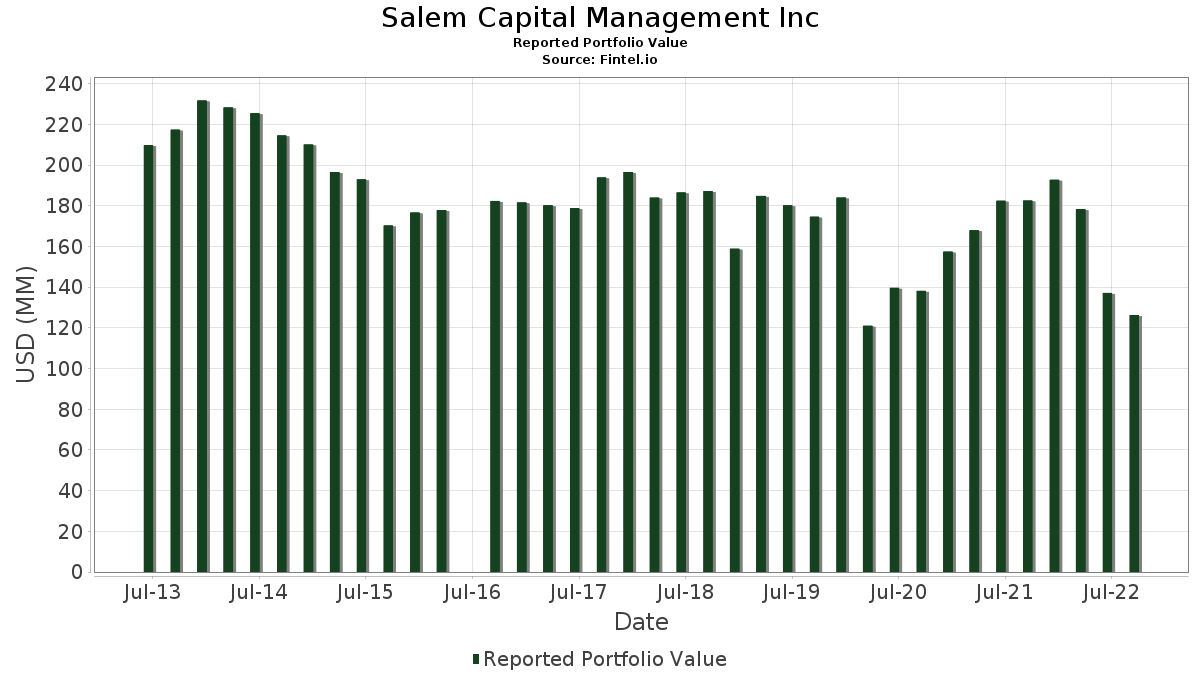
| Nilai Portofolio | $ 126,330,000 |
| Posisi Saat Ini | 55 |
Kepemilikan Terbaru, Kinerja, AUM (dari 13F, 13D)
Salem Capital Management Inc telah mengungkapkan total kepemilikan 55 dalam pengajuan SEC terbaru mereka. Nilai portofolio terbaru dihitung sebesar $ 126,330,000 USD. Aset yang Dikelola (AUM) sebenarnya adalah nilai ini ditambah kas (yang tidak diungkapkan). Aset-aset utama Salem Capital Management Inc adalah Microsoft Corporation (US:MSFT) , Merck & Co., Inc. (US:MRK) , Pfizer Inc. (US:PFE) , Bank of America Corporation - Preferred Stock (US:BAC.PRB) , and Honeywell International Inc. (US:HON) .
Peningkatan Tertinggi Kuartal Ini
Kami menggunakan perubahan dalam alokasi portofolio karena ini adalah metrik yang paling bermakna. Perubahan dapat disebabkan oleh perdagangan atau perubahan harga saham.
| Keamanan | Saham (MM) |
Nilai (Juta Dolar AS) |
Portfolio % | ΔPorsyento ng Portfolio |
|---|---|---|---|---|
| 0.07 | 2.62 | 2.0755 | 1.8932 | |
| 0.08 | 4.80 | 3.8027 | 0.5926 | |
| 0.02 | 4.23 | 3.3484 | 0.4671 | |
| 0.04 | 3.57 | 2.8283 | 0.2656 | |
| 0.03 | 4.01 | 3.1734 | 0.2600 | |
| 0.02 | 2.37 | 1.8760 | 0.2524 | |
| 0.20 | 5.97 | 4.7226 | 0.2395 | |
| 0.02 | 4.84 | 3.8304 | 0.1712 | |
| 0.03 | 5.59 | 4.4257 | 0.1701 | |
| 0.01 | 0.74 | 0.5874 | 0.1638 |
Penurunan Tertinggi Kuartal Ini
Kami menggunakan perubahan dalam alokasi portofolio karena ini adalah metrik yang paling bermakna. Perubahan dapat disebabkan oleh perdagangan atau perubahan harga saham.
| Keamanan | Saham (MM) |
Nilai (Juta Dolar AS) |
Portfolio % | ΔPorsyento ng Portfolio |
|---|---|---|---|---|
| 0.00 | 0.00 | -2.5532 | ||
| 0.11 | 3.40 | 2.6914 | -0.5800 | |
| 0.08 | 3.02 | 2.3866 | -0.5443 | |
| 0.14 | 6.05 | 4.7898 | -0.4960 | |
| 0.09 | 2.82 | 2.2315 | -0.4486 | |
| 0.19 | 5.32 | 4.2120 | -0.2871 | |
| 0.00 | 0.00 | -0.2114 | ||
| 0.04 | 8.86 | 7.0165 | -0.1743 | |
| 0.03 | 2.34 | 1.8491 | -0.1507 | |
| 0.00 | 0.27 | 0.2114 | -0.0861 |
Pengajuan 13F dan Dana
Formulir ini diajukan pada 2022-11-29 untuk periode pelaporan 2022-09-30. Klik ikon tautan untuk melihat riwayat transaksi selengkapnya.
Tingkatkan ke versi premium untuk membuka data premium dan ekspor ke Excel. ![]() .
.
| Keamanan | Ketik | Harga Saham Rata-rata | Saham (MM) |
ΔSaham (%) |
ΔSaham (%) |
Nilai ($MM) |
Portpolyo (%) |
ΔPortofolio (%) |
|
|---|---|---|---|---|---|---|---|---|---|
| MSFT / Microsoft Corporation | 0.04 | -0.89 | 8.86 | -10.13 | 7.0165 | -0.1743 | |||
| MRK / Merck & Co., Inc. | 0.08 | 0.16 | 7.04 | -5.39 | 5.5719 | 0.1476 | |||
| PFE / Pfizer Inc. | 0.14 | 0.00 | 6.05 | -16.54 | 4.7898 | -0.4960 | |||
| BAC.PRB / Bank of America Corporation - Preferred Stock | 0.20 | 0.00 | 5.97 | -2.98 | 4.7226 | 0.2395 | |||
| HON / Honeywell International Inc. | 0.03 | -0.30 | 5.59 | -4.21 | 4.4257 | 0.1701 | |||
| WY / Weyerhaeuser Company | 0.19 | 0.00 | 5.32 | -13.77 | 4.2120 | -0.2871 | |||
| CSCO / Cisco Systems, Inc. | 0.13 | 0.00 | 5.25 | -6.18 | 4.1574 | 0.0760 | |||
| PXD / Pioneer Natural Resources Company | 0.02 | -0.67 | 4.84 | -3.59 | 3.8304 | 0.1712 | |||
| DVN / Devon Energy Corporation | 0.08 | 0.00 | 4.80 | 9.11 | 3.8027 | 0.5926 | |||
| GLW / Corning Incorporated | 0.15 | 0.00 | 4.48 | -7.89 | 3.5494 | 0.0003 | |||
| LOW / Lowe's Companies, Inc. | 0.02 | -0.44 | 4.23 | 7.03 | 3.3484 | 0.4671 | |||
| CVX / Chevron Corporation | 0.03 | 1.09 | 4.01 | 0.33 | 3.1734 | 0.2600 | |||
| PCAR / PACCAR Inc | 0.04 | 0.00 | 3.57 | 1.65 | 2.8283 | 0.2656 | |||
| JNJ / Johnson & Johnson | 0.02 | 0.00 | 3.40 | -7.98 | 2.6929 | -0.0024 | |||
| IP / International Paper Company | 0.11 | 0.00 | 3.40 | -24.23 | 2.6914 | -0.5800 | |||
| FCX / Freeport-McMoRan Inc. | 0.12 | 2.09 | 3.27 | -4.64 | 2.5877 | 0.0884 | |||
| BWA / BorgWarner Inc. | 0.10 | 0.00 | 3.23 | -5.91 | 2.5576 | 0.0539 | |||
| VZ / Verizon Communications Inc. | 0.08 | 0.26 | 3.02 | -25.00 | 2.3866 | -0.5443 | |||
| AMJ / JPMorgan Alerian MLP Index ETN - Corporate Bond/Note | 0.03 | 0.36 | 2.94 | -6.87 | 2.3288 | 0.0257 | |||
| GAFFX / Growth Fund Of America - Growth Fund of America - Class F-3 | 0.07 | -0.53 | 2.86 | -8.68 | 2.2647 | -0.0195 | |||
| WRK / WestRock Company | 0.09 | -1.08 | 2.82 | -23.31 | 2.2315 | -0.4486 | |||
| SLB / Schlumberger Limited | 0.07 | 943.71 | 2.62 | 948.80 | 2.0755 | 1.8932 | |||
| COST / Costco Wholesale Corporation | 0.01 | -0.29 | 2.41 | -1.75 | 1.9109 | 0.1195 | |||
| ETN / Eaton Corporation plc | 0.02 | 0.51 | 2.37 | 6.42 | 1.8760 | 0.2524 | |||
| RTX / RTX Corporation | 0.03 | 0.00 | 2.34 | -14.84 | 1.8491 | -0.1507 | |||
| NOK / Nokia Oyj - Depositary Receipt (Common Stock) | 0.53 | 9.45 | 2.27 | 1.34 | 1.7961 | 0.1637 | |||
| APTV / Aptiv PLC | 0.03 | 0.82 | 2.17 | -11.48 | 1.7146 | -0.0695 | |||
| ABT / Abbott Laboratories | 0.02 | 0.00 | 1.56 | -10.98 | 1.2325 | -0.0427 | |||
| PAYX / Paychex, Inc. | 0.01 | 0.00 | 1.44 | -1.50 | 1.1407 | 0.0740 | |||
| EOG / EOG Resources, Inc. | 0.01 | 0.00 | 1.28 | 1.11 | 1.0124 | 0.0901 | |||
| NVS / Novartis AG - Depositary Receipt (Common Stock) | 0.02 | -1.21 | 1.25 | -11.13 | 0.9855 | -0.0359 | |||
| HD / The Home Depot, Inc. | 0.00 | 0.00 | 1.05 | 0.57 | 0.8351 | 0.0703 | |||
| AAPL / Apple Inc. | 0.01 | -2.68 | 1.00 | -1.67 | 0.7940 | 0.0503 | |||
| LLY / Eli Lilly and Company | 0.00 | 0.00 | 0.94 | -0.21 | 0.7417 | 0.0571 | |||
| AVGO / Broadcom Inc. | 0.00 | 0.00 | 0.79 | -8.67 | 0.6253 | -0.0053 | |||
| PYPL / PayPal Holdings, Inc. | 0.01 | 3.60 | 0.74 | 27.71 | 0.5874 | 0.1638 | |||
| ADI / Analog Devices, Inc. | 0.00 | 0.00 | 0.64 | -4.59 | 0.5098 | 0.0176 | |||
| PG / The Procter & Gamble Company | 0.00 | 0.00 | 0.56 | -12.24 | 0.4425 | -0.0219 | |||
| ADP / Automatic Data Processing, Inc. | 0.00 | 4.04 | 0.54 | 12.01 | 0.4282 | 0.0761 | |||
| CL / Colgate-Palmolive Company | 0.01 | 0.00 | 0.51 | -12.41 | 0.4021 | -0.0207 | |||
| NFG / National Fuel Gas Company | 0.01 | 0.00 | 0.48 | -6.81 | 0.3792 | 0.0044 | |||
| CVS / CVS Health Corporation | 0.00 | 0.00 | 0.46 | 2.92 | 0.3625 | 0.0381 | |||
| PNC / The PNC Financial Services Group, Inc. | 0.00 | 0.00 | 0.46 | -5.20 | 0.3610 | 0.0103 | |||
| NSRGY / Nestlé S.A. - Depositary Receipt (Common Stock) | 0.00 | 0.00 | 0.42 | -7.54 | 0.3301 | 0.0013 | |||
| COP / ConocoPhillips | 0.00 | 0.00 | 0.41 | 13.93 | 0.3238 | 0.0620 | |||
| AVB / AvalonBay Communities, Inc. | 0.00 | 0.00 | 0.35 | -5.11 | 0.2794 | 0.0082 | |||
| KCDMY / Kimberly-Clark de México, S. A. B. de C. V. - Depositary Receipt (Common Stock) | 0.00 | 0.00 | 0.34 | -16.75 | 0.2715 | -0.0289 | |||
| NEE.PRN / NextEra Energy Capital Holdings, Inc. - Corporate Bond/Note | 0.00 | 0.00 | 0.31 | 1.29 | 0.2486 | 0.0225 | |||
| FDX / FedEx Corporation | 0.00 | 0.00 | 0.27 | -34.56 | 0.2114 | -0.0861 | |||
| ABBV / AbbVie Inc. | 0.00 | 0.00 | 0.26 | -12.37 | 0.2019 | -0.0103 | |||
| SYK / Stryker Corporation | 0.00 | 0.00 | 0.25 | 1.65 | 0.1947 | 0.0183 | |||
| KO / The Coca-Cola Company | 0.00 | 3.79 | 0.24 | -7.58 | 0.1931 | 0.0007 | |||
| BK / The Bank of New York Mellon Corporation | 0.01 | 0.00 | 0.22 | -7.56 | 0.1741 | 0.0006 | |||
| GIS / General Mills, Inc. | 0.00 | 0.00 | 0.21 | 1.90 | 0.1702 | 0.0164 | |||
| CTAS / Cintas Corporation | 0.00 | 0.00 | 0.21 | 4.39 | 0.1694 | 0.0199 | |||
| INTC / Intel Corporation | 0.00 | -100.00 | 0.00 | -100.00 | -0.2114 | ||||
| CMCSA / Comcast Corporation | 0.00 | -100.00 | 0.00 | -100.00 | -2.5532 |